Free Statistics

of Irreproducible Research!

Author's title

Author*The author of this computation has been verified*
R Software Modulerwasp_autocorrelation.wasp
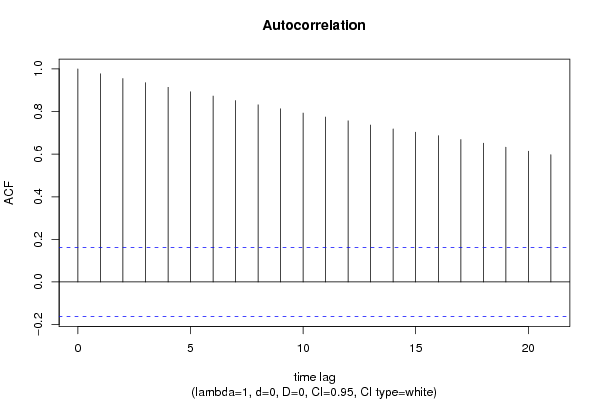
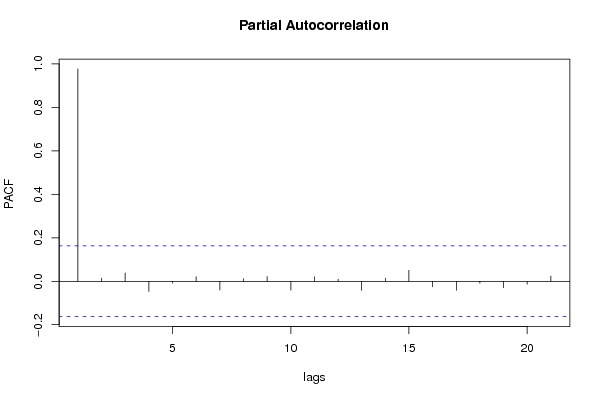
Title produced by software(Partial) Autocorrelation Function
Date of computationSun, 13 Dec 2009 02:24:34 -0700
Cite this page as followsStatistical Computations at FreeStatistics.org, Office for Research Development and Education, URL https://freestatistics.org/blog/index.php?v=date/2009/Dec/13/t1260696307f9kpk9kv5ytd6rt.htm/, Retrieved Sat, 27 Apr 2024 21:42:46 +0000
Statistical Computations at FreeStatistics.org, Office for Research Development and Education, URL https://freestatistics.org/blog/index.php?pk=67168, Retrieved Sat, 27 Apr 2024 21:42:46 +0000
QR Codes:

Original text written by user:
IsPrivate?No (this computation is public)
User-defined keywords
Estimated Impact145
Family? (F = Feedback message, R = changed R code, M = changed R Module, P = changed Parameters, D = changed Data)
-     [Bivariate Data Series] [Bivariate dataset] [2008-01-05 23:51:08] [74be16979710d4c4e7c6647856088456]
F RMPD  [Univariate Explorative Data Analysis] [Colombia Coffee] [2008-01-07 14:21:11] [74be16979710d4c4e7c6647856088456]
F RMPD    [Univariate Data Series] [] [2009-10-14 08:30:28] [74be16979710d4c4e7c6647856088456]
- RMPD        [(Partial) Autocorrelation Function] [paper link 8] [2009-12-13 09:24:34] [a18540c86166a2b66550d1fef0503cc2] [Current]
Feedback Forum

Post a new message
Dataseries X:
1213.8
1245.6
1306.3
1255.8
1257.6
1287.8
1300.4
1320.9
1370.8
1327.3
1320
1345.3
1346.7
1395.4
1462
1491.6
1461.8
1477.9
1490.3
1521.1
1561.9
1552.6
1523.6
1548.3
1552.4
1587
1621.3
1648.7
1641.8
1650.6
1688.6
1670.7
1682.2
1678.9
1650.6
1662.4
1664.5
1683.2
1736.2
1747.6
1749
1759.7
1793.6
1817.4
1858.4
1839.9
1809.1
1877.7
1880.3
1930.9
2039.3
1992.7
1987.8
1984.4
2016.5
2016.7
2064.1
2031.5
2000.3
2057.8
2041.2
2093.2
2158.3
2128.8
2131.9
2170.3
2190.8
2217.7
2254.4
2223.3
2210.5
2250.8
2249.1
2288.6
2329.2
2313.8
2309.8
2345.9
2361.3
2372
2410.4
2398.5
2362.3
2419.1
2421.6
2465
2480.5
2506.1
2506.6
2525.8
2550
2578.3
2807.8
2815.3
2767.7
2815.4
2838.8
2864
2948.6
2922.8
2917.2
2936.8
2993.4
3007.8
3046.3
3011.5
2958.6
3019.8
2998.5
3040.4
3166
3110
3099.2
3150.3
3163.6
3182.6
3244.4
3223.2
3143.6
3217
3182.3
3217.2
3262.5
3227.9
3171.6
3219
3195.4
3221.6
3262.1
3179.5
3133.6
3219.2
3245
3265.3
3312.5
3383.6
3386.3
3411.1
3467.2
3487.7
3575.5
3571.5
3582.3
3637.1
3685


Summary of computational transaction
Raw Inputview raw input (R code)
Raw Outputview raw output of R engine
Computing time1 seconds
R Server'Gwilym Jenkins' @ 72.249.127.135

\begin{tabular}{lllllllll}
\hline
Summary of computational transaction \tabularnewline
Raw Input & view raw input (R code)  \tabularnewline
Raw Output & view raw output of R engine  \tabularnewline
Computing time & 1 seconds \tabularnewline
R Server & 'Gwilym Jenkins' @ 72.249.127.135 \tabularnewline
\hline
\end{tabular}
%Source: https://freestatistics.org/blog/index.php?pk=67168&T=0

[TABLE]
[ROW][C]Summary of computational transaction[/C][/ROW]
[ROW][C]Raw Input[/C][C]view raw input (R code) [/C][/ROW]
[ROW][C]Raw Output[/C][C]view raw output of R engine [/C][/ROW]
[ROW][C]Computing time[/C][C]1 seconds[/C][/ROW]
[ROW][C]R Server[/C][C]'Gwilym Jenkins' @ 72.249.127.135[/C][/ROW]
[/TABLE]
Source: https://freestatistics.org/blog/index.php?pk=67168&T=0

Globally Unique Identifier (entire table): ba.freestatistics.org/blog/index.php?pk=67168&T=0

As an alternative you can also use a QR Code:  

The GUIDs for individual cells are displayed in the table below:

Summary of computational transaction
Raw Inputview raw input (R code)
Raw Outputview raw output of R engine
Computing time1 seconds
R Server'Gwilym Jenkins' @ 72.249.127.135


Autocorrelation Function
Time lag kACF(k)T-STATP-value
10.97690711.76350
20.95500911.49980
30.9353211.26270
40.91386411.00440
50.8925310.74750
60.87282210.51020
70.85163710.25510
80.83143310.01180
90.8129079.78870
100.7927119.54550
110.7738959.31890
120.7562699.10670
130.7368088.87230
140.7185138.6520
150.7033198.46910
160.686818.27030
170.6687758.05310
180.6513667.84350
190.6328177.62010
200.6140547.39420
210.5973017.19250

\begin{tabular}{lllllllll}
\hline
Autocorrelation Function \tabularnewline
Time lag k & ACF(k) & T-STAT & P-value \tabularnewline
1 & 0.976907 & 11.7635 & 0 \tabularnewline
2 & 0.955009 & 11.4998 & 0 \tabularnewline
3 & 0.93532 & 11.2627 & 0 \tabularnewline
4 & 0.913864 & 11.0044 & 0 \tabularnewline
5 & 0.89253 & 10.7475 & 0 \tabularnewline
6 & 0.872822 & 10.5102 & 0 \tabularnewline
7 & 0.851637 & 10.2551 & 0 \tabularnewline
8 & 0.831433 & 10.0118 & 0 \tabularnewline
9 & 0.812907 & 9.7887 & 0 \tabularnewline
10 & 0.792711 & 9.5455 & 0 \tabularnewline
11 & 0.773895 & 9.3189 & 0 \tabularnewline
12 & 0.756269 & 9.1067 & 0 \tabularnewline
13 & 0.736808 & 8.8723 & 0 \tabularnewline
14 & 0.718513 & 8.652 & 0 \tabularnewline
15 & 0.703319 & 8.4691 & 0 \tabularnewline
16 & 0.68681 & 8.2703 & 0 \tabularnewline
17 & 0.668775 & 8.0531 & 0 \tabularnewline
18 & 0.651366 & 7.8435 & 0 \tabularnewline
19 & 0.632817 & 7.6201 & 0 \tabularnewline
20 & 0.614054 & 7.3942 & 0 \tabularnewline
21 & 0.597301 & 7.1925 & 0 \tabularnewline
\hline
\end{tabular}
%Source: https://freestatistics.org/blog/index.php?pk=67168&T=1

[TABLE]
[ROW][C]Autocorrelation Function[/C][/ROW]
[ROW][C]Time lag k[/C][C]ACF(k)[/C][C]T-STAT[/C][C]P-value[/C][/ROW]
[ROW][C]1[/C][C]0.976907[/C][C]11.7635[/C][C]0[/C][/ROW]
[ROW][C]2[/C][C]0.955009[/C][C]11.4998[/C][C]0[/C][/ROW]
[ROW][C]3[/C][C]0.93532[/C][C]11.2627[/C][C]0[/C][/ROW]
[ROW][C]4[/C][C]0.913864[/C][C]11.0044[/C][C]0[/C][/ROW]
[ROW][C]5[/C][C]0.89253[/C][C]10.7475[/C][C]0[/C][/ROW]
[ROW][C]6[/C][C]0.872822[/C][C]10.5102[/C][C]0[/C][/ROW]
[ROW][C]7[/C][C]0.851637[/C][C]10.2551[/C][C]0[/C][/ROW]
[ROW][C]8[/C][C]0.831433[/C][C]10.0118[/C][C]0[/C][/ROW]
[ROW][C]9[/C][C]0.812907[/C][C]9.7887[/C][C]0[/C][/ROW]
[ROW][C]10[/C][C]0.792711[/C][C]9.5455[/C][C]0[/C][/ROW]
[ROW][C]11[/C][C]0.773895[/C][C]9.3189[/C][C]0[/C][/ROW]
[ROW][C]12[/C][C]0.756269[/C][C]9.1067[/C][C]0[/C][/ROW]
[ROW][C]13[/C][C]0.736808[/C][C]8.8723[/C][C]0[/C][/ROW]
[ROW][C]14[/C][C]0.718513[/C][C]8.652[/C][C]0[/C][/ROW]
[ROW][C]15[/C][C]0.703319[/C][C]8.4691[/C][C]0[/C][/ROW]
[ROW][C]16[/C][C]0.68681[/C][C]8.2703[/C][C]0[/C][/ROW]
[ROW][C]17[/C][C]0.668775[/C][C]8.0531[/C][C]0[/C][/ROW]
[ROW][C]18[/C][C]0.651366[/C][C]7.8435[/C][C]0[/C][/ROW]
[ROW][C]19[/C][C]0.632817[/C][C]7.6201[/C][C]0[/C][/ROW]
[ROW][C]20[/C][C]0.614054[/C][C]7.3942[/C][C]0[/C][/ROW]
[ROW][C]21[/C][C]0.597301[/C][C]7.1925[/C][C]0[/C][/ROW]
[/TABLE]
Source: https://freestatistics.org/blog/index.php?pk=67168&T=1

Globally Unique Identifier (entire table): ba.freestatistics.org/blog/index.php?pk=67168&T=1

As an alternative you can also use a QR Code:  

The GUIDs for individual cells are displayed in the table below:

Autocorrelation Function
Time lag kACF(k)T-STATP-value
10.97690711.76350
20.95500911.49980
30.9353211.26270
40.91386411.00440
50.8925310.74750
60.87282210.51020
70.85163710.25510
80.83143310.01180
90.8129079.78870
100.7927119.54550
110.7738959.31890
120.7562699.10670
130.7368088.87230
140.7185138.6520
150.7033198.46910
160.686818.27030
170.6687758.05310
180.6513667.84350
190.6328177.62010
200.6140547.39420
210.5973017.19250


Partial Autocorrelation Function
Time lag kPACF(k)T-STATP-value
10.97690711.76350
20.0144770.17430.430928
30.0378740.45610.324511
4-0.046471-0.55960.288312
5-0.008098-0.09750.461225
60.021070.25370.400038
7-0.039735-0.47850.316515
80.0116540.14030.444295
90.021730.26170.396978
10-0.041103-0.49490.310693
110.0203030.24450.4036
120.0096430.11610.453862
13-0.042193-0.50810.306087
140.0140810.16960.432797
150.0506030.60930.271625
16-0.025762-0.31020.378419
17-0.041071-0.49460.310828
18-0.008729-0.10510.458214
19-0.029503-0.35530.361455
20-0.013591-0.16370.435115
210.0241660.2910.385734

\begin{tabular}{lllllllll}
\hline
Partial Autocorrelation Function \tabularnewline
Time lag k & PACF(k) & T-STAT & P-value \tabularnewline
1 & 0.976907 & 11.7635 & 0 \tabularnewline
2 & 0.014477 & 0.1743 & 0.430928 \tabularnewline
3 & 0.037874 & 0.4561 & 0.324511 \tabularnewline
4 & -0.046471 & -0.5596 & 0.288312 \tabularnewline
5 & -0.008098 & -0.0975 & 0.461225 \tabularnewline
6 & 0.02107 & 0.2537 & 0.400038 \tabularnewline
7 & -0.039735 & -0.4785 & 0.316515 \tabularnewline
8 & 0.011654 & 0.1403 & 0.444295 \tabularnewline
9 & 0.02173 & 0.2617 & 0.396978 \tabularnewline
10 & -0.041103 & -0.4949 & 0.310693 \tabularnewline
11 & 0.020303 & 0.2445 & 0.4036 \tabularnewline
12 & 0.009643 & 0.1161 & 0.453862 \tabularnewline
13 & -0.042193 & -0.5081 & 0.306087 \tabularnewline
14 & 0.014081 & 0.1696 & 0.432797 \tabularnewline
15 & 0.050603 & 0.6093 & 0.271625 \tabularnewline
16 & -0.025762 & -0.3102 & 0.378419 \tabularnewline
17 & -0.041071 & -0.4946 & 0.310828 \tabularnewline
18 & -0.008729 & -0.1051 & 0.458214 \tabularnewline
19 & -0.029503 & -0.3553 & 0.361455 \tabularnewline
20 & -0.013591 & -0.1637 & 0.435115 \tabularnewline
21 & 0.024166 & 0.291 & 0.385734 \tabularnewline
\hline
\end{tabular}
%Source: https://freestatistics.org/blog/index.php?pk=67168&T=2

[TABLE]
[ROW][C]Partial Autocorrelation Function[/C][/ROW]
[ROW][C]Time lag k[/C][C]PACF(k)[/C][C]T-STAT[/C][C]P-value[/C][/ROW]
[ROW][C]1[/C][C]0.976907[/C][C]11.7635[/C][C]0[/C][/ROW]
[ROW][C]2[/C][C]0.014477[/C][C]0.1743[/C][C]0.430928[/C][/ROW]
[ROW][C]3[/C][C]0.037874[/C][C]0.4561[/C][C]0.324511[/C][/ROW]
[ROW][C]4[/C][C]-0.046471[/C][C]-0.5596[/C][C]0.288312[/C][/ROW]
[ROW][C]5[/C][C]-0.008098[/C][C]-0.0975[/C][C]0.461225[/C][/ROW]
[ROW][C]6[/C][C]0.02107[/C][C]0.2537[/C][C]0.400038[/C][/ROW]
[ROW][C]7[/C][C]-0.039735[/C][C]-0.4785[/C][C]0.316515[/C][/ROW]
[ROW][C]8[/C][C]0.011654[/C][C]0.1403[/C][C]0.444295[/C][/ROW]
[ROW][C]9[/C][C]0.02173[/C][C]0.2617[/C][C]0.396978[/C][/ROW]
[ROW][C]10[/C][C]-0.041103[/C][C]-0.4949[/C][C]0.310693[/C][/ROW]
[ROW][C]11[/C][C]0.020303[/C][C]0.2445[/C][C]0.4036[/C][/ROW]
[ROW][C]12[/C][C]0.009643[/C][C]0.1161[/C][C]0.453862[/C][/ROW]
[ROW][C]13[/C][C]-0.042193[/C][C]-0.5081[/C][C]0.306087[/C][/ROW]
[ROW][C]14[/C][C]0.014081[/C][C]0.1696[/C][C]0.432797[/C][/ROW]
[ROW][C]15[/C][C]0.050603[/C][C]0.6093[/C][C]0.271625[/C][/ROW]
[ROW][C]16[/C][C]-0.025762[/C][C]-0.3102[/C][C]0.378419[/C][/ROW]
[ROW][C]17[/C][C]-0.041071[/C][C]-0.4946[/C][C]0.310828[/C][/ROW]
[ROW][C]18[/C][C]-0.008729[/C][C]-0.1051[/C][C]0.458214[/C][/ROW]
[ROW][C]19[/C][C]-0.029503[/C][C]-0.3553[/C][C]0.361455[/C][/ROW]
[ROW][C]20[/C][C]-0.013591[/C][C]-0.1637[/C][C]0.435115[/C][/ROW]
[ROW][C]21[/C][C]0.024166[/C][C]0.291[/C][C]0.385734[/C][/ROW]
[/TABLE]
Source: https://freestatistics.org/blog/index.php?pk=67168&T=2

Globally Unique Identifier (entire table): ba.freestatistics.org/blog/index.php?pk=67168&T=2

As an alternative you can also use a QR Code:  

The GUIDs for individual cells are displayed in the table below:

Partial Autocorrelation Function
Time lag kPACF(k)T-STATP-value
10.97690711.76350
20.0144770.17430.430928
30.0378740.45610.324511
4-0.046471-0.55960.288312
5-0.008098-0.09750.461225
60.021070.25370.400038
7-0.039735-0.47850.316515
80.0116540.14030.444295
90.021730.26170.396978
10-0.041103-0.49490.310693
110.0203030.24450.4036
120.0096430.11610.453862
13-0.042193-0.50810.306087
140.0140810.16960.432797
150.0506030.60930.271625
16-0.025762-0.31020.378419
17-0.041071-0.49460.310828
18-0.008729-0.10510.458214
19-0.029503-0.35530.361455
20-0.013591-0.16370.435115
210.0241660.2910.385734


Parameters (Session):
par1 = Default ; par2 = 1 ; par3 = 0 ; par4 = 0 ; par5 = 12 ; par6 = White Noise ; par7 = 0.95 ;
Parameters (R input):
par1 = Default ; par2 = 1 ; par3 = 0 ; par4 = 0 ; par5 = 12 ; par6 = White Noise ; par7 = 0.95 ;
R code (references can be found in the software module):
if (par1 == 'Default') {
par1 = 10*log10(length(x))
} else {
par1 <- as.numeric(par1)
}
par2 <- as.numeric(par2)
par3 <- as.numeric(par3)
par4 <- as.numeric(par4)
par5 <- as.numeric(par5)
if (par6 == 'White Noise') par6 <- 'white' else par6 <- 'ma'
par7 <- as.numeric(par7)
if (par2 == 0) {
x <- log(x)
} else {
x <- (x ^ par2 - 1) / par2
}
if (par3 > 0) x <- diff(x,lag=1,difference=par3)
if (par4 > 0) x <- diff(x,lag=par5,difference=par4)
bitmap(file='pic1.png')
racf <- acf(x, par1, main='Autocorrelation', xlab='time lag', ylab='ACF', ci.type=par6, ci=par7, sub=paste('(lambda=',par2,', d=',par3,', D=',par4,', CI=', par7, ', CI type=',par6,')',sep=''))
dev.off()
bitmap(file='pic2.png')
rpacf <- pacf(x,par1,main='Partial Autocorrelation',xlab='lags',ylab='PACF')
dev.off()
(myacf <- c(racf$acf))
(mypacf <- c(rpacf$acf))
lengthx <- length(x)
sqrtn <- sqrt(lengthx)
load(file='createtable')
a<-table.start()
a<-table.row.start(a)
a<-table.element(a,'Autocorrelation Function',4,TRUE)
a<-table.row.end(a)
a<-table.row.start(a)
a<-table.element(a,'Time lag k',header=TRUE)
a<-table.element(a,hyperlink('basics.htm','ACF(k)','click here for more information about the Autocorrelation Function'),header=TRUE)
a<-table.element(a,'T-STAT',header=TRUE)
a<-table.element(a,'P-value',header=TRUE)
a<-table.row.end(a)
for (i in 2:(par1+1)) {
a<-table.row.start(a)
a<-table.element(a,i-1,header=TRUE)
a<-table.element(a,round(myacf[i],6))
mytstat <- myacf[i]*sqrtn
a<-table.element(a,round(mytstat,4))
a<-table.element(a,round(1-pt(abs(mytstat),lengthx),6))
a<-table.row.end(a)
}
a<-table.end(a)
table.save(a,file='mytable.tab')
a<-table.start()
a<-table.row.start(a)
a<-table.element(a,'Partial Autocorrelation Function',4,TRUE)
a<-table.row.end(a)
a<-table.row.start(a)
a<-table.element(a,'Time lag k',header=TRUE)
a<-table.element(a,hyperlink('basics.htm','PACF(k)','click here for more information about the Partial Autocorrelation Function'),header=TRUE)
a<-table.element(a,'T-STAT',header=TRUE)
a<-table.element(a,'P-value',header=TRUE)
a<-table.row.end(a)
for (i in 1:par1) {
a<-table.row.start(a)
a<-table.element(a,i,header=TRUE)
a<-table.element(a,round(mypacf[i],6))
mytstat <- mypacf[i]*sqrtn
a<-table.element(a,round(mytstat,4))
a<-table.element(a,round(1-pt(abs(mytstat),lengthx),6))
a<-table.row.end(a)
}
a<-table.end(a)
table.save(a,file='mytable1.tab')