Free Statistics

of Irreproducible Research!

Author's title

Author*Unverified author*
R Software Modulerwasp_autocorrelation.wasp
Title produced by software(Partial) Autocorrelation Function
Date of computationSun, 13 Dec 2009 03:04:21 -0700
Cite this page as followsStatistical Computations at FreeStatistics.org, Office for Research Development and Education, URL https://freestatistics.org/blog/index.php?v=date/2009/Dec/13/t1260698699xagfcifae5q8x48.htm/, Retrieved Sun, 28 Apr 2024 18:10:19 +0000
Statistical Computations at FreeStatistics.org, Office for Research Development and Education, URL https://freestatistics.org/blog/index.php?pk=67184, Retrieved Sun, 28 Apr 2024 18:10:19 +0000
QR Codes:

Original text written by user:
IsPrivate?No (this computation is public)
User-defined keywordsKDGP2W21
Estimated Impact152
Family? (F = Feedback message, R = changed R code, M = changed R Module, P = changed Parameters, D = changed Data)
-     [Central Tendency] [] [2009-10-27 11:47:31] [e5e09c53da17fb7444fa9ceb236a5291]
- RMP   [Mean Plot] [] [2009-12-02 08:56:02] [e5e09c53da17fb7444fa9ceb236a5291]
- RMPD      [(Partial) Autocorrelation Function] [] [2009-12-13 10:04:21] [ab2b68d5442f7c9b7e2e9d790849a234] [Current]
Feedback Forum

Post a new message
Dataseries X:
2.14
2.45
2.52
2.3
2.2541086
39690
43129
37863
35953
29133
24693
22205
21725
27192
21790
13253
37702
30364
32609
30212
29965
28352
25814
22414
20506
28806
22228
13971
36845
35338
35022
34777
26887
23970
22780
17351
21382
24561
17409
11514
31514
27071
29462
26105
22397
23843
21705
18089
20764
25316
17704
15548
28029
29383
36438
32034
22679
24319
18004
17537
20366
22782
19169
13807
29743
25591
29096
26482
22405
27044
17970
18730
19684
19785
18479
10698

2.06
1.99
2.25
2.26
2.36
2.3
2.19
2.31
2.21
2.21
2.26
2.18
2.21
2.33
2.12
2.08
1.97
2.09
2.11
2.24
2.45
2.68
2.73
2.76
2.83
3.16
3.22
3.22
3.34
3.35
3.42
3.58
3.71
3.68
3.83
3.94
3.88
4.03
4.15
4.32
4.4
4.37
4.14
4.11
4.16
3.98
4.13
3.76
3.66
3.85
4.03
4.31
4.58
4.46
4.41
3.84
2.84
2.66
2.17
1.43
1.47
1.29
1.23
1.09
0.94
0.76
0.67


Summary of computational transaction
Raw Inputview raw input (R code)
Raw Outputview raw output of R engine
Computing time1 seconds
R Server'Gwilym Jenkins' @ 72.249.127.135
R Framework error message
Warning: there are blank lines in the 'Data' field.
Please, use NA for missing data - blank lines are simply
 deleted and are NOT treated as missing values.

\begin{tabular}{lllllllll}
\hline
Summary of computational transaction \tabularnewline
Raw Input & view raw input (R code)  \tabularnewline
Raw Output & view raw output of R engine  \tabularnewline
Computing time & 1 seconds \tabularnewline
R Server & 'Gwilym Jenkins' @ 72.249.127.135 \tabularnewline
R Framework error message & 
Warning: there are blank lines in the 'Data' field.
Please, use NA for missing data - blank lines are simply
 deleted and are NOT treated as missing values.
\tabularnewline \hline \end{tabular} %Source: https://freestatistics.org/blog/index.php?pk=67184&T=0

[TABLE]
[ROW][C]Summary of computational transaction[/C][/ROW]
[ROW][C]Raw Input[/C][C]view raw input (R code) [/C][/ROW]
[ROW][C]Raw Output[/C][C]view raw output of R engine [/C][/ROW]
[ROW][C]Computing time[/C][C]1 seconds[/C][/ROW]
[ROW][C]R Server[/C][C]'Gwilym Jenkins' @ 72.249.127.135[/C][/ROW]
[ROW][C]R Framework error message[/C][C]
Warning: there are blank lines in the 'Data' field.
Please, use NA for missing data - blank lines are simply
 deleted and are NOT treated as missing values.
[/C][/ROW] [/TABLE] Source: https://freestatistics.org/blog/index.php?pk=67184&T=0

Globally Unique Identifier (entire table): ba.freestatistics.org/blog/index.php?pk=67184&T=0

As an alternative you can also use a QR Code:  

The GUIDs for individual cells are displayed in the table below:

Summary of computational transaction
Raw Inputview raw input (R code)
Raw Outputview raw output of R engine
Computing time1 seconds
R Server'Gwilym Jenkins' @ 72.249.127.135
R Framework error message
Warning: there are blank lines in the 'Data' field.
Please, use NA for missing data - blank lines are simply
 deleted and are NOT treated as missing values.


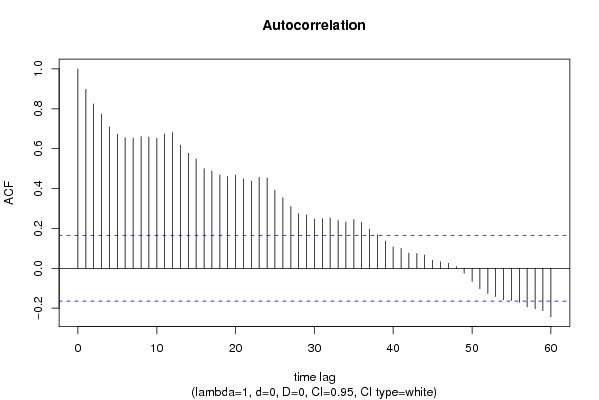
Autocorrelation Function
Time lag kACF(k)T-STATP-value
10.89767510.73460
20.8243199.85740
30.7742939.25920
40.7090898.47950
50.6719218.0350
60.6559487.8440
70.6535647.81550
80.6602627.89560
90.6592187.88310
100.6519797.79650
110.6733548.05210
120.68138.14720
130.6185377.39660
140.5775476.90650
150.548496.5590
160.4997475.97610
170.4881675.83760
180.4683555.60070
190.4600055.50090
200.4677095.5930
210.4484255.36240
220.4368895.22440
230.4570075.4650
240.453575.42390
250.392184.68983e-06
260.3540224.23352e-05
270.3101123.70840.000149
280.2739783.27630.00066
290.2677433.20170.000842
300.2472872.95710.001817
310.2488392.97570.001717
320.2530833.02640.001468
330.2395192.86420.002405
340.2326932.78260.00306
350.2450892.93080.001968
360.2316432.770.003175
370.1965382.35030.010064
380.168752.0180.022733
390.1366841.63450.052177
400.1071761.28160.101021
410.0999691.19550.116944
420.076240.91170.181732
430.0748580.89520.1861
440.0666960.79760.213222
450.0401160.47970.316079
460.0326290.39020.348492
470.0254580.30440.380622
480.0091290.10920.45661
49-0.024818-0.29680.383531
50-0.065638-0.78490.216902
51-0.102155-1.22160.111935
52-0.12644-1.5120.06637
53-0.141657-1.6940.046224
54-0.157953-1.88880.030469
55-0.16092-1.92430.02815
56-0.170493-2.03880.021656
57-0.192714-2.30450.011317
58-0.203189-2.42980.008174
59-0.212262-2.53830.006105
60-0.242339-2.8980.002174

\begin{tabular}{lllllllll}
\hline
Autocorrelation Function \tabularnewline
Time lag k & ACF(k) & T-STAT & P-value \tabularnewline
1 & 0.897675 & 10.7346 & 0 \tabularnewline
2 & 0.824319 & 9.8574 & 0 \tabularnewline
3 & 0.774293 & 9.2592 & 0 \tabularnewline
4 & 0.709089 & 8.4795 & 0 \tabularnewline
5 & 0.671921 & 8.035 & 0 \tabularnewline
6 & 0.655948 & 7.844 & 0 \tabularnewline
7 & 0.653564 & 7.8155 & 0 \tabularnewline
8 & 0.660262 & 7.8956 & 0 \tabularnewline
9 & 0.659218 & 7.8831 & 0 \tabularnewline
10 & 0.651979 & 7.7965 & 0 \tabularnewline
11 & 0.673354 & 8.0521 & 0 \tabularnewline
12 & 0.6813 & 8.1472 & 0 \tabularnewline
13 & 0.618537 & 7.3966 & 0 \tabularnewline
14 & 0.577547 & 6.9065 & 0 \tabularnewline
15 & 0.54849 & 6.559 & 0 \tabularnewline
16 & 0.499747 & 5.9761 & 0 \tabularnewline
17 & 0.488167 & 5.8376 & 0 \tabularnewline
18 & 0.468355 & 5.6007 & 0 \tabularnewline
19 & 0.460005 & 5.5009 & 0 \tabularnewline
20 & 0.467709 & 5.593 & 0 \tabularnewline
21 & 0.448425 & 5.3624 & 0 \tabularnewline
22 & 0.436889 & 5.2244 & 0 \tabularnewline
23 & 0.457007 & 5.465 & 0 \tabularnewline
24 & 0.45357 & 5.4239 & 0 \tabularnewline
25 & 0.39218 & 4.6898 & 3e-06 \tabularnewline
26 & 0.354022 & 4.2335 & 2e-05 \tabularnewline
27 & 0.310112 & 3.7084 & 0.000149 \tabularnewline
28 & 0.273978 & 3.2763 & 0.00066 \tabularnewline
29 & 0.267743 & 3.2017 & 0.000842 \tabularnewline
30 & 0.247287 & 2.9571 & 0.001817 \tabularnewline
31 & 0.248839 & 2.9757 & 0.001717 \tabularnewline
32 & 0.253083 & 3.0264 & 0.001468 \tabularnewline
33 & 0.239519 & 2.8642 & 0.002405 \tabularnewline
34 & 0.232693 & 2.7826 & 0.00306 \tabularnewline
35 & 0.245089 & 2.9308 & 0.001968 \tabularnewline
36 & 0.231643 & 2.77 & 0.003175 \tabularnewline
37 & 0.196538 & 2.3503 & 0.010064 \tabularnewline
38 & 0.16875 & 2.018 & 0.022733 \tabularnewline
39 & 0.136684 & 1.6345 & 0.052177 \tabularnewline
40 & 0.107176 & 1.2816 & 0.101021 \tabularnewline
41 & 0.099969 & 1.1955 & 0.116944 \tabularnewline
42 & 0.07624 & 0.9117 & 0.181732 \tabularnewline
43 & 0.074858 & 0.8952 & 0.1861 \tabularnewline
44 & 0.066696 & 0.7976 & 0.213222 \tabularnewline
45 & 0.040116 & 0.4797 & 0.316079 \tabularnewline
46 & 0.032629 & 0.3902 & 0.348492 \tabularnewline
47 & 0.025458 & 0.3044 & 0.380622 \tabularnewline
48 & 0.009129 & 0.1092 & 0.45661 \tabularnewline
49 & -0.024818 & -0.2968 & 0.383531 \tabularnewline
50 & -0.065638 & -0.7849 & 0.216902 \tabularnewline
51 & -0.102155 & -1.2216 & 0.111935 \tabularnewline
52 & -0.12644 & -1.512 & 0.06637 \tabularnewline
53 & -0.141657 & -1.694 & 0.046224 \tabularnewline
54 & -0.157953 & -1.8888 & 0.030469 \tabularnewline
55 & -0.16092 & -1.9243 & 0.02815 \tabularnewline
56 & -0.170493 & -2.0388 & 0.021656 \tabularnewline
57 & -0.192714 & -2.3045 & 0.011317 \tabularnewline
58 & -0.203189 & -2.4298 & 0.008174 \tabularnewline
59 & -0.212262 & -2.5383 & 0.006105 \tabularnewline
60 & -0.242339 & -2.898 & 0.002174 \tabularnewline
\hline
\end{tabular}
%Source: https://freestatistics.org/blog/index.php?pk=67184&T=1

[TABLE]
[ROW][C]Autocorrelation Function[/C][/ROW]
[ROW][C]Time lag k[/C][C]ACF(k)[/C][C]T-STAT[/C][C]P-value[/C][/ROW]
[ROW][C]1[/C][C]0.897675[/C][C]10.7346[/C][C]0[/C][/ROW]
[ROW][C]2[/C][C]0.824319[/C][C]9.8574[/C][C]0[/C][/ROW]
[ROW][C]3[/C][C]0.774293[/C][C]9.2592[/C][C]0[/C][/ROW]
[ROW][C]4[/C][C]0.709089[/C][C]8.4795[/C][C]0[/C][/ROW]
[ROW][C]5[/C][C]0.671921[/C][C]8.035[/C][C]0[/C][/ROW]
[ROW][C]6[/C][C]0.655948[/C][C]7.844[/C][C]0[/C][/ROW]
[ROW][C]7[/C][C]0.653564[/C][C]7.8155[/C][C]0[/C][/ROW]
[ROW][C]8[/C][C]0.660262[/C][C]7.8956[/C][C]0[/C][/ROW]
[ROW][C]9[/C][C]0.659218[/C][C]7.8831[/C][C]0[/C][/ROW]
[ROW][C]10[/C][C]0.651979[/C][C]7.7965[/C][C]0[/C][/ROW]
[ROW][C]11[/C][C]0.673354[/C][C]8.0521[/C][C]0[/C][/ROW]
[ROW][C]12[/C][C]0.6813[/C][C]8.1472[/C][C]0[/C][/ROW]
[ROW][C]13[/C][C]0.618537[/C][C]7.3966[/C][C]0[/C][/ROW]
[ROW][C]14[/C][C]0.577547[/C][C]6.9065[/C][C]0[/C][/ROW]
[ROW][C]15[/C][C]0.54849[/C][C]6.559[/C][C]0[/C][/ROW]
[ROW][C]16[/C][C]0.499747[/C][C]5.9761[/C][C]0[/C][/ROW]
[ROW][C]17[/C][C]0.488167[/C][C]5.8376[/C][C]0[/C][/ROW]
[ROW][C]18[/C][C]0.468355[/C][C]5.6007[/C][C]0[/C][/ROW]
[ROW][C]19[/C][C]0.460005[/C][C]5.5009[/C][C]0[/C][/ROW]
[ROW][C]20[/C][C]0.467709[/C][C]5.593[/C][C]0[/C][/ROW]
[ROW][C]21[/C][C]0.448425[/C][C]5.3624[/C][C]0[/C][/ROW]
[ROW][C]22[/C][C]0.436889[/C][C]5.2244[/C][C]0[/C][/ROW]
[ROW][C]23[/C][C]0.457007[/C][C]5.465[/C][C]0[/C][/ROW]
[ROW][C]24[/C][C]0.45357[/C][C]5.4239[/C][C]0[/C][/ROW]
[ROW][C]25[/C][C]0.39218[/C][C]4.6898[/C][C]3e-06[/C][/ROW]
[ROW][C]26[/C][C]0.354022[/C][C]4.2335[/C][C]2e-05[/C][/ROW]
[ROW][C]27[/C][C]0.310112[/C][C]3.7084[/C][C]0.000149[/C][/ROW]
[ROW][C]28[/C][C]0.273978[/C][C]3.2763[/C][C]0.00066[/C][/ROW]
[ROW][C]29[/C][C]0.267743[/C][C]3.2017[/C][C]0.000842[/C][/ROW]
[ROW][C]30[/C][C]0.247287[/C][C]2.9571[/C][C]0.001817[/C][/ROW]
[ROW][C]31[/C][C]0.248839[/C][C]2.9757[/C][C]0.001717[/C][/ROW]
[ROW][C]32[/C][C]0.253083[/C][C]3.0264[/C][C]0.001468[/C][/ROW]
[ROW][C]33[/C][C]0.239519[/C][C]2.8642[/C][C]0.002405[/C][/ROW]
[ROW][C]34[/C][C]0.232693[/C][C]2.7826[/C][C]0.00306[/C][/ROW]
[ROW][C]35[/C][C]0.245089[/C][C]2.9308[/C][C]0.001968[/C][/ROW]
[ROW][C]36[/C][C]0.231643[/C][C]2.77[/C][C]0.003175[/C][/ROW]
[ROW][C]37[/C][C]0.196538[/C][C]2.3503[/C][C]0.010064[/C][/ROW]
[ROW][C]38[/C][C]0.16875[/C][C]2.018[/C][C]0.022733[/C][/ROW]
[ROW][C]39[/C][C]0.136684[/C][C]1.6345[/C][C]0.052177[/C][/ROW]
[ROW][C]40[/C][C]0.107176[/C][C]1.2816[/C][C]0.101021[/C][/ROW]
[ROW][C]41[/C][C]0.099969[/C][C]1.1955[/C][C]0.116944[/C][/ROW]
[ROW][C]42[/C][C]0.07624[/C][C]0.9117[/C][C]0.181732[/C][/ROW]
[ROW][C]43[/C][C]0.074858[/C][C]0.8952[/C][C]0.1861[/C][/ROW]
[ROW][C]44[/C][C]0.066696[/C][C]0.7976[/C][C]0.213222[/C][/ROW]
[ROW][C]45[/C][C]0.040116[/C][C]0.4797[/C][C]0.316079[/C][/ROW]
[ROW][C]46[/C][C]0.032629[/C][C]0.3902[/C][C]0.348492[/C][/ROW]
[ROW][C]47[/C][C]0.025458[/C][C]0.3044[/C][C]0.380622[/C][/ROW]
[ROW][C]48[/C][C]0.009129[/C][C]0.1092[/C][C]0.45661[/C][/ROW]
[ROW][C]49[/C][C]-0.024818[/C][C]-0.2968[/C][C]0.383531[/C][/ROW]
[ROW][C]50[/C][C]-0.065638[/C][C]-0.7849[/C][C]0.216902[/C][/ROW]
[ROW][C]51[/C][C]-0.102155[/C][C]-1.2216[/C][C]0.111935[/C][/ROW]
[ROW][C]52[/C][C]-0.12644[/C][C]-1.512[/C][C]0.06637[/C][/ROW]
[ROW][C]53[/C][C]-0.141657[/C][C]-1.694[/C][C]0.046224[/C][/ROW]
[ROW][C]54[/C][C]-0.157953[/C][C]-1.8888[/C][C]0.030469[/C][/ROW]
[ROW][C]55[/C][C]-0.16092[/C][C]-1.9243[/C][C]0.02815[/C][/ROW]
[ROW][C]56[/C][C]-0.170493[/C][C]-2.0388[/C][C]0.021656[/C][/ROW]
[ROW][C]57[/C][C]-0.192714[/C][C]-2.3045[/C][C]0.011317[/C][/ROW]
[ROW][C]58[/C][C]-0.203189[/C][C]-2.4298[/C][C]0.008174[/C][/ROW]
[ROW][C]59[/C][C]-0.212262[/C][C]-2.5383[/C][C]0.006105[/C][/ROW]
[ROW][C]60[/C][C]-0.242339[/C][C]-2.898[/C][C]0.002174[/C][/ROW]
[/TABLE]
Source: https://freestatistics.org/blog/index.php?pk=67184&T=1

Globally Unique Identifier (entire table): ba.freestatistics.org/blog/index.php?pk=67184&T=1

As an alternative you can also use a QR Code:  

The GUIDs for individual cells are displayed in the table below:

Autocorrelation Function
Time lag kACF(k)T-STATP-value
10.89767510.73460
20.8243199.85740
30.7742939.25920
40.7090898.47950
50.6719218.0350
60.6559487.8440
70.6535647.81550
80.6602627.89560
90.6592187.88310
100.6519797.79650
110.6733548.05210
120.68138.14720
130.6185377.39660
140.5775476.90650
150.548496.5590
160.4997475.97610
170.4881675.83760
180.4683555.60070
190.4600055.50090
200.4677095.5930
210.4484255.36240
220.4368895.22440
230.4570075.4650
240.453575.42390
250.392184.68983e-06
260.3540224.23352e-05
270.3101123.70840.000149
280.2739783.27630.00066
290.2677433.20170.000842
300.2472872.95710.001817
310.2488392.97570.001717
320.2530833.02640.001468
330.2395192.86420.002405
340.2326932.78260.00306
350.2450892.93080.001968
360.2316432.770.003175
370.1965382.35030.010064
380.168752.0180.022733
390.1366841.63450.052177
400.1071761.28160.101021
410.0999691.19550.116944
420.076240.91170.181732
430.0748580.89520.1861
440.0666960.79760.213222
450.0401160.47970.316079
460.0326290.39020.348492
470.0254580.30440.380622
480.0091290.10920.45661
49-0.024818-0.29680.383531
50-0.065638-0.78490.216902
51-0.102155-1.22160.111935
52-0.12644-1.5120.06637
53-0.141657-1.6940.046224
54-0.157953-1.88880.030469
55-0.16092-1.92430.02815
56-0.170493-2.03880.021656
57-0.192714-2.30450.011317
58-0.203189-2.42980.008174
59-0.212262-2.53830.006105
60-0.242339-2.8980.002174


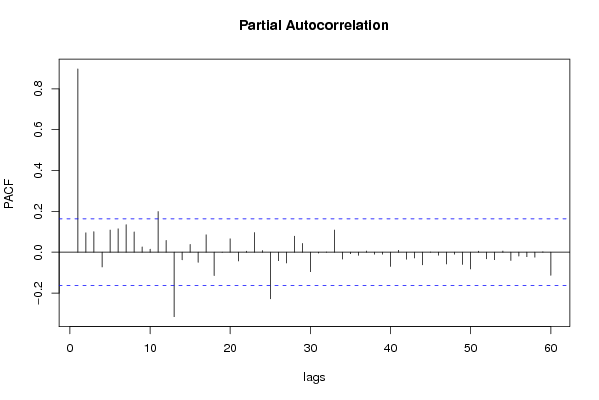
Partial Autocorrelation Function
Time lag kPACF(k)T-STATP-value
10.89767510.73460
20.0952681.13920.128254
30.1002951.19940.116187
4-0.072331-0.8650.194257
50.1086821.29970.097906
60.1146241.37070.086307
70.1349581.61390.05438
80.0991761.1860.1188
90.0259960.31090.378177
100.0146760.17550.430467
110.1989062.37860.009351
120.0575920.68870.246064
13-0.31564-3.77450.000117
14-0.037095-0.44360.329003
150.0381780.45650.324348
16-0.049505-0.5920.277396
170.0851651.01840.155098
18-0.114565-1.370.086417
19-0.000408-0.00490.498056
200.0657370.78610.216556
21-0.042744-0.51110.30502
220.0050520.06040.475955
230.0960281.14830.126376
240.0081450.09740.461274
25-0.228351-2.73070.003558
26-0.04144-0.49560.310486
27-0.052648-0.62960.264986
280.0786260.94020.174343
290.0432090.51670.303082
30-0.095138-1.13770.128578
31-0.004442-0.05310.478856
320.0010190.01220.495148
330.108261.29460.098772
34-0.03348-0.40040.344742
35-0.007017-0.08390.466624
36-0.015382-0.18390.427158
370.0058160.06960.472323
38-0.009903-0.11840.452948
39-0.009433-0.11280.455172
40-0.069576-0.8320.203394
410.009470.11320.454996
42-0.033979-0.40630.342555
43-0.028097-0.3360.368684
44-0.061675-0.73750.231004
450.0009360.01120.495543
46-0.014362-0.17170.43194
47-0.057193-0.68390.247564
48-0.009763-0.11670.453613
49-0.060048-0.71810.236943
50-0.081733-0.97740.165014
510.0050390.06030.476015
52-0.032245-0.38560.350184
53-0.036868-0.44090.329985
540.0053330.06380.474619
55-0.040483-0.48410.314526
56-0.018855-0.22550.410967
57-0.021864-0.26150.397057
58-0.02427-0.29020.386032
590.0016740.020.49203
60-0.113328-1.35520.088745

\begin{tabular}{lllllllll}
\hline
Partial Autocorrelation Function \tabularnewline
Time lag k & PACF(k) & T-STAT & P-value \tabularnewline
1 & 0.897675 & 10.7346 & 0 \tabularnewline
2 & 0.095268 & 1.1392 & 0.128254 \tabularnewline
3 & 0.100295 & 1.1994 & 0.116187 \tabularnewline
4 & -0.072331 & -0.865 & 0.194257 \tabularnewline
5 & 0.108682 & 1.2997 & 0.097906 \tabularnewline
6 & 0.114624 & 1.3707 & 0.086307 \tabularnewline
7 & 0.134958 & 1.6139 & 0.05438 \tabularnewline
8 & 0.099176 & 1.186 & 0.1188 \tabularnewline
9 & 0.025996 & 0.3109 & 0.378177 \tabularnewline
10 & 0.014676 & 0.1755 & 0.430467 \tabularnewline
11 & 0.198906 & 2.3786 & 0.009351 \tabularnewline
12 & 0.057592 & 0.6887 & 0.246064 \tabularnewline
13 & -0.31564 & -3.7745 & 0.000117 \tabularnewline
14 & -0.037095 & -0.4436 & 0.329003 \tabularnewline
15 & 0.038178 & 0.4565 & 0.324348 \tabularnewline
16 & -0.049505 & -0.592 & 0.277396 \tabularnewline
17 & 0.085165 & 1.0184 & 0.155098 \tabularnewline
18 & -0.114565 & -1.37 & 0.086417 \tabularnewline
19 & -0.000408 & -0.0049 & 0.498056 \tabularnewline
20 & 0.065737 & 0.7861 & 0.216556 \tabularnewline
21 & -0.042744 & -0.5111 & 0.30502 \tabularnewline
22 & 0.005052 & 0.0604 & 0.475955 \tabularnewline
23 & 0.096028 & 1.1483 & 0.126376 \tabularnewline
24 & 0.008145 & 0.0974 & 0.461274 \tabularnewline
25 & -0.228351 & -2.7307 & 0.003558 \tabularnewline
26 & -0.04144 & -0.4956 & 0.310486 \tabularnewline
27 & -0.052648 & -0.6296 & 0.264986 \tabularnewline
28 & 0.078626 & 0.9402 & 0.174343 \tabularnewline
29 & 0.043209 & 0.5167 & 0.303082 \tabularnewline
30 & -0.095138 & -1.1377 & 0.128578 \tabularnewline
31 & -0.004442 & -0.0531 & 0.478856 \tabularnewline
32 & 0.001019 & 0.0122 & 0.495148 \tabularnewline
33 & 0.10826 & 1.2946 & 0.098772 \tabularnewline
34 & -0.03348 & -0.4004 & 0.344742 \tabularnewline
35 & -0.007017 & -0.0839 & 0.466624 \tabularnewline
36 & -0.015382 & -0.1839 & 0.427158 \tabularnewline
37 & 0.005816 & 0.0696 & 0.472323 \tabularnewline
38 & -0.009903 & -0.1184 & 0.452948 \tabularnewline
39 & -0.009433 & -0.1128 & 0.455172 \tabularnewline
40 & -0.069576 & -0.832 & 0.203394 \tabularnewline
41 & 0.00947 & 0.1132 & 0.454996 \tabularnewline
42 & -0.033979 & -0.4063 & 0.342555 \tabularnewline
43 & -0.028097 & -0.336 & 0.368684 \tabularnewline
44 & -0.061675 & -0.7375 & 0.231004 \tabularnewline
45 & 0.000936 & 0.0112 & 0.495543 \tabularnewline
46 & -0.014362 & -0.1717 & 0.43194 \tabularnewline
47 & -0.057193 & -0.6839 & 0.247564 \tabularnewline
48 & -0.009763 & -0.1167 & 0.453613 \tabularnewline
49 & -0.060048 & -0.7181 & 0.236943 \tabularnewline
50 & -0.081733 & -0.9774 & 0.165014 \tabularnewline
51 & 0.005039 & 0.0603 & 0.476015 \tabularnewline
52 & -0.032245 & -0.3856 & 0.350184 \tabularnewline
53 & -0.036868 & -0.4409 & 0.329985 \tabularnewline
54 & 0.005333 & 0.0638 & 0.474619 \tabularnewline
55 & -0.040483 & -0.4841 & 0.314526 \tabularnewline
56 & -0.018855 & -0.2255 & 0.410967 \tabularnewline
57 & -0.021864 & -0.2615 & 0.397057 \tabularnewline
58 & -0.02427 & -0.2902 & 0.386032 \tabularnewline
59 & 0.001674 & 0.02 & 0.49203 \tabularnewline
60 & -0.113328 & -1.3552 & 0.088745 \tabularnewline
\hline
\end{tabular}
%Source: https://freestatistics.org/blog/index.php?pk=67184&T=2

[TABLE]
[ROW][C]Partial Autocorrelation Function[/C][/ROW]
[ROW][C]Time lag k[/C][C]PACF(k)[/C][C]T-STAT[/C][C]P-value[/C][/ROW]
[ROW][C]1[/C][C]0.897675[/C][C]10.7346[/C][C]0[/C][/ROW]
[ROW][C]2[/C][C]0.095268[/C][C]1.1392[/C][C]0.128254[/C][/ROW]
[ROW][C]3[/C][C]0.100295[/C][C]1.1994[/C][C]0.116187[/C][/ROW]
[ROW][C]4[/C][C]-0.072331[/C][C]-0.865[/C][C]0.194257[/C][/ROW]
[ROW][C]5[/C][C]0.108682[/C][C]1.2997[/C][C]0.097906[/C][/ROW]
[ROW][C]6[/C][C]0.114624[/C][C]1.3707[/C][C]0.086307[/C][/ROW]
[ROW][C]7[/C][C]0.134958[/C][C]1.6139[/C][C]0.05438[/C][/ROW]
[ROW][C]8[/C][C]0.099176[/C][C]1.186[/C][C]0.1188[/C][/ROW]
[ROW][C]9[/C][C]0.025996[/C][C]0.3109[/C][C]0.378177[/C][/ROW]
[ROW][C]10[/C][C]0.014676[/C][C]0.1755[/C][C]0.430467[/C][/ROW]
[ROW][C]11[/C][C]0.198906[/C][C]2.3786[/C][C]0.009351[/C][/ROW]
[ROW][C]12[/C][C]0.057592[/C][C]0.6887[/C][C]0.246064[/C][/ROW]
[ROW][C]13[/C][C]-0.31564[/C][C]-3.7745[/C][C]0.000117[/C][/ROW]
[ROW][C]14[/C][C]-0.037095[/C][C]-0.4436[/C][C]0.329003[/C][/ROW]
[ROW][C]15[/C][C]0.038178[/C][C]0.4565[/C][C]0.324348[/C][/ROW]
[ROW][C]16[/C][C]-0.049505[/C][C]-0.592[/C][C]0.277396[/C][/ROW]
[ROW][C]17[/C][C]0.085165[/C][C]1.0184[/C][C]0.155098[/C][/ROW]
[ROW][C]18[/C][C]-0.114565[/C][C]-1.37[/C][C]0.086417[/C][/ROW]
[ROW][C]19[/C][C]-0.000408[/C][C]-0.0049[/C][C]0.498056[/C][/ROW]
[ROW][C]20[/C][C]0.065737[/C][C]0.7861[/C][C]0.216556[/C][/ROW]
[ROW][C]21[/C][C]-0.042744[/C][C]-0.5111[/C][C]0.30502[/C][/ROW]
[ROW][C]22[/C][C]0.005052[/C][C]0.0604[/C][C]0.475955[/C][/ROW]
[ROW][C]23[/C][C]0.096028[/C][C]1.1483[/C][C]0.126376[/C][/ROW]
[ROW][C]24[/C][C]0.008145[/C][C]0.0974[/C][C]0.461274[/C][/ROW]
[ROW][C]25[/C][C]-0.228351[/C][C]-2.7307[/C][C]0.003558[/C][/ROW]
[ROW][C]26[/C][C]-0.04144[/C][C]-0.4956[/C][C]0.310486[/C][/ROW]
[ROW][C]27[/C][C]-0.052648[/C][C]-0.6296[/C][C]0.264986[/C][/ROW]
[ROW][C]28[/C][C]0.078626[/C][C]0.9402[/C][C]0.174343[/C][/ROW]
[ROW][C]29[/C][C]0.043209[/C][C]0.5167[/C][C]0.303082[/C][/ROW]
[ROW][C]30[/C][C]-0.095138[/C][C]-1.1377[/C][C]0.128578[/C][/ROW]
[ROW][C]31[/C][C]-0.004442[/C][C]-0.0531[/C][C]0.478856[/C][/ROW]
[ROW][C]32[/C][C]0.001019[/C][C]0.0122[/C][C]0.495148[/C][/ROW]
[ROW][C]33[/C][C]0.10826[/C][C]1.2946[/C][C]0.098772[/C][/ROW]
[ROW][C]34[/C][C]-0.03348[/C][C]-0.4004[/C][C]0.344742[/C][/ROW]
[ROW][C]35[/C][C]-0.007017[/C][C]-0.0839[/C][C]0.466624[/C][/ROW]
[ROW][C]36[/C][C]-0.015382[/C][C]-0.1839[/C][C]0.427158[/C][/ROW]
[ROW][C]37[/C][C]0.005816[/C][C]0.0696[/C][C]0.472323[/C][/ROW]
[ROW][C]38[/C][C]-0.009903[/C][C]-0.1184[/C][C]0.452948[/C][/ROW]
[ROW][C]39[/C][C]-0.009433[/C][C]-0.1128[/C][C]0.455172[/C][/ROW]
[ROW][C]40[/C][C]-0.069576[/C][C]-0.832[/C][C]0.203394[/C][/ROW]
[ROW][C]41[/C][C]0.00947[/C][C]0.1132[/C][C]0.454996[/C][/ROW]
[ROW][C]42[/C][C]-0.033979[/C][C]-0.4063[/C][C]0.342555[/C][/ROW]
[ROW][C]43[/C][C]-0.028097[/C][C]-0.336[/C][C]0.368684[/C][/ROW]
[ROW][C]44[/C][C]-0.061675[/C][C]-0.7375[/C][C]0.231004[/C][/ROW]
[ROW][C]45[/C][C]0.000936[/C][C]0.0112[/C][C]0.495543[/C][/ROW]
[ROW][C]46[/C][C]-0.014362[/C][C]-0.1717[/C][C]0.43194[/C][/ROW]
[ROW][C]47[/C][C]-0.057193[/C][C]-0.6839[/C][C]0.247564[/C][/ROW]
[ROW][C]48[/C][C]-0.009763[/C][C]-0.1167[/C][C]0.453613[/C][/ROW]
[ROW][C]49[/C][C]-0.060048[/C][C]-0.7181[/C][C]0.236943[/C][/ROW]
[ROW][C]50[/C][C]-0.081733[/C][C]-0.9774[/C][C]0.165014[/C][/ROW]
[ROW][C]51[/C][C]0.005039[/C][C]0.0603[/C][C]0.476015[/C][/ROW]
[ROW][C]52[/C][C]-0.032245[/C][C]-0.3856[/C][C]0.350184[/C][/ROW]
[ROW][C]53[/C][C]-0.036868[/C][C]-0.4409[/C][C]0.329985[/C][/ROW]
[ROW][C]54[/C][C]0.005333[/C][C]0.0638[/C][C]0.474619[/C][/ROW]
[ROW][C]55[/C][C]-0.040483[/C][C]-0.4841[/C][C]0.314526[/C][/ROW]
[ROW][C]56[/C][C]-0.018855[/C][C]-0.2255[/C][C]0.410967[/C][/ROW]
[ROW][C]57[/C][C]-0.021864[/C][C]-0.2615[/C][C]0.397057[/C][/ROW]
[ROW][C]58[/C][C]-0.02427[/C][C]-0.2902[/C][C]0.386032[/C][/ROW]
[ROW][C]59[/C][C]0.001674[/C][C]0.02[/C][C]0.49203[/C][/ROW]
[ROW][C]60[/C][C]-0.113328[/C][C]-1.3552[/C][C]0.088745[/C][/ROW]
[/TABLE]
Source: https://freestatistics.org/blog/index.php?pk=67184&T=2

Globally Unique Identifier (entire table): ba.freestatistics.org/blog/index.php?pk=67184&T=2

As an alternative you can also use a QR Code:  

The GUIDs for individual cells are displayed in the table below:

Partial Autocorrelation Function
Time lag kPACF(k)T-STATP-value
10.89767510.73460
20.0952681.13920.128254
30.1002951.19940.116187
4-0.072331-0.8650.194257
50.1086821.29970.097906
60.1146241.37070.086307
70.1349581.61390.05438
80.0991761.1860.1188
90.0259960.31090.378177
100.0146760.17550.430467
110.1989062.37860.009351
120.0575920.68870.246064
13-0.31564-3.77450.000117
14-0.037095-0.44360.329003
150.0381780.45650.324348
16-0.049505-0.5920.277396
170.0851651.01840.155098
18-0.114565-1.370.086417
19-0.000408-0.00490.498056
200.0657370.78610.216556
21-0.042744-0.51110.30502
220.0050520.06040.475955
230.0960281.14830.126376
240.0081450.09740.461274
25-0.228351-2.73070.003558
26-0.04144-0.49560.310486
27-0.052648-0.62960.264986
280.0786260.94020.174343
290.0432090.51670.303082
30-0.095138-1.13770.128578
31-0.004442-0.05310.478856
320.0010190.01220.495148
330.108261.29460.098772
34-0.03348-0.40040.344742
35-0.007017-0.08390.466624
36-0.015382-0.18390.427158
370.0058160.06960.472323
38-0.009903-0.11840.452948
39-0.009433-0.11280.455172
40-0.069576-0.8320.203394
410.009470.11320.454996
42-0.033979-0.40630.342555
43-0.028097-0.3360.368684
44-0.061675-0.73750.231004
450.0009360.01120.495543
46-0.014362-0.17170.43194
47-0.057193-0.68390.247564
48-0.009763-0.11670.453613
49-0.060048-0.71810.236943
50-0.081733-0.97740.165014
510.0050390.06030.476015
52-0.032245-0.38560.350184
53-0.036868-0.44090.329985
540.0053330.06380.474619
55-0.040483-0.48410.314526
56-0.018855-0.22550.410967
57-0.021864-0.26150.397057
58-0.02427-0.29020.386032
590.0016740.020.49203
60-0.113328-1.35520.088745


Parameters (Session):
par1 = 60 ; par2 = 1 ; par3 = 0 ; par4 = 0 ; par5 = 12 ; par6 = White Noise ; par7 = 0.95 ;
Parameters (R input):
par1 = 60 ; par2 = 1 ; par3 = 0 ; par4 = 0 ; par5 = 12 ; par6 = White Noise ; par7 = 0.95 ;
R code (references can be found in the software module):
if (par1 == 'Default') {
par1 = 10*log10(length(x))
} else {
par1 <- as.numeric(par1)
}
par2 <- as.numeric(par2)
par3 <- as.numeric(par3)
par4 <- as.numeric(par4)
par5 <- as.numeric(par5)
if (par6 == 'White Noise') par6 <- 'white' else par6 <- 'ma'
par7 <- as.numeric(par7)
if (par2 == 0) {
x <- log(x)
} else {
x <- (x ^ par2 - 1) / par2
}
if (par3 > 0) x <- diff(x,lag=1,difference=par3)
if (par4 > 0) x <- diff(x,lag=par5,difference=par4)
bitmap(file='pic1.png')
racf <- acf(x, par1, main='Autocorrelation', xlab='time lag', ylab='ACF', ci.type=par6, ci=par7, sub=paste('(lambda=',par2,', d=',par3,', D=',par4,', CI=', par7, ', CI type=',par6,')',sep=''))
dev.off()
bitmap(file='pic2.png')
rpacf <- pacf(x,par1,main='Partial Autocorrelation',xlab='lags',ylab='PACF')
dev.off()
(myacf <- c(racf$acf))
(mypacf <- c(rpacf$acf))
lengthx <- length(x)
sqrtn <- sqrt(lengthx)
load(file='createtable')
a<-table.start()
a<-table.row.start(a)
a<-table.element(a,'Autocorrelation Function',4,TRUE)
a<-table.row.end(a)
a<-table.row.start(a)
a<-table.element(a,'Time lag k',header=TRUE)
a<-table.element(a,hyperlink('basics.htm','ACF(k)','click here for more information about the Autocorrelation Function'),header=TRUE)
a<-table.element(a,'T-STAT',header=TRUE)
a<-table.element(a,'P-value',header=TRUE)
a<-table.row.end(a)
for (i in 2:(par1+1)) {
a<-table.row.start(a)
a<-table.element(a,i-1,header=TRUE)
a<-table.element(a,round(myacf[i],6))
mytstat <- myacf[i]*sqrtn
a<-table.element(a,round(mytstat,4))
a<-table.element(a,round(1-pt(abs(mytstat),lengthx),6))
a<-table.row.end(a)
}
a<-table.end(a)
table.save(a,file='mytable.tab')
a<-table.start()
a<-table.row.start(a)
a<-table.element(a,'Partial Autocorrelation Function',4,TRUE)
a<-table.row.end(a)
a<-table.row.start(a)
a<-table.element(a,'Time lag k',header=TRUE)
a<-table.element(a,hyperlink('basics.htm','PACF(k)','click here for more information about the Partial Autocorrelation Function'),header=TRUE)
a<-table.element(a,'T-STAT',header=TRUE)
a<-table.element(a,'P-value',header=TRUE)
a<-table.row.end(a)
for (i in 1:par1) {
a<-table.row.start(a)
a<-table.element(a,i,header=TRUE)
a<-table.element(a,round(mypacf[i],6))
mytstat <- mypacf[i]*sqrtn
a<-table.element(a,round(mytstat,4))
a<-table.element(a,round(1-pt(abs(mytstat),lengthx),6))
a<-table.row.end(a)
}
a<-table.end(a)
table.save(a,file='mytable1.tab')