Free Statistics

of Irreproducible Research!

Author's title

Author*The author of this computation has been verified*
R Software Modulerwasp_multipleregression.wasp
Title produced by softwareMultiple Regression
Date of computationSun, 13 Dec 2009 05:04:40 -0700
Cite this page as followsStatistical Computations at FreeStatistics.org, Office for Research Development and Education, URL https://freestatistics.org/blog/index.php?v=date/2009/Dec/13/t1260705947bydl4t02z7cn6e5.htm/, Retrieved Sun, 28 Apr 2024 06:10:34 +0000
Statistical Computations at FreeStatistics.org, Office for Research Development and Education, URL https://freestatistics.org/blog/index.php?pk=67231, Retrieved Sun, 28 Apr 2024 06:10:34 +0000
QR Codes:

Original text written by user:Zonder seizoenaliteit en met lineaire trend
IsPrivate?No (this computation is public)
User-defined keywords
Estimated Impact131
Family? (F = Feedback message, R = changed R code, M = changed R Module, P = changed Parameters, D = changed Data)
-     [Multiple Regression] [Q1 The Seatbeltlaw] [2007-11-14 19:27:43] [8cd6641b921d30ebe00b648d1481bba0]
- RM D  [Multiple Regression] [Seatbelt] [2009-11-12 14:06:21] [b98453cac15ba1066b407e146608df68]
-    D    [Multiple Regression] [shw7: Multiple li...] [2009-11-19 17:33:33] [3c8b83428ce260cd44df892bb7619588]
-   P         [Multiple Regression] [Paper: Zonder sei...] [2009-12-13 12:04:40] [7a39e26d7a09dd77604df90cb29f8d39] [Current]
-               [Multiple Regression] [Zonder seizoenali...] [2009-12-17 17:09:28] [1433a524809eda02c3198b3ae6eebb69]
Feedback Forum

Post a new message
Dataseries X:
0.7461	0.527
0.7775	0.472
0.7790	0
0.7744	0.052
0.7905	0.313
0.7719	0.364
0.7811	0.363
0.7557	-0.155
0.7637	0.052
0.7595	0.568
0.7471	0.668
0.7615	1.378
0.7487	0.252
0.7389	-0.402
0.7337	-0.05
0.7510	0.555
0.7382	0.05
0.7159	0.15
0.7542	0.45
0.7636	0.299
0.7433	0.199
0.7658	0.496
0.7627	0.444
0.7480	-0.393
0.7692	-0.444
0.7850	0.198
0.7913	0.494
0.7720	0.133
0.7880	0.388
0.8070	0.484
0.8268	0.278
0.8244	0.369
0.8487	0.165
0.8572	0.155
0.8214	0.087
0.8827	0.414
0.9216	0.36
0.8865	0.975
0.8816	0.27
0.8884	0.359
0.9466	0.169
0.9180	0.381
0.9337	0.154
0.9559	0.486
0.9626	0.925
0.9434	0.728
0.8639	-0.014
0.7996	0.046
0.6680	-0.819
0.6572	-1.674
0.6928	-0.788
0.6438	0.279
0.6454	0.396
0.6873	-0.141
0.7265	-0.019
0.7912	0.099
0.8114	0.742
0.8281	0.005
0.8393	0.448


Summary of computational transaction
Raw Inputview raw input (R code)
Raw Outputview raw output of R engine
Computing time3 seconds
R Server'Gwilym Jenkins' @ 72.249.127.135

\begin{tabular}{lllllllll}
\hline
Summary of computational transaction \tabularnewline
Raw Input & view raw input (R code)  \tabularnewline
Raw Output & view raw output of R engine  \tabularnewline
Computing time & 3 seconds \tabularnewline
R Server & 'Gwilym Jenkins' @ 72.249.127.135 \tabularnewline
\hline
\end{tabular}
%Source: https://freestatistics.org/blog/index.php?pk=67231&T=0

[TABLE]
[ROW][C]Summary of computational transaction[/C][/ROW]
[ROW][C]Raw Input[/C][C]view raw input (R code) [/C][/ROW]
[ROW][C]Raw Output[/C][C]view raw output of R engine [/C][/ROW]
[ROW][C]Computing time[/C][C]3 seconds[/C][/ROW]
[ROW][C]R Server[/C][C]'Gwilym Jenkins' @ 72.249.127.135[/C][/ROW]
[/TABLE]
Source: https://freestatistics.org/blog/index.php?pk=67231&T=0

Globally Unique Identifier (entire table): ba.freestatistics.org/blog/index.php?pk=67231&T=0

As an alternative you can also use a QR Code:  

The GUIDs for individual cells are displayed in the table below:

Summary of computational transaction
Raw Inputview raw input (R code)
Raw Outputview raw output of R engine
Computing time3 seconds
R Server'Gwilym Jenkins' @ 72.249.127.135


Multiple Linear Regression - Estimated Regression Equation
USDOLLAR[t] = + 0.73519855173591 + 0.0825943778864721Amerikaanse_inflatie[t] + 0.00136131812051283t + e[t]

\begin{tabular}{lllllllll}
\hline
Multiple Linear Regression - Estimated Regression Equation \tabularnewline
USDOLLAR[t] =  +  0.73519855173591 +  0.0825943778864721Amerikaanse_inflatie[t] +  0.00136131812051283t  + e[t] \tabularnewline
\hline
\end{tabular}
%Source: https://freestatistics.org/blog/index.php?pk=67231&T=1

[TABLE]
[ROW][C]Multiple Linear Regression - Estimated Regression Equation[/C][/ROW]
[ROW][C]USDOLLAR[t] =  +  0.73519855173591 +  0.0825943778864721Amerikaanse_inflatie[t] +  0.00136131812051283t  + e[t][/C][/ROW]
[/TABLE]
Source: https://freestatistics.org/blog/index.php?pk=67231&T=1

Globally Unique Identifier (entire table): ba.freestatistics.org/blog/index.php?pk=67231&T=1

As an alternative you can also use a QR Code:  

The GUIDs for individual cells are displayed in the table below:

Multiple Linear Regression - Estimated Regression Equation
USDOLLAR[t] = + 0.73519855173591 + 0.0825943778864721Amerikaanse_inflatie[t] + 0.00136131812051283t + e[t]


Multiple Linear Regression - Ordinary Least Squares
VariableParameterS.D.T-STATH0: parameter = 02-tail p-value1-tail p-value
(Intercept)0.735198551735910.01912538.442600
Amerikaanse_inflatie0.08259437788647210.0198964.15130.0001145.7e-05
t0.001361318120512830.0005232.60110.0118630.005932

\begin{tabular}{lllllllll}
\hline
Multiple Linear Regression - Ordinary Least Squares \tabularnewline
Variable & Parameter & S.D. & T-STATH0: parameter = 0 & 2-tail p-value & 1-tail p-value \tabularnewline
(Intercept) & 0.73519855173591 & 0.019125 & 38.4426 & 0 & 0 \tabularnewline
Amerikaanse_inflatie & 0.0825943778864721 & 0.019896 & 4.1513 & 0.000114 & 5.7e-05 \tabularnewline
t & 0.00136131812051283 & 0.000523 & 2.6011 & 0.011863 & 0.005932 \tabularnewline
\hline
\end{tabular}
%Source: https://freestatistics.org/blog/index.php?pk=67231&T=2

[TABLE]
[ROW][C]Multiple Linear Regression - Ordinary Least Squares[/C][/ROW]
[ROW][C]Variable[/C][C]Parameter[/C][C]S.D.[/C][C]T-STATH0: parameter = 0[/C][C]2-tail p-value[/C][C]1-tail p-value[/C][/ROW]
[ROW][C](Intercept)[/C][C]0.73519855173591[/C][C]0.019125[/C][C]38.4426[/C][C]0[/C][C]0[/C][/ROW]
[ROW][C]Amerikaanse_inflatie[/C][C]0.0825943778864721[/C][C]0.019896[/C][C]4.1513[/C][C]0.000114[/C][C]5.7e-05[/C][/ROW]
[ROW][C]t[/C][C]0.00136131812051283[/C][C]0.000523[/C][C]2.6011[/C][C]0.011863[/C][C]0.005932[/C][/ROW]
[/TABLE]
Source: https://freestatistics.org/blog/index.php?pk=67231&T=2

Globally Unique Identifier (entire table): ba.freestatistics.org/blog/index.php?pk=67231&T=2

As an alternative you can also use a QR Code:  

The GUIDs for individual cells are displayed in the table below:

Multiple Linear Regression - Ordinary Least Squares
VariableParameterS.D.T-STATH0: parameter = 02-tail p-value1-tail p-value
(Intercept)0.735198551735910.01912538.442600
Amerikaanse_inflatie0.08259437788647210.0198964.15130.0001145.7e-05
t0.001361318120512830.0005232.60110.0118630.005932


Multiple Linear Regression - Regression Statistics
Multiple R0.520729865010518
R-squared0.271159592313872
Adjusted R-squared0.245129577753653
F-TEST (value)10.4171894213336
F-TEST (DF numerator)2
F-TEST (DF denominator)56
p-value0.000142465066987896
Multiple Linear Regression - Residual Statistics
Residual Standard Deviation0.0673810400075746
Sum Squared Residuals0.254251454940132

\begin{tabular}{lllllllll}
\hline
Multiple Linear Regression - Regression Statistics \tabularnewline
Multiple R & 0.520729865010518 \tabularnewline
R-squared & 0.271159592313872 \tabularnewline
Adjusted R-squared & 0.245129577753653 \tabularnewline
F-TEST (value) & 10.4171894213336 \tabularnewline
F-TEST (DF numerator) & 2 \tabularnewline
F-TEST (DF denominator) & 56 \tabularnewline
p-value & 0.000142465066987896 \tabularnewline
Multiple Linear Regression - Residual Statistics \tabularnewline
Residual Standard Deviation & 0.0673810400075746 \tabularnewline
Sum Squared Residuals & 0.254251454940132 \tabularnewline
\hline
\end{tabular}
%Source: https://freestatistics.org/blog/index.php?pk=67231&T=3

[TABLE]
[ROW][C]Multiple Linear Regression - Regression Statistics[/C][/ROW]
[ROW][C]Multiple R[/C][C]0.520729865010518[/C][/ROW]
[ROW][C]R-squared[/C][C]0.271159592313872[/C][/ROW]
[ROW][C]Adjusted R-squared[/C][C]0.245129577753653[/C][/ROW]
[ROW][C]F-TEST (value)[/C][C]10.4171894213336[/C][/ROW]
[ROW][C]F-TEST (DF numerator)[/C][C]2[/C][/ROW]
[ROW][C]F-TEST (DF denominator)[/C][C]56[/C][/ROW]
[ROW][C]p-value[/C][C]0.000142465066987896[/C][/ROW]
[ROW][C]Multiple Linear Regression - Residual Statistics[/C][/ROW]
[ROW][C]Residual Standard Deviation[/C][C]0.0673810400075746[/C][/ROW]
[ROW][C]Sum Squared Residuals[/C][C]0.254251454940132[/C][/ROW]
[/TABLE]
Source: https://freestatistics.org/blog/index.php?pk=67231&T=3

Globally Unique Identifier (entire table): ba.freestatistics.org/blog/index.php?pk=67231&T=3

As an alternative you can also use a QR Code:  

The GUIDs for individual cells are displayed in the table below:

Multiple Linear Regression - Regression Statistics
Multiple R0.520729865010518
R-squared0.271159592313872
Adjusted R-squared0.245129577753653
F-TEST (value)10.4171894213336
F-TEST (DF numerator)2
F-TEST (DF denominator)56
p-value0.000142465066987896
Multiple Linear Regression - Residual Statistics
Residual Standard Deviation0.0673810400075746
Sum Squared Residuals0.254251454940132


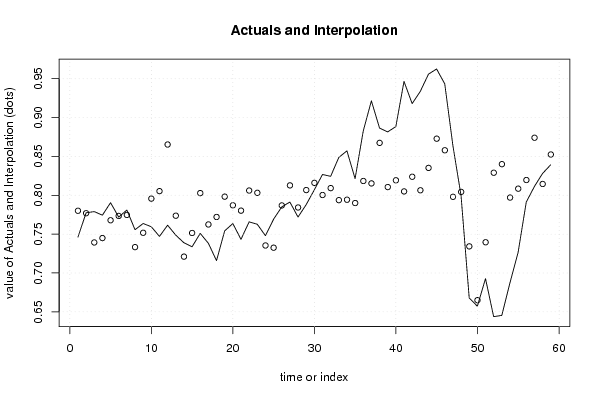
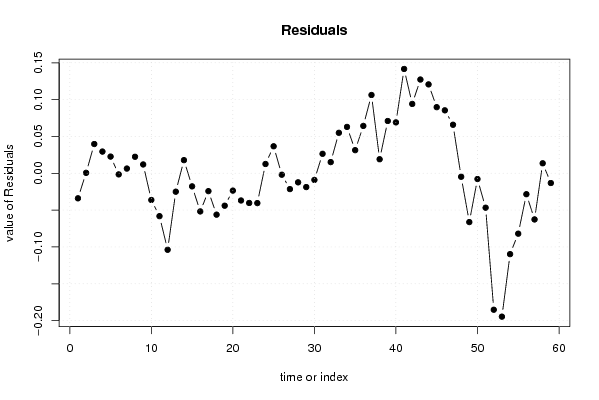
Multiple Linear Regression - Actuals, Interpolation, and Residuals
Time or IndexActualsInterpolationForecastResidualsPrediction Error
10.74610.78008710700259-0.0339871070025906
20.77750.776905734339350.000594265660650347
30.7790.7392825060974480.0397174939025523
40.77440.7449387318680570.0294612681319429
50.79050.7678571826169390.0226428173830608
60.77190.773430814009662-0.00153081400966201
70.78110.7747095377522880.00639046224771163
80.75570.7332869681276090.0224130318723914
90.76370.7517453224706210.0119546775293788
100.75950.795725339580554-0.0362253395805537
110.74710.805346095489714-0.0582460954897137
120.76150.865349421909622-0.103849421909622
130.74870.773709470529967-0.0250094705299669
140.73890.7210540655127270.017845934487273
150.73370.751488604649278-0.017788604649278
160.7510.802819521391106-0.0518195213911065
170.73820.762470678678951-0.0242706786789509
180.71590.772091434588111-0.056191434588111
190.75420.798231066074565-0.0440310660745654
200.76360.787120633134221-0.0235206331342210
210.74330.780222513466087-0.0369225134660866
220.76580.806114361818882-0.0403143618188815
230.76270.803180772289298-0.0404807722892978
240.7480.7354105961188340.0125894038811665
250.76920.7325596009671360.0366403990328637
260.7850.786946509690764-0.00194650969076417
270.79130.812755763665673-0.0214557636656728
280.7720.784300511369169-0.0123005113691691
290.7880.806723395850732-0.0187233958507323
300.8070.816013774248347-0.00901377424834646
310.82680.8003606505242460.0264393494757539
320.82440.8092380570324280.0151619429675721
330.84870.79375012206410.0549498779358996
340.85720.7942854964057490.0629145035942515
350.82140.7900303968299810.0313696031700188
360.88270.818400076519370.0642999234806296
370.92160.8153012982340140.106298701765986
380.88650.8674581587547070.0190418412452930
390.88160.8105904404652570.0710095595347431
400.88840.8193026582176660.0690973417823342
410.94660.8049710445397490.141628955460251
420.9180.8238423707721940.0941576292278062
430.93370.8064547651124770.127245234887522
440.95590.83523741669130.120662583308701
450.96260.8728576667039730.0897423332960269
460.94340.857947892380850.085452107619149
470.86390.7980241821096010.0658758178903985
480.79960.804341162903303-0.00474116290330264
490.6680.734258344152017-0.0662583441520171
500.65720.665001469179596-0.0078014691795963
510.69280.739541406107523-0.0467414061075234
520.64380.829030925432902-0.185230925432902
530.64540.840055785766132-0.194655785766132
540.68730.79706392296161-0.109763922961609
550.72650.808501755184272-0.0820017551842717
560.79120.819609209895388-0.0284092098953882
570.81140.874078712996903-0.0626787129969026
580.82810.8145679746150860.0135320253849144
590.83930.852518602139306-0.0132186021393054

\begin{tabular}{lllllllll}
\hline
Multiple Linear Regression - Actuals, Interpolation, and Residuals \tabularnewline
Time or Index & Actuals & InterpolationForecast & ResidualsPrediction Error \tabularnewline
1 & 0.7461 & 0.78008710700259 & -0.0339871070025906 \tabularnewline
2 & 0.7775 & 0.77690573433935 & 0.000594265660650347 \tabularnewline
3 & 0.779 & 0.739282506097448 & 0.0397174939025523 \tabularnewline
4 & 0.7744 & 0.744938731868057 & 0.0294612681319429 \tabularnewline
5 & 0.7905 & 0.767857182616939 & 0.0226428173830608 \tabularnewline
6 & 0.7719 & 0.773430814009662 & -0.00153081400966201 \tabularnewline
7 & 0.7811 & 0.774709537752288 & 0.00639046224771163 \tabularnewline
8 & 0.7557 & 0.733286968127609 & 0.0224130318723914 \tabularnewline
9 & 0.7637 & 0.751745322470621 & 0.0119546775293788 \tabularnewline
10 & 0.7595 & 0.795725339580554 & -0.0362253395805537 \tabularnewline
11 & 0.7471 & 0.805346095489714 & -0.0582460954897137 \tabularnewline
12 & 0.7615 & 0.865349421909622 & -0.103849421909622 \tabularnewline
13 & 0.7487 & 0.773709470529967 & -0.0250094705299669 \tabularnewline
14 & 0.7389 & 0.721054065512727 & 0.017845934487273 \tabularnewline
15 & 0.7337 & 0.751488604649278 & -0.017788604649278 \tabularnewline
16 & 0.751 & 0.802819521391106 & -0.0518195213911065 \tabularnewline
17 & 0.7382 & 0.762470678678951 & -0.0242706786789509 \tabularnewline
18 & 0.7159 & 0.772091434588111 & -0.056191434588111 \tabularnewline
19 & 0.7542 & 0.798231066074565 & -0.0440310660745654 \tabularnewline
20 & 0.7636 & 0.787120633134221 & -0.0235206331342210 \tabularnewline
21 & 0.7433 & 0.780222513466087 & -0.0369225134660866 \tabularnewline
22 & 0.7658 & 0.806114361818882 & -0.0403143618188815 \tabularnewline
23 & 0.7627 & 0.803180772289298 & -0.0404807722892978 \tabularnewline
24 & 0.748 & 0.735410596118834 & 0.0125894038811665 \tabularnewline
25 & 0.7692 & 0.732559600967136 & 0.0366403990328637 \tabularnewline
26 & 0.785 & 0.786946509690764 & -0.00194650969076417 \tabularnewline
27 & 0.7913 & 0.812755763665673 & -0.0214557636656728 \tabularnewline
28 & 0.772 & 0.784300511369169 & -0.0123005113691691 \tabularnewline
29 & 0.788 & 0.806723395850732 & -0.0187233958507323 \tabularnewline
30 & 0.807 & 0.816013774248347 & -0.00901377424834646 \tabularnewline
31 & 0.8268 & 0.800360650524246 & 0.0264393494757539 \tabularnewline
32 & 0.8244 & 0.809238057032428 & 0.0151619429675721 \tabularnewline
33 & 0.8487 & 0.7937501220641 & 0.0549498779358996 \tabularnewline
34 & 0.8572 & 0.794285496405749 & 0.0629145035942515 \tabularnewline
35 & 0.8214 & 0.790030396829981 & 0.0313696031700188 \tabularnewline
36 & 0.8827 & 0.81840007651937 & 0.0642999234806296 \tabularnewline
37 & 0.9216 & 0.815301298234014 & 0.106298701765986 \tabularnewline
38 & 0.8865 & 0.867458158754707 & 0.0190418412452930 \tabularnewline
39 & 0.8816 & 0.810590440465257 & 0.0710095595347431 \tabularnewline
40 & 0.8884 & 0.819302658217666 & 0.0690973417823342 \tabularnewline
41 & 0.9466 & 0.804971044539749 & 0.141628955460251 \tabularnewline
42 & 0.918 & 0.823842370772194 & 0.0941576292278062 \tabularnewline
43 & 0.9337 & 0.806454765112477 & 0.127245234887522 \tabularnewline
44 & 0.9559 & 0.8352374166913 & 0.120662583308701 \tabularnewline
45 & 0.9626 & 0.872857666703973 & 0.0897423332960269 \tabularnewline
46 & 0.9434 & 0.85794789238085 & 0.085452107619149 \tabularnewline
47 & 0.8639 & 0.798024182109601 & 0.0658758178903985 \tabularnewline
48 & 0.7996 & 0.804341162903303 & -0.00474116290330264 \tabularnewline
49 & 0.668 & 0.734258344152017 & -0.0662583441520171 \tabularnewline
50 & 0.6572 & 0.665001469179596 & -0.0078014691795963 \tabularnewline
51 & 0.6928 & 0.739541406107523 & -0.0467414061075234 \tabularnewline
52 & 0.6438 & 0.829030925432902 & -0.185230925432902 \tabularnewline
53 & 0.6454 & 0.840055785766132 & -0.194655785766132 \tabularnewline
54 & 0.6873 & 0.79706392296161 & -0.109763922961609 \tabularnewline
55 & 0.7265 & 0.808501755184272 & -0.0820017551842717 \tabularnewline
56 & 0.7912 & 0.819609209895388 & -0.0284092098953882 \tabularnewline
57 & 0.8114 & 0.874078712996903 & -0.0626787129969026 \tabularnewline
58 & 0.8281 & 0.814567974615086 & 0.0135320253849144 \tabularnewline
59 & 0.8393 & 0.852518602139306 & -0.0132186021393054 \tabularnewline
\hline
\end{tabular}
%Source: https://freestatistics.org/blog/index.php?pk=67231&T=4

[TABLE]
[ROW][C]Multiple Linear Regression - Actuals, Interpolation, and Residuals[/C][/ROW]
[ROW][C]Time or Index[/C][C]Actuals[/C][C]InterpolationForecast[/C][C]ResidualsPrediction Error[/C][/ROW]
[ROW][C]1[/C][C]0.7461[/C][C]0.78008710700259[/C][C]-0.0339871070025906[/C][/ROW]
[ROW][C]2[/C][C]0.7775[/C][C]0.77690573433935[/C][C]0.000594265660650347[/C][/ROW]
[ROW][C]3[/C][C]0.779[/C][C]0.739282506097448[/C][C]0.0397174939025523[/C][/ROW]
[ROW][C]4[/C][C]0.7744[/C][C]0.744938731868057[/C][C]0.0294612681319429[/C][/ROW]
[ROW][C]5[/C][C]0.7905[/C][C]0.767857182616939[/C][C]0.0226428173830608[/C][/ROW]
[ROW][C]6[/C][C]0.7719[/C][C]0.773430814009662[/C][C]-0.00153081400966201[/C][/ROW]
[ROW][C]7[/C][C]0.7811[/C][C]0.774709537752288[/C][C]0.00639046224771163[/C][/ROW]
[ROW][C]8[/C][C]0.7557[/C][C]0.733286968127609[/C][C]0.0224130318723914[/C][/ROW]
[ROW][C]9[/C][C]0.7637[/C][C]0.751745322470621[/C][C]0.0119546775293788[/C][/ROW]
[ROW][C]10[/C][C]0.7595[/C][C]0.795725339580554[/C][C]-0.0362253395805537[/C][/ROW]
[ROW][C]11[/C][C]0.7471[/C][C]0.805346095489714[/C][C]-0.0582460954897137[/C][/ROW]
[ROW][C]12[/C][C]0.7615[/C][C]0.865349421909622[/C][C]-0.103849421909622[/C][/ROW]
[ROW][C]13[/C][C]0.7487[/C][C]0.773709470529967[/C][C]-0.0250094705299669[/C][/ROW]
[ROW][C]14[/C][C]0.7389[/C][C]0.721054065512727[/C][C]0.017845934487273[/C][/ROW]
[ROW][C]15[/C][C]0.7337[/C][C]0.751488604649278[/C][C]-0.017788604649278[/C][/ROW]
[ROW][C]16[/C][C]0.751[/C][C]0.802819521391106[/C][C]-0.0518195213911065[/C][/ROW]
[ROW][C]17[/C][C]0.7382[/C][C]0.762470678678951[/C][C]-0.0242706786789509[/C][/ROW]
[ROW][C]18[/C][C]0.7159[/C][C]0.772091434588111[/C][C]-0.056191434588111[/C][/ROW]
[ROW][C]19[/C][C]0.7542[/C][C]0.798231066074565[/C][C]-0.0440310660745654[/C][/ROW]
[ROW][C]20[/C][C]0.7636[/C][C]0.787120633134221[/C][C]-0.0235206331342210[/C][/ROW]
[ROW][C]21[/C][C]0.7433[/C][C]0.780222513466087[/C][C]-0.0369225134660866[/C][/ROW]
[ROW][C]22[/C][C]0.7658[/C][C]0.806114361818882[/C][C]-0.0403143618188815[/C][/ROW]
[ROW][C]23[/C][C]0.7627[/C][C]0.803180772289298[/C][C]-0.0404807722892978[/C][/ROW]
[ROW][C]24[/C][C]0.748[/C][C]0.735410596118834[/C][C]0.0125894038811665[/C][/ROW]
[ROW][C]25[/C][C]0.7692[/C][C]0.732559600967136[/C][C]0.0366403990328637[/C][/ROW]
[ROW][C]26[/C][C]0.785[/C][C]0.786946509690764[/C][C]-0.00194650969076417[/C][/ROW]
[ROW][C]27[/C][C]0.7913[/C][C]0.812755763665673[/C][C]-0.0214557636656728[/C][/ROW]
[ROW][C]28[/C][C]0.772[/C][C]0.784300511369169[/C][C]-0.0123005113691691[/C][/ROW]
[ROW][C]29[/C][C]0.788[/C][C]0.806723395850732[/C][C]-0.0187233958507323[/C][/ROW]
[ROW][C]30[/C][C]0.807[/C][C]0.816013774248347[/C][C]-0.00901377424834646[/C][/ROW]
[ROW][C]31[/C][C]0.8268[/C][C]0.800360650524246[/C][C]0.0264393494757539[/C][/ROW]
[ROW][C]32[/C][C]0.8244[/C][C]0.809238057032428[/C][C]0.0151619429675721[/C][/ROW]
[ROW][C]33[/C][C]0.8487[/C][C]0.7937501220641[/C][C]0.0549498779358996[/C][/ROW]
[ROW][C]34[/C][C]0.8572[/C][C]0.794285496405749[/C][C]0.0629145035942515[/C][/ROW]
[ROW][C]35[/C][C]0.8214[/C][C]0.790030396829981[/C][C]0.0313696031700188[/C][/ROW]
[ROW][C]36[/C][C]0.8827[/C][C]0.81840007651937[/C][C]0.0642999234806296[/C][/ROW]
[ROW][C]37[/C][C]0.9216[/C][C]0.815301298234014[/C][C]0.106298701765986[/C][/ROW]
[ROW][C]38[/C][C]0.8865[/C][C]0.867458158754707[/C][C]0.0190418412452930[/C][/ROW]
[ROW][C]39[/C][C]0.8816[/C][C]0.810590440465257[/C][C]0.0710095595347431[/C][/ROW]
[ROW][C]40[/C][C]0.8884[/C][C]0.819302658217666[/C][C]0.0690973417823342[/C][/ROW]
[ROW][C]41[/C][C]0.9466[/C][C]0.804971044539749[/C][C]0.141628955460251[/C][/ROW]
[ROW][C]42[/C][C]0.918[/C][C]0.823842370772194[/C][C]0.0941576292278062[/C][/ROW]
[ROW][C]43[/C][C]0.9337[/C][C]0.806454765112477[/C][C]0.127245234887522[/C][/ROW]
[ROW][C]44[/C][C]0.9559[/C][C]0.8352374166913[/C][C]0.120662583308701[/C][/ROW]
[ROW][C]45[/C][C]0.9626[/C][C]0.872857666703973[/C][C]0.0897423332960269[/C][/ROW]
[ROW][C]46[/C][C]0.9434[/C][C]0.85794789238085[/C][C]0.085452107619149[/C][/ROW]
[ROW][C]47[/C][C]0.8639[/C][C]0.798024182109601[/C][C]0.0658758178903985[/C][/ROW]
[ROW][C]48[/C][C]0.7996[/C][C]0.804341162903303[/C][C]-0.00474116290330264[/C][/ROW]
[ROW][C]49[/C][C]0.668[/C][C]0.734258344152017[/C][C]-0.0662583441520171[/C][/ROW]
[ROW][C]50[/C][C]0.6572[/C][C]0.665001469179596[/C][C]-0.0078014691795963[/C][/ROW]
[ROW][C]51[/C][C]0.6928[/C][C]0.739541406107523[/C][C]-0.0467414061075234[/C][/ROW]
[ROW][C]52[/C][C]0.6438[/C][C]0.829030925432902[/C][C]-0.185230925432902[/C][/ROW]
[ROW][C]53[/C][C]0.6454[/C][C]0.840055785766132[/C][C]-0.194655785766132[/C][/ROW]
[ROW][C]54[/C][C]0.6873[/C][C]0.79706392296161[/C][C]-0.109763922961609[/C][/ROW]
[ROW][C]55[/C][C]0.7265[/C][C]0.808501755184272[/C][C]-0.0820017551842717[/C][/ROW]
[ROW][C]56[/C][C]0.7912[/C][C]0.819609209895388[/C][C]-0.0284092098953882[/C][/ROW]
[ROW][C]57[/C][C]0.8114[/C][C]0.874078712996903[/C][C]-0.0626787129969026[/C][/ROW]
[ROW][C]58[/C][C]0.8281[/C][C]0.814567974615086[/C][C]0.0135320253849144[/C][/ROW]
[ROW][C]59[/C][C]0.8393[/C][C]0.852518602139306[/C][C]-0.0132186021393054[/C][/ROW]
[/TABLE]
Source: https://freestatistics.org/blog/index.php?pk=67231&T=4

Globally Unique Identifier (entire table): ba.freestatistics.org/blog/index.php?pk=67231&T=4

As an alternative you can also use a QR Code:  

The GUIDs for individual cells are displayed in the table below:

Multiple Linear Regression - Actuals, Interpolation, and Residuals
Time or IndexActualsInterpolationForecastResidualsPrediction Error
10.74610.78008710700259-0.0339871070025906
20.77750.776905734339350.000594265660650347
30.7790.7392825060974480.0397174939025523
40.77440.7449387318680570.0294612681319429
50.79050.7678571826169390.0226428173830608
60.77190.773430814009662-0.00153081400966201
70.78110.7747095377522880.00639046224771163
80.75570.7332869681276090.0224130318723914
90.76370.7517453224706210.0119546775293788
100.75950.795725339580554-0.0362253395805537
110.74710.805346095489714-0.0582460954897137
120.76150.865349421909622-0.103849421909622
130.74870.773709470529967-0.0250094705299669
140.73890.7210540655127270.017845934487273
150.73370.751488604649278-0.017788604649278
160.7510.802819521391106-0.0518195213911065
170.73820.762470678678951-0.0242706786789509
180.71590.772091434588111-0.056191434588111
190.75420.798231066074565-0.0440310660745654
200.76360.787120633134221-0.0235206331342210
210.74330.780222513466087-0.0369225134660866
220.76580.806114361818882-0.0403143618188815
230.76270.803180772289298-0.0404807722892978
240.7480.7354105961188340.0125894038811665
250.76920.7325596009671360.0366403990328637
260.7850.786946509690764-0.00194650969076417
270.79130.812755763665673-0.0214557636656728
280.7720.784300511369169-0.0123005113691691
290.7880.806723395850732-0.0187233958507323
300.8070.816013774248347-0.00901377424834646
310.82680.8003606505242460.0264393494757539
320.82440.8092380570324280.0151619429675721
330.84870.79375012206410.0549498779358996
340.85720.7942854964057490.0629145035942515
350.82140.7900303968299810.0313696031700188
360.88270.818400076519370.0642999234806296
370.92160.8153012982340140.106298701765986
380.88650.8674581587547070.0190418412452930
390.88160.8105904404652570.0710095595347431
400.88840.8193026582176660.0690973417823342
410.94660.8049710445397490.141628955460251
420.9180.8238423707721940.0941576292278062
430.93370.8064547651124770.127245234887522
440.95590.83523741669130.120662583308701
450.96260.8728576667039730.0897423332960269
460.94340.857947892380850.085452107619149
470.86390.7980241821096010.0658758178903985
480.79960.804341162903303-0.00474116290330264
490.6680.734258344152017-0.0662583441520171
500.65720.665001469179596-0.0078014691795963
510.69280.739541406107523-0.0467414061075234
520.64380.829030925432902-0.185230925432902
530.64540.840055785766132-0.194655785766132
540.68730.79706392296161-0.109763922961609
550.72650.808501755184272-0.0820017551842717
560.79120.819609209895388-0.0284092098953882
570.81140.874078712996903-0.0626787129969026
580.82810.8145679746150860.0135320253849144
590.83930.852518602139306-0.0132186021393054


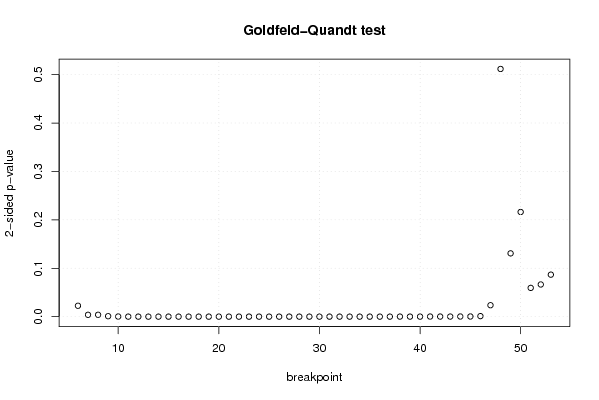
Goldfeld-Quandt test for Heteroskedasticity
p-valuesAlternative Hypothesis
breakpoint indexgreater2-sidedless
60.01125619258846750.02251238517693500.988743807411532
70.001878646100644510.003757292201289010.998121353899355
80.001923305564879780.003846611129759570.99807669443512
90.0004705593541127880.0009411187082255770.999529440645887
100.0001134456701608210.0002268913403216420.99988655432984
113.19012077812098e-056.38024155624197e-050.999968098792219
129.1659266711945e-061.8331853342389e-050.999990834073329
132.14544409821765e-064.2908881964353e-060.999997854555902
145.75016070173572e-071.15003214034714e-060.99999942498393
151.39596006816896e-072.79192013633791e-070.999999860403993
163.04273871867666e-086.08547743735332e-080.999999969572613
175.26010318655923e-091.05202063731185e-080.999999994739897
183.18241273030716e-096.36482546061432e-090.999999996817587
191.76204553860701e-093.52409107721402e-090.999999998237954
202.01403204877270e-094.02806409754541e-090.999999997985968
215.16492348743025e-101.03298469748605e-090.999999999483508
225.4595341287835e-101.0919068257567e-090.999999999454047
233.81698545046685e-107.6339709009337e-100.999999999618301
241.04339420891356e-102.08678841782713e-100.99999999989566
259.70772999086574e-111.94154599817315e-100.999999999902923
262.28630121975507e-104.57260243951013e-100.99999999977137
275.45065724579488e-101.09013144915898e-090.999999999454934
282.88334709169426e-105.76669418338851e-100.999999999711665
293.81564707581058e-107.63129415162116e-100.999999999618435
301.44863815768873e-092.89727631537746e-090.999999998551362
311.10390692842310e-082.20781385684621e-080.99999998896093
323.37380789579229e-086.74761579158459e-080.999999966261921
332.02265922970327e-074.04531845940654e-070.999999797734077
347.06410413042676e-071.41282082608535e-060.999999293589587
356.07190627933956e-071.21438125586791e-060.999999392809372
362.67094607662653e-065.34189215325305e-060.999997329053923
372.45351208124863e-054.90702416249726e-050.999975464879188
384.89655028191778e-059.79310056383556e-050.99995103449718
394.28792476847373e-058.57584953694745e-050.999957120752315
403.59110748686737e-057.18221497373473e-050.999964088925131
410.0001173764167785540.0002347528335571080.999882623583221
428.1067559388506e-050.0001621351187770120.999918932440611
439.99924346771229e-050.0001999848693542460.999900007565323
440.0001565435403951080.0003130870807902160.999843456459605
450.000166674720236520.000333349440473040.999833325279764
460.0005436885076530750.001087377015306150.999456311492347
470.01181180381727080.02362360763454150.98818819618273
480.7441041098562920.5117917802874170.255895890143708
490.9346007148091910.1307985703816170.0653992851908086
500.891878304198280.2162433916034410.108121695801721
510.9702839097896960.05943218042060870.0297160902103043
520.9667514791206260.06649704175874790.0332485208793740
530.9566202444032780.0867595111934440.043379755596722

\begin{tabular}{lllllllll}
\hline
Goldfeld-Quandt test for Heteroskedasticity \tabularnewline
p-values & Alternative Hypothesis \tabularnewline
breakpoint index & greater & 2-sided & less \tabularnewline
6 & 0.0112561925884675 & 0.0225123851769350 & 0.988743807411532 \tabularnewline
7 & 0.00187864610064451 & 0.00375729220128901 & 0.998121353899355 \tabularnewline
8 & 0.00192330556487978 & 0.00384661112975957 & 0.99807669443512 \tabularnewline
9 & 0.000470559354112788 & 0.000941118708225577 & 0.999529440645887 \tabularnewline
10 & 0.000113445670160821 & 0.000226891340321642 & 0.99988655432984 \tabularnewline
11 & 3.19012077812098e-05 & 6.38024155624197e-05 & 0.999968098792219 \tabularnewline
12 & 9.1659266711945e-06 & 1.8331853342389e-05 & 0.999990834073329 \tabularnewline
13 & 2.14544409821765e-06 & 4.2908881964353e-06 & 0.999997854555902 \tabularnewline
14 & 5.75016070173572e-07 & 1.15003214034714e-06 & 0.99999942498393 \tabularnewline
15 & 1.39596006816896e-07 & 2.79192013633791e-07 & 0.999999860403993 \tabularnewline
16 & 3.04273871867666e-08 & 6.08547743735332e-08 & 0.999999969572613 \tabularnewline
17 & 5.26010318655923e-09 & 1.05202063731185e-08 & 0.999999994739897 \tabularnewline
18 & 3.18241273030716e-09 & 6.36482546061432e-09 & 0.999999996817587 \tabularnewline
19 & 1.76204553860701e-09 & 3.52409107721402e-09 & 0.999999998237954 \tabularnewline
20 & 2.01403204877270e-09 & 4.02806409754541e-09 & 0.999999997985968 \tabularnewline
21 & 5.16492348743025e-10 & 1.03298469748605e-09 & 0.999999999483508 \tabularnewline
22 & 5.4595341287835e-10 & 1.0919068257567e-09 & 0.999999999454047 \tabularnewline
23 & 3.81698545046685e-10 & 7.6339709009337e-10 & 0.999999999618301 \tabularnewline
24 & 1.04339420891356e-10 & 2.08678841782713e-10 & 0.99999999989566 \tabularnewline
25 & 9.70772999086574e-11 & 1.94154599817315e-10 & 0.999999999902923 \tabularnewline
26 & 2.28630121975507e-10 & 4.57260243951013e-10 & 0.99999999977137 \tabularnewline
27 & 5.45065724579488e-10 & 1.09013144915898e-09 & 0.999999999454934 \tabularnewline
28 & 2.88334709169426e-10 & 5.76669418338851e-10 & 0.999999999711665 \tabularnewline
29 & 3.81564707581058e-10 & 7.63129415162116e-10 & 0.999999999618435 \tabularnewline
30 & 1.44863815768873e-09 & 2.89727631537746e-09 & 0.999999998551362 \tabularnewline
31 & 1.10390692842310e-08 & 2.20781385684621e-08 & 0.99999998896093 \tabularnewline
32 & 3.37380789579229e-08 & 6.74761579158459e-08 & 0.999999966261921 \tabularnewline
33 & 2.02265922970327e-07 & 4.04531845940654e-07 & 0.999999797734077 \tabularnewline
34 & 7.06410413042676e-07 & 1.41282082608535e-06 & 0.999999293589587 \tabularnewline
35 & 6.07190627933956e-07 & 1.21438125586791e-06 & 0.999999392809372 \tabularnewline
36 & 2.67094607662653e-06 & 5.34189215325305e-06 & 0.999997329053923 \tabularnewline
37 & 2.45351208124863e-05 & 4.90702416249726e-05 & 0.999975464879188 \tabularnewline
38 & 4.89655028191778e-05 & 9.79310056383556e-05 & 0.99995103449718 \tabularnewline
39 & 4.28792476847373e-05 & 8.57584953694745e-05 & 0.999957120752315 \tabularnewline
40 & 3.59110748686737e-05 & 7.18221497373473e-05 & 0.999964088925131 \tabularnewline
41 & 0.000117376416778554 & 0.000234752833557108 & 0.999882623583221 \tabularnewline
42 & 8.1067559388506e-05 & 0.000162135118777012 & 0.999918932440611 \tabularnewline
43 & 9.99924346771229e-05 & 0.000199984869354246 & 0.999900007565323 \tabularnewline
44 & 0.000156543540395108 & 0.000313087080790216 & 0.999843456459605 \tabularnewline
45 & 0.00016667472023652 & 0.00033334944047304 & 0.999833325279764 \tabularnewline
46 & 0.000543688507653075 & 0.00108737701530615 & 0.999456311492347 \tabularnewline
47 & 0.0118118038172708 & 0.0236236076345415 & 0.98818819618273 \tabularnewline
48 & 0.744104109856292 & 0.511791780287417 & 0.255895890143708 \tabularnewline
49 & 0.934600714809191 & 0.130798570381617 & 0.0653992851908086 \tabularnewline
50 & 0.89187830419828 & 0.216243391603441 & 0.108121695801721 \tabularnewline
51 & 0.970283909789696 & 0.0594321804206087 & 0.0297160902103043 \tabularnewline
52 & 0.966751479120626 & 0.0664970417587479 & 0.0332485208793740 \tabularnewline
53 & 0.956620244403278 & 0.086759511193444 & 0.043379755596722 \tabularnewline
\hline
\end{tabular}
%Source: https://freestatistics.org/blog/index.php?pk=67231&T=5

[TABLE]
[ROW][C]Goldfeld-Quandt test for Heteroskedasticity[/C][/ROW]
[ROW][C]p-values[/C][C]Alternative Hypothesis[/C][/ROW]
[ROW][C]breakpoint index[/C][C]greater[/C][C]2-sided[/C][C]less[/C][/ROW]
[ROW][C]6[/C][C]0.0112561925884675[/C][C]0.0225123851769350[/C][C]0.988743807411532[/C][/ROW]
[ROW][C]7[/C][C]0.00187864610064451[/C][C]0.00375729220128901[/C][C]0.998121353899355[/C][/ROW]
[ROW][C]8[/C][C]0.00192330556487978[/C][C]0.00384661112975957[/C][C]0.99807669443512[/C][/ROW]
[ROW][C]9[/C][C]0.000470559354112788[/C][C]0.000941118708225577[/C][C]0.999529440645887[/C][/ROW]
[ROW][C]10[/C][C]0.000113445670160821[/C][C]0.000226891340321642[/C][C]0.99988655432984[/C][/ROW]
[ROW][C]11[/C][C]3.19012077812098e-05[/C][C]6.38024155624197e-05[/C][C]0.999968098792219[/C][/ROW]
[ROW][C]12[/C][C]9.1659266711945e-06[/C][C]1.8331853342389e-05[/C][C]0.999990834073329[/C][/ROW]
[ROW][C]13[/C][C]2.14544409821765e-06[/C][C]4.2908881964353e-06[/C][C]0.999997854555902[/C][/ROW]
[ROW][C]14[/C][C]5.75016070173572e-07[/C][C]1.15003214034714e-06[/C][C]0.99999942498393[/C][/ROW]
[ROW][C]15[/C][C]1.39596006816896e-07[/C][C]2.79192013633791e-07[/C][C]0.999999860403993[/C][/ROW]
[ROW][C]16[/C][C]3.04273871867666e-08[/C][C]6.08547743735332e-08[/C][C]0.999999969572613[/C][/ROW]
[ROW][C]17[/C][C]5.26010318655923e-09[/C][C]1.05202063731185e-08[/C][C]0.999999994739897[/C][/ROW]
[ROW][C]18[/C][C]3.18241273030716e-09[/C][C]6.36482546061432e-09[/C][C]0.999999996817587[/C][/ROW]
[ROW][C]19[/C][C]1.76204553860701e-09[/C][C]3.52409107721402e-09[/C][C]0.999999998237954[/C][/ROW]
[ROW][C]20[/C][C]2.01403204877270e-09[/C][C]4.02806409754541e-09[/C][C]0.999999997985968[/C][/ROW]
[ROW][C]21[/C][C]5.16492348743025e-10[/C][C]1.03298469748605e-09[/C][C]0.999999999483508[/C][/ROW]
[ROW][C]22[/C][C]5.4595341287835e-10[/C][C]1.0919068257567e-09[/C][C]0.999999999454047[/C][/ROW]
[ROW][C]23[/C][C]3.81698545046685e-10[/C][C]7.6339709009337e-10[/C][C]0.999999999618301[/C][/ROW]
[ROW][C]24[/C][C]1.04339420891356e-10[/C][C]2.08678841782713e-10[/C][C]0.99999999989566[/C][/ROW]
[ROW][C]25[/C][C]9.70772999086574e-11[/C][C]1.94154599817315e-10[/C][C]0.999999999902923[/C][/ROW]
[ROW][C]26[/C][C]2.28630121975507e-10[/C][C]4.57260243951013e-10[/C][C]0.99999999977137[/C][/ROW]
[ROW][C]27[/C][C]5.45065724579488e-10[/C][C]1.09013144915898e-09[/C][C]0.999999999454934[/C][/ROW]
[ROW][C]28[/C][C]2.88334709169426e-10[/C][C]5.76669418338851e-10[/C][C]0.999999999711665[/C][/ROW]
[ROW][C]29[/C][C]3.81564707581058e-10[/C][C]7.63129415162116e-10[/C][C]0.999999999618435[/C][/ROW]
[ROW][C]30[/C][C]1.44863815768873e-09[/C][C]2.89727631537746e-09[/C][C]0.999999998551362[/C][/ROW]
[ROW][C]31[/C][C]1.10390692842310e-08[/C][C]2.20781385684621e-08[/C][C]0.99999998896093[/C][/ROW]
[ROW][C]32[/C][C]3.37380789579229e-08[/C][C]6.74761579158459e-08[/C][C]0.999999966261921[/C][/ROW]
[ROW][C]33[/C][C]2.02265922970327e-07[/C][C]4.04531845940654e-07[/C][C]0.999999797734077[/C][/ROW]
[ROW][C]34[/C][C]7.06410413042676e-07[/C][C]1.41282082608535e-06[/C][C]0.999999293589587[/C][/ROW]
[ROW][C]35[/C][C]6.07190627933956e-07[/C][C]1.21438125586791e-06[/C][C]0.999999392809372[/C][/ROW]
[ROW][C]36[/C][C]2.67094607662653e-06[/C][C]5.34189215325305e-06[/C][C]0.999997329053923[/C][/ROW]
[ROW][C]37[/C][C]2.45351208124863e-05[/C][C]4.90702416249726e-05[/C][C]0.999975464879188[/C][/ROW]
[ROW][C]38[/C][C]4.89655028191778e-05[/C][C]9.79310056383556e-05[/C][C]0.99995103449718[/C][/ROW]
[ROW][C]39[/C][C]4.28792476847373e-05[/C][C]8.57584953694745e-05[/C][C]0.999957120752315[/C][/ROW]
[ROW][C]40[/C][C]3.59110748686737e-05[/C][C]7.18221497373473e-05[/C][C]0.999964088925131[/C][/ROW]
[ROW][C]41[/C][C]0.000117376416778554[/C][C]0.000234752833557108[/C][C]0.999882623583221[/C][/ROW]
[ROW][C]42[/C][C]8.1067559388506e-05[/C][C]0.000162135118777012[/C][C]0.999918932440611[/C][/ROW]
[ROW][C]43[/C][C]9.99924346771229e-05[/C][C]0.000199984869354246[/C][C]0.999900007565323[/C][/ROW]
[ROW][C]44[/C][C]0.000156543540395108[/C][C]0.000313087080790216[/C][C]0.999843456459605[/C][/ROW]
[ROW][C]45[/C][C]0.00016667472023652[/C][C]0.00033334944047304[/C][C]0.999833325279764[/C][/ROW]
[ROW][C]46[/C][C]0.000543688507653075[/C][C]0.00108737701530615[/C][C]0.999456311492347[/C][/ROW]
[ROW][C]47[/C][C]0.0118118038172708[/C][C]0.0236236076345415[/C][C]0.98818819618273[/C][/ROW]
[ROW][C]48[/C][C]0.744104109856292[/C][C]0.511791780287417[/C][C]0.255895890143708[/C][/ROW]
[ROW][C]49[/C][C]0.934600714809191[/C][C]0.130798570381617[/C][C]0.0653992851908086[/C][/ROW]
[ROW][C]50[/C][C]0.89187830419828[/C][C]0.216243391603441[/C][C]0.108121695801721[/C][/ROW]
[ROW][C]51[/C][C]0.970283909789696[/C][C]0.0594321804206087[/C][C]0.0297160902103043[/C][/ROW]
[ROW][C]52[/C][C]0.966751479120626[/C][C]0.0664970417587479[/C][C]0.0332485208793740[/C][/ROW]
[ROW][C]53[/C][C]0.956620244403278[/C][C]0.086759511193444[/C][C]0.043379755596722[/C][/ROW]
[/TABLE]
Source: https://freestatistics.org/blog/index.php?pk=67231&T=5

Globally Unique Identifier (entire table): ba.freestatistics.org/blog/index.php?pk=67231&T=5

As an alternative you can also use a QR Code:  

The GUIDs for individual cells are displayed in the table below:

Goldfeld-Quandt test for Heteroskedasticity
p-valuesAlternative Hypothesis
breakpoint indexgreater2-sidedless
60.01125619258846750.02251238517693500.988743807411532
70.001878646100644510.003757292201289010.998121353899355
80.001923305564879780.003846611129759570.99807669443512
90.0004705593541127880.0009411187082255770.999529440645887
100.0001134456701608210.0002268913403216420.99988655432984
113.19012077812098e-056.38024155624197e-050.999968098792219
129.1659266711945e-061.8331853342389e-050.999990834073329
132.14544409821765e-064.2908881964353e-060.999997854555902
145.75016070173572e-071.15003214034714e-060.99999942498393
151.39596006816896e-072.79192013633791e-070.999999860403993
163.04273871867666e-086.08547743735332e-080.999999969572613
175.26010318655923e-091.05202063731185e-080.999999994739897
183.18241273030716e-096.36482546061432e-090.999999996817587
191.76204553860701e-093.52409107721402e-090.999999998237954
202.01403204877270e-094.02806409754541e-090.999999997985968
215.16492348743025e-101.03298469748605e-090.999999999483508
225.4595341287835e-101.0919068257567e-090.999999999454047
233.81698545046685e-107.6339709009337e-100.999999999618301
241.04339420891356e-102.08678841782713e-100.99999999989566
259.70772999086574e-111.94154599817315e-100.999999999902923
262.28630121975507e-104.57260243951013e-100.99999999977137
275.45065724579488e-101.09013144915898e-090.999999999454934
282.88334709169426e-105.76669418338851e-100.999999999711665
293.81564707581058e-107.63129415162116e-100.999999999618435
301.44863815768873e-092.89727631537746e-090.999999998551362
311.10390692842310e-082.20781385684621e-080.99999998896093
323.37380789579229e-086.74761579158459e-080.999999966261921
332.02265922970327e-074.04531845940654e-070.999999797734077
347.06410413042676e-071.41282082608535e-060.999999293589587
356.07190627933956e-071.21438125586791e-060.999999392809372
362.67094607662653e-065.34189215325305e-060.999997329053923
372.45351208124863e-054.90702416249726e-050.999975464879188
384.89655028191778e-059.79310056383556e-050.99995103449718
394.28792476847373e-058.57584953694745e-050.999957120752315
403.59110748686737e-057.18221497373473e-050.999964088925131
410.0001173764167785540.0002347528335571080.999882623583221
428.1067559388506e-050.0001621351187770120.999918932440611
439.99924346771229e-050.0001999848693542460.999900007565323
440.0001565435403951080.0003130870807902160.999843456459605
450.000166674720236520.000333349440473040.999833325279764
460.0005436885076530750.001087377015306150.999456311492347
470.01181180381727080.02362360763454150.98818819618273
480.7441041098562920.5117917802874170.255895890143708
490.9346007148091910.1307985703816170.0653992851908086
500.891878304198280.2162433916034410.108121695801721
510.9702839097896960.05943218042060870.0297160902103043
520.9667514791206260.06649704175874790.0332485208793740
530.9566202444032780.0867595111934440.043379755596722


Meta Analysis of Goldfeld-Quandt test for Heteroskedasticity
Description# significant tests% significant testsOK/NOK
1% type I error level400.833333333333333NOK
5% type I error level420.875NOK
10% type I error level450.9375NOK

\begin{tabular}{lllllllll}
\hline
Meta Analysis of Goldfeld-Quandt test for Heteroskedasticity \tabularnewline
Description & # significant tests & % significant tests & OK/NOK \tabularnewline
1% type I error level & 40 & 0.833333333333333 & NOK \tabularnewline
5% type I error level & 42 & 0.875 & NOK \tabularnewline
10% type I error level & 45 & 0.9375 & NOK \tabularnewline
\hline
\end{tabular}
%Source: https://freestatistics.org/blog/index.php?pk=67231&T=6

[TABLE]
[ROW][C]Meta Analysis of Goldfeld-Quandt test for Heteroskedasticity[/C][/ROW]
[ROW][C]Description[/C][C]# significant tests[/C][C]% significant tests[/C][C]OK/NOK[/C][/ROW]
[ROW][C]1% type I error level[/C][C]40[/C][C]0.833333333333333[/C][C]NOK[/C][/ROW]
[ROW][C]5% type I error level[/C][C]42[/C][C]0.875[/C][C]NOK[/C][/ROW]
[ROW][C]10% type I error level[/C][C]45[/C][C]0.9375[/C][C]NOK[/C][/ROW]
[/TABLE]
Source: https://freestatistics.org/blog/index.php?pk=67231&T=6

Globally Unique Identifier (entire table): ba.freestatistics.org/blog/index.php?pk=67231&T=6

As an alternative you can also use a QR Code:  

The GUIDs for individual cells are displayed in the table below:

Meta Analysis of Goldfeld-Quandt test for Heteroskedasticity
Description# significant tests% significant testsOK/NOK
1% type I error level400.833333333333333NOK
5% type I error level420.875NOK
10% type I error level450.9375NOK


Parameters (Session):
par1 = 1 ; par2 = Do not include Seasonal Dummies ; par3 = Linear Trend ;
Parameters (R input):
par1 = 1 ; par2 = Do not include Seasonal Dummies ; par3 = Linear Trend ;
R code (references can be found in the software module):
library(lattice)
library(lmtest)
n25 <- 25 #minimum number of obs. for Goldfeld-Quandt test
par1 <- as.numeric(par1)
x <- t(y)
k <- length(x[1,])
n <- length(x[,1])
x1 <- cbind(x[,par1], x[,1:k!=par1])
mycolnames <- c(colnames(x)[par1], colnames(x)[1:k!=par1])
colnames(x1) <- mycolnames #colnames(x)[par1]
x <- x1
if (par3 == 'First Differences'){
x2 <- array(0, dim=c(n-1,k), dimnames=list(1:(n-1), paste('(1-B)',colnames(x),sep='')))
for (i in 1:n-1) {
for (j in 1:k) {
x2[i,j] <- x[i+1,j] - x[i,j]
}
}
x <- x2
}
if (par2 == 'Include Monthly Dummies'){
x2 <- array(0, dim=c(n,11), dimnames=list(1:n, paste('M', seq(1:11), sep ='')))
for (i in 1:11){
x2[seq(i,n,12),i] <- 1
}
x <- cbind(x, x2)
}
if (par2 == 'Include Quarterly Dummies'){
x2 <- array(0, dim=c(n,3), dimnames=list(1:n, paste('Q', seq(1:3), sep ='')))
for (i in 1:3){
x2[seq(i,n,4),i] <- 1
}
x <- cbind(x, x2)
}
k <- length(x[1,])
if (par3 == 'Linear Trend'){
x <- cbind(x, c(1:n))
colnames(x)[k+1] <- 't'
}
x
k <- length(x[1,])
df <- as.data.frame(x)
(mylm <- lm(df))
(mysum <- summary(mylm))
if (n > n25) {
kp3 <- k + 3
nmkm3 <- n - k - 3
gqarr <- array(NA, dim=c(nmkm3-kp3+1,3))
numgqtests <- 0
numsignificant1 <- 0
numsignificant5 <- 0
numsignificant10 <- 0
for (mypoint in kp3:nmkm3) {
j <- 0
numgqtests <- numgqtests + 1
for (myalt in c('greater', 'two.sided', 'less')) {
j <- j + 1
gqarr[mypoint-kp3+1,j] <- gqtest(mylm, point=mypoint, alternative=myalt)$p.value
}
if (gqarr[mypoint-kp3+1,2] < 0.01) numsignificant1 <- numsignificant1 + 1
if (gqarr[mypoint-kp3+1,2] < 0.05) numsignificant5 <- numsignificant5 + 1
if (gqarr[mypoint-kp3+1,2] < 0.10) numsignificant10 <- numsignificant10 + 1
}
gqarr
}
bitmap(file='test0.png')
plot(x[,1], type='l', main='Actuals and Interpolation', ylab='value of Actuals and Interpolation (dots)', xlab='time or index')
points(x[,1]-mysum$resid)
grid()
dev.off()
bitmap(file='test1.png')
plot(mysum$resid, type='b', pch=19, main='Residuals', ylab='value of Residuals', xlab='time or index')
grid()
dev.off()
bitmap(file='test2.png')
hist(mysum$resid, main='Residual Histogram', xlab='values of Residuals')
grid()
dev.off()
bitmap(file='test3.png')
densityplot(~mysum$resid,col='black',main='Residual Density Plot', xlab='values of Residuals')
dev.off()
bitmap(file='test4.png')
qqnorm(mysum$resid, main='Residual Normal Q-Q Plot')
qqline(mysum$resid)
grid()
dev.off()
(myerror <- as.ts(mysum$resid))
bitmap(file='test5.png')
dum <- cbind(lag(myerror,k=1),myerror)
dum
dum1 <- dum[2:length(myerror),]
dum1
z <- as.data.frame(dum1)
z
plot(z,main=paste('Residual Lag plot, lowess, and regression line'), ylab='values of Residuals', xlab='lagged values of Residuals')
lines(lowess(z))
abline(lm(z))
grid()
dev.off()
bitmap(file='test6.png')
acf(mysum$resid, lag.max=length(mysum$resid)/2, main='Residual Autocorrelation Function')
grid()
dev.off()
bitmap(file='test7.png')
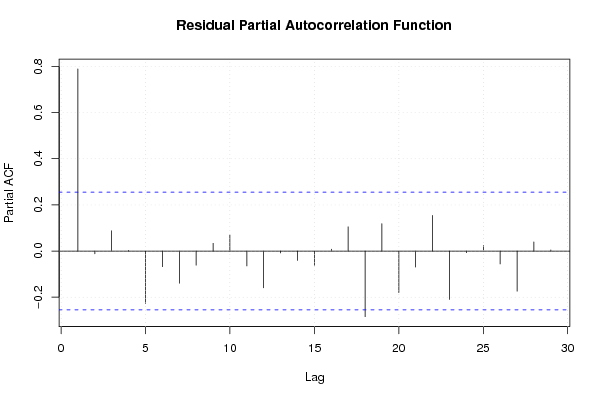
pacf(mysum$resid, lag.max=length(mysum$resid)/2, main='Residual Partial Autocorrelation Function')
grid()
dev.off()
bitmap(file='test8.png')
opar <- par(mfrow = c(2,2), oma = c(0, 0, 1.1, 0))
plot(mylm, las = 1, sub='Residual Diagnostics')
par(opar)
dev.off()
if (n > n25) {
bitmap(file='test9.png')
plot(kp3:nmkm3,gqarr[,2], main='Goldfeld-Quandt test',ylab='2-sided p-value',xlab='breakpoint')
grid()
dev.off()
}
load(file='createtable')
a<-table.start()
a<-table.row.start(a)
a<-table.element(a, 'Multiple Linear Regression - Estimated Regression Equation', 1, TRUE)
a<-table.row.end(a)
myeq <- colnames(x)[1]
myeq <- paste(myeq, '[t] = ', sep='')
for (i in 1:k){
if (mysum$coefficients[i,1] > 0) myeq <- paste(myeq, '+', '')
myeq <- paste(myeq, mysum$coefficients[i,1], sep=' ')
if (rownames(mysum$coefficients)[i] != '(Intercept)') {
myeq <- paste(myeq, rownames(mysum$coefficients)[i], sep='')
if (rownames(mysum$coefficients)[i] != 't') myeq <- paste(myeq, '[t]', sep='')
}
}
myeq <- paste(myeq, ' + e[t]')
a<-table.row.start(a)
a<-table.element(a, myeq)
a<-table.row.end(a)
a<-table.end(a)
table.save(a,file='mytable1.tab')
a<-table.start()
a<-table.row.start(a)
a<-table.element(a,hyperlink('ols1.htm','Multiple Linear Regression - Ordinary Least Squares',''), 6, TRUE)
a<-table.row.end(a)
a<-table.row.start(a)
a<-table.element(a,'Variable',header=TRUE)
a<-table.element(a,'Parameter',header=TRUE)
a<-table.element(a,'S.D.',header=TRUE)
a<-table.element(a,'T-STAT
H0: parameter = 0',header=TRUE)
a<-table.element(a,'2-tail p-value',header=TRUE)
a<-table.element(a,'1-tail p-value',header=TRUE)
a<-table.row.end(a)
for (i in 1:k){
a<-table.row.start(a)
a<-table.element(a,rownames(mysum$coefficients)[i],header=TRUE)
a<-table.element(a,mysum$coefficients[i,1])
a<-table.element(a, round(mysum$coefficients[i,2],6))
a<-table.element(a, round(mysum$coefficients[i,3],4))
a<-table.element(a, round(mysum$coefficients[i,4],6))
a<-table.element(a, round(mysum$coefficients[i,4]/2,6))
a<-table.row.end(a)
}
a<-table.end(a)
table.save(a,file='mytable2.tab')
a<-table.start()
a<-table.row.start(a)
a<-table.element(a, 'Multiple Linear Regression - Regression Statistics', 2, TRUE)
a<-table.row.end(a)
a<-table.row.start(a)
a<-table.element(a, 'Multiple R',1,TRUE)
a<-table.element(a, sqrt(mysum$r.squared))
a<-table.row.end(a)
a<-table.row.start(a)
a<-table.element(a, 'R-squared',1,TRUE)
a<-table.element(a, mysum$r.squared)
a<-table.row.end(a)
a<-table.row.start(a)
a<-table.element(a, 'Adjusted R-squared',1,TRUE)
a<-table.element(a, mysum$adj.r.squared)
a<-table.row.end(a)
a<-table.row.start(a)
a<-table.element(a, 'F-TEST (value)',1,TRUE)
a<-table.element(a, mysum$fstatistic[1])
a<-table.row.end(a)
a<-table.row.start(a)
a<-table.element(a, 'F-TEST (DF numerator)',1,TRUE)
a<-table.element(a, mysum$fstatistic[2])
a<-table.row.end(a)
a<-table.row.start(a)
a<-table.element(a, 'F-TEST (DF denominator)',1,TRUE)
a<-table.element(a, mysum$fstatistic[3])
a<-table.row.end(a)
a<-table.row.start(a)
a<-table.element(a, 'p-value',1,TRUE)
a<-table.element(a, 1-pf(mysum$fstatistic[1],mysum$fstatistic[2],mysum$fstatistic[3]))
a<-table.row.end(a)
a<-table.row.start(a)
a<-table.element(a, 'Multiple Linear Regression - Residual Statistics', 2, TRUE)
a<-table.row.end(a)
a<-table.row.start(a)
a<-table.element(a, 'Residual Standard Deviation',1,TRUE)
a<-table.element(a, mysum$sigma)
a<-table.row.end(a)
a<-table.row.start(a)
a<-table.element(a, 'Sum Squared Residuals',1,TRUE)
a<-table.element(a, sum(myerror*myerror))
a<-table.row.end(a)
a<-table.end(a)
table.save(a,file='mytable3.tab')
a<-table.start()
a<-table.row.start(a)
a<-table.element(a, 'Multiple Linear Regression - Actuals, Interpolation, and Residuals', 4, TRUE)
a<-table.row.end(a)
a<-table.row.start(a)
a<-table.element(a, 'Time or Index', 1, TRUE)
a<-table.element(a, 'Actuals', 1, TRUE)
a<-table.element(a, 'Interpolation
Forecast', 1, TRUE)
a<-table.element(a, 'Residuals
Prediction Error', 1, TRUE)
a<-table.row.end(a)
for (i in 1:n) {
a<-table.row.start(a)
a<-table.element(a,i, 1, TRUE)
a<-table.element(a,x[i])
a<-table.element(a,x[i]-mysum$resid[i])
a<-table.element(a,mysum$resid[i])
a<-table.row.end(a)
}
a<-table.end(a)
table.save(a,file='mytable4.tab')
if (n > n25) {
a<-table.start()
a<-table.row.start(a)
a<-table.element(a,'Goldfeld-Quandt test for Heteroskedasticity',4,TRUE)
a<-table.row.end(a)
a<-table.row.start(a)
a<-table.element(a,'p-values',header=TRUE)
a<-table.element(a,'Alternative Hypothesis',3,header=TRUE)
a<-table.row.end(a)
a<-table.row.start(a)
a<-table.element(a,'breakpoint index',header=TRUE)
a<-table.element(a,'greater',header=TRUE)
a<-table.element(a,'2-sided',header=TRUE)
a<-table.element(a,'less',header=TRUE)
a<-table.row.end(a)
for (mypoint in kp3:nmkm3) {
a<-table.row.start(a)
a<-table.element(a,mypoint,header=TRUE)
a<-table.element(a,gqarr[mypoint-kp3+1,1])
a<-table.element(a,gqarr[mypoint-kp3+1,2])
a<-table.element(a,gqarr[mypoint-kp3+1,3])
a<-table.row.end(a)
}
a<-table.end(a)
table.save(a,file='mytable5.tab')
a<-table.start()
a<-table.row.start(a)
a<-table.element(a,'Meta Analysis of Goldfeld-Quandt test for Heteroskedasticity',4,TRUE)
a<-table.row.end(a)
a<-table.row.start(a)
a<-table.element(a,'Description',header=TRUE)
a<-table.element(a,'# significant tests',header=TRUE)
a<-table.element(a,'% significant tests',header=TRUE)
a<-table.element(a,'OK/NOK',header=TRUE)
a<-table.row.end(a)
a<-table.row.start(a)
a<-table.element(a,'1% type I error level',header=TRUE)
a<-table.element(a,numsignificant1)
a<-table.element(a,numsignificant1/numgqtests)
if (numsignificant1/numgqtests < 0.01) dum <- 'OK' else dum <- 'NOK'
a<-table.element(a,dum)
a<-table.row.end(a)
a<-table.row.start(a)
a<-table.element(a,'5% type I error level',header=TRUE)
a<-table.element(a,numsignificant5)
a<-table.element(a,numsignificant5/numgqtests)
if (numsignificant5/numgqtests < 0.05) dum <- 'OK' else dum <- 'NOK'
a<-table.element(a,dum)
a<-table.row.end(a)
a<-table.row.start(a)
a<-table.element(a,'10% type I error level',header=TRUE)
a<-table.element(a,numsignificant10)
a<-table.element(a,numsignificant10/numgqtests)
if (numsignificant10/numgqtests < 0.1) dum <- 'OK' else dum <- 'NOK'
a<-table.element(a,dum)
a<-table.row.end(a)
a<-table.end(a)
table.save(a,file='mytable6.tab')
}