Free Statistics

of Irreproducible Research!

Author's title

Author*The author of this computation has been verified*
R Software Modulerwasp_summary1.wasp
Title produced by softwareUnivariate Summary Statistics
Date of computationSun, 13 Dec 2009 05:04:55 -0700
Cite this page as followsStatistical Computations at FreeStatistics.org, Office for Research Development and Education, URL https://freestatistics.org/blog/index.php?v=date/2009/Dec/13/t1260705973xaxq6rcevpvc4ta.htm/, Retrieved Sun, 28 Apr 2024 13:57:44 +0000
Statistical Computations at FreeStatistics.org, Office for Research Development and Education, URL https://freestatistics.org/blog/index.php?pk=67232, Retrieved Sun, 28 Apr 2024 13:57:44 +0000
QR Codes:

Original text written by user:
IsPrivate?No (this computation is public)
User-defined keywordspaper
Estimated Impact105
Family? (F = Feedback message, R = changed R code, M = changed R Module, P = changed Parameters, D = changed Data)
-       [Univariate Summary Statistics] [Summary univariate] [2009-12-13 12:04:55] [e7a989b306049c061a54f626f1127c12] [Current]
Feedback Forum

Post a new message
Dataseries X:
125.9
133.1
147
145.8
164.4
149.8
137.7
151.7
156.8
180
180.4
170.4
191.6
199.5
218.2
217.5
205
194
199.3
219.3
211.1
215.2
240.2
242.2
240.7
255.4
253
218.2
203.7
205.6
215.6
188.5
202.9
214
230.3
230
241
259.6
247.8
270.3
289.7
322.7
315
320.2
329.5
360.6
382.2
435.4
464
468.8
403
351.6
252
188
146.5
152.9
148.1
165.1
177
206.1


Summary of computational transaction
Raw Inputview raw input (R code)
Raw Outputview raw output of R engine
Computing time1 seconds
R Server'Gwilym Jenkins' @ 72.249.127.135

\begin{tabular}{lllllllll}
\hline
Summary of computational transaction \tabularnewline
Raw Input & view raw input (R code)  \tabularnewline
Raw Output & view raw output of R engine  \tabularnewline
Computing time & 1 seconds \tabularnewline
R Server & 'Gwilym Jenkins' @ 72.249.127.135 \tabularnewline
\hline
\end{tabular}
%Source: https://freestatistics.org/blog/index.php?pk=67232&T=0

[TABLE]
[ROW][C]Summary of computational transaction[/C][/ROW]
[ROW][C]Raw Input[/C][C]view raw input (R code) [/C][/ROW]
[ROW][C]Raw Output[/C][C]view raw output of R engine [/C][/ROW]
[ROW][C]Computing time[/C][C]1 seconds[/C][/ROW]
[ROW][C]R Server[/C][C]'Gwilym Jenkins' @ 72.249.127.135[/C][/ROW]
[/TABLE]
Source: https://freestatistics.org/blog/index.php?pk=67232&T=0

Globally Unique Identifier (entire table): ba.freestatistics.org/blog/index.php?pk=67232&T=0

As an alternative you can also use a QR Code:  

The GUIDs for individual cells are displayed in the table below:

Summary of computational transaction
Raw Inputview raw input (R code)
Raw Outputview raw output of R engine
Computing time1 seconds
R Server'Gwilym Jenkins' @ 72.249.127.135


Central Tendency - Ungrouped Data
MeasureValueS.E.Value/S.E.
Arithmetic Mean232.51833333333310.549208739884922.0413055677074
Geometric Mean220.520661596011
Harmonic Mean210.326474891660
Quadratic Mean246.232893483656
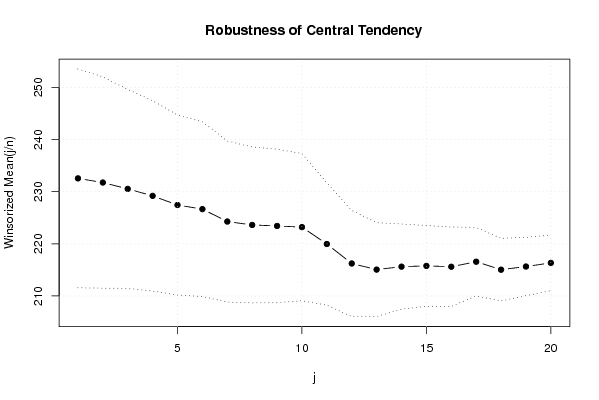
Winsorized Mean ( 1 / 20 )232.55833333333310.499164963208822.1501742422627
Winsorized Mean ( 2 / 20 )231.75833333333310.134070267119122.8692250225749
Winsorized Mean ( 3 / 20 )230.5433333333339.547001885902024.1482442434389
Winsorized Mean ( 4 / 20 )229.2033333333339.1303739586741725.103389452694
Winsorized Mean ( 5 / 20 )227.4458.6324075453055726.3478060791613
Winsorized Mean ( 6 / 20 )226.6558.383609050177327.0354925478314
Winsorized Mean ( 7 / 20 )224.2757.7273487552530429.0235379692858
Winsorized Mean ( 8 / 20 )223.6216666666677.4795552194366929.8977225391095
Winsorized Mean ( 9 / 20 )223.4266666666677.3664332094817230.3303729651797
Winsorized Mean ( 10 / 20 )223.217.0700676844105931.5711263262975
Winsorized Mean ( 11 / 20 )219.9655.865739281316937.4999619742076
Winsorized Mean ( 12 / 20 )216.2255.1001620806193642.3957114660446
Winsorized Mean ( 13 / 20 )215.0554.5024779273057847.7636988947298
Winsorized Mean ( 14 / 20 )215.6154.0863288850828152.7649648531974
Winsorized Mean ( 15 / 20 )215.7653.8690206829632955.7673420951436
Winsorized Mean ( 16 / 20 )215.6053.8089660985775456.604599363727
Winsorized Mean ( 17 / 20 )216.5683333333333.2888722601948965.8488126627635
Winsorized Mean ( 18 / 20 )215.0383333333333.0023080496903471.6243402656542
Winsorized Mean ( 19 / 20 )215.642.7989346237896677.0436001495564
Winsorized Mean ( 20 / 20 )216.342.6684981704838681.0718187454379
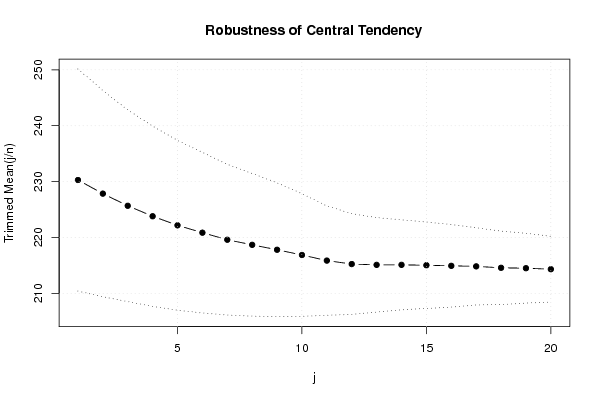
Trimmed Mean ( 1 / 20 )230.2827586206909.937271233900723.1736412542597
Trimmed Mean ( 2 / 20 )227.8446428571439.2241963432864524.7007581341189
Trimmed Mean ( 3 / 20 )225.6703703703708.5782396722416726.3073053438478
Trimmed Mean ( 4 / 20 )223.7961538461548.0673064024361827.7411248168994
Trimmed Mean ( 5 / 20 )222.1747.5969359075665229.2452118463597
Trimmed Mean ( 6 / 20 )220.856257.1861543798974930.7335799266743
Trimmed Mean ( 7 / 20 )219.5956521739136.7402167115791332.5799097522586
Trimmed Mean ( 8 / 20 )218.6840909090916.381718524290734.2672730043976
Trimmed Mean ( 9 / 20 )217.8023809523815.9865989407034836.3816556127589
Trimmed Mean ( 10 / 20 )216.8655.4879034224700939.5169126176768
Trimmed Mean ( 11 / 20 )215.8631578947374.8962368646342744.0875643606881
Trimmed Mean ( 12 / 20 )215.2416666666674.5067839076747647.7594823883444
Trimmed Mean ( 13 / 20 )215.0970588235294.2268210017274050.8886131529167
Trimmed Mean ( 14 / 20 )215.1031254.0245378525882153.4479070340128
Trimmed Mean ( 15 / 20 )215.033.8642902427819555.6454061393684
Trimmed Mean ( 16 / 20 )214.9253.6951191351944858.1645657789293
Trimmed Mean ( 17 / 20 )214.8269230769233.4542217544613662.1925684995354
Trimmed Mean ( 18 / 20 )214.5708333333333.2823334707620865.3714301866822
Trimmed Mean ( 19 / 20 )214.53.1222979660411368.699400996623
Trimmed Mean ( 20 / 20 )214.322.9364371537451272.9864079422429
Median214.6
Midrange297.35
Midmean - Weighted Average at Xnp213.803225806452
Midmean - Weighted Average at X(n+1)p215.03
Midmean - Empirical Distribution Function213.803225806452
Midmean - Empirical Distribution Function - Averaging215.03
Midmean - Empirical Distribution Function - Interpolation215.03
Midmean - Closest Observation213.803225806452
Midmean - True Basic - Statistics Graphics Toolkit215.03
Midmean - MS Excel (old versions)215.103125
Number of observations60

\begin{tabular}{lllllllll}
\hline
Central Tendency - Ungrouped Data \tabularnewline
Measure & Value & S.E. & Value/S.E. \tabularnewline
Arithmetic Mean & 232.518333333333 & 10.5492087398849 & 22.0413055677074 \tabularnewline
Geometric Mean & 220.520661596011 &  &  \tabularnewline
Harmonic Mean & 210.326474891660 &  &  \tabularnewline
Quadratic Mean & 246.232893483656 &  &  \tabularnewline
Winsorized Mean ( 1 / 20 ) & 232.558333333333 & 10.4991649632088 & 22.1501742422627 \tabularnewline
Winsorized Mean ( 2 / 20 ) & 231.758333333333 & 10.1340702671191 & 22.8692250225749 \tabularnewline
Winsorized Mean ( 3 / 20 ) & 230.543333333333 & 9.5470018859020 & 24.1482442434389 \tabularnewline
Winsorized Mean ( 4 / 20 ) & 229.203333333333 & 9.13037395867417 & 25.103389452694 \tabularnewline
Winsorized Mean ( 5 / 20 ) & 227.445 & 8.63240754530557 & 26.3478060791613 \tabularnewline
Winsorized Mean ( 6 / 20 ) & 226.655 & 8.3836090501773 & 27.0354925478314 \tabularnewline
Winsorized Mean ( 7 / 20 ) & 224.275 & 7.72734875525304 & 29.0235379692858 \tabularnewline
Winsorized Mean ( 8 / 20 ) & 223.621666666667 & 7.47955521943669 & 29.8977225391095 \tabularnewline
Winsorized Mean ( 9 / 20 ) & 223.426666666667 & 7.36643320948172 & 30.3303729651797 \tabularnewline
Winsorized Mean ( 10 / 20 ) & 223.21 & 7.07006768441059 & 31.5711263262975 \tabularnewline
Winsorized Mean ( 11 / 20 ) & 219.965 & 5.8657392813169 & 37.4999619742076 \tabularnewline
Winsorized Mean ( 12 / 20 ) & 216.225 & 5.10016208061936 & 42.3957114660446 \tabularnewline
Winsorized Mean ( 13 / 20 ) & 215.055 & 4.50247792730578 & 47.7636988947298 \tabularnewline
Winsorized Mean ( 14 / 20 ) & 215.615 & 4.08632888508281 & 52.7649648531974 \tabularnewline
Winsorized Mean ( 15 / 20 ) & 215.765 & 3.86902068296329 & 55.7673420951436 \tabularnewline
Winsorized Mean ( 16 / 20 ) & 215.605 & 3.80896609857754 & 56.604599363727 \tabularnewline
Winsorized Mean ( 17 / 20 ) & 216.568333333333 & 3.28887226019489 & 65.8488126627635 \tabularnewline
Winsorized Mean ( 18 / 20 ) & 215.038333333333 & 3.00230804969034 & 71.6243402656542 \tabularnewline
Winsorized Mean ( 19 / 20 ) & 215.64 & 2.79893462378966 & 77.0436001495564 \tabularnewline
Winsorized Mean ( 20 / 20 ) & 216.34 & 2.66849817048386 & 81.0718187454379 \tabularnewline
Trimmed Mean ( 1 / 20 ) & 230.282758620690 & 9.9372712339007 & 23.1736412542597 \tabularnewline
Trimmed Mean ( 2 / 20 ) & 227.844642857143 & 9.22419634328645 & 24.7007581341189 \tabularnewline
Trimmed Mean ( 3 / 20 ) & 225.670370370370 & 8.57823967224167 & 26.3073053438478 \tabularnewline
Trimmed Mean ( 4 / 20 ) & 223.796153846154 & 8.06730640243618 & 27.7411248168994 \tabularnewline
Trimmed Mean ( 5 / 20 ) & 222.174 & 7.59693590756652 & 29.2452118463597 \tabularnewline
Trimmed Mean ( 6 / 20 ) & 220.85625 & 7.18615437989749 & 30.7335799266743 \tabularnewline
Trimmed Mean ( 7 / 20 ) & 219.595652173913 & 6.74021671157913 & 32.5799097522586 \tabularnewline
Trimmed Mean ( 8 / 20 ) & 218.684090909091 & 6.3817185242907 & 34.2672730043976 \tabularnewline
Trimmed Mean ( 9 / 20 ) & 217.802380952381 & 5.98659894070348 & 36.3816556127589 \tabularnewline
Trimmed Mean ( 10 / 20 ) & 216.865 & 5.48790342247009 & 39.5169126176768 \tabularnewline
Trimmed Mean ( 11 / 20 ) & 215.863157894737 & 4.89623686463427 & 44.0875643606881 \tabularnewline
Trimmed Mean ( 12 / 20 ) & 215.241666666667 & 4.50678390767476 & 47.7594823883444 \tabularnewline
Trimmed Mean ( 13 / 20 ) & 215.097058823529 & 4.22682100172740 & 50.8886131529167 \tabularnewline
Trimmed Mean ( 14 / 20 ) & 215.103125 & 4.02453785258821 & 53.4479070340128 \tabularnewline
Trimmed Mean ( 15 / 20 ) & 215.03 & 3.86429024278195 & 55.6454061393684 \tabularnewline
Trimmed Mean ( 16 / 20 ) & 214.925 & 3.69511913519448 & 58.1645657789293 \tabularnewline
Trimmed Mean ( 17 / 20 ) & 214.826923076923 & 3.45422175446136 & 62.1925684995354 \tabularnewline
Trimmed Mean ( 18 / 20 ) & 214.570833333333 & 3.28233347076208 & 65.3714301866822 \tabularnewline
Trimmed Mean ( 19 / 20 ) & 214.5 & 3.12229796604113 & 68.699400996623 \tabularnewline
Trimmed Mean ( 20 / 20 ) & 214.32 & 2.93643715374512 & 72.9864079422429 \tabularnewline
Median & 214.6 &  &  \tabularnewline
Midrange & 297.35 &  &  \tabularnewline
Midmean - Weighted Average at Xnp & 213.803225806452 &  &  \tabularnewline
Midmean - Weighted Average at X(n+1)p & 215.03 &  &  \tabularnewline
Midmean - Empirical Distribution Function & 213.803225806452 &  &  \tabularnewline
Midmean - Empirical Distribution Function - Averaging & 215.03 &  &  \tabularnewline
Midmean - Empirical Distribution Function - Interpolation & 215.03 &  &  \tabularnewline
Midmean - Closest Observation & 213.803225806452 &  &  \tabularnewline
Midmean - True Basic - Statistics Graphics Toolkit & 215.03 &  &  \tabularnewline
Midmean - MS Excel (old versions) & 215.103125 &  &  \tabularnewline
Number of observations & 60 &  &  \tabularnewline
\hline
\end{tabular}
%Source: https://freestatistics.org/blog/index.php?pk=67232&T=1

[TABLE]
[ROW][C]Central Tendency - Ungrouped Data[/C][/ROW]
[ROW][C]Measure[/C][C]Value[/C][C]S.E.[/C][C]Value/S.E.[/C][/ROW]
[ROW][C]Arithmetic Mean[/C][C]232.518333333333[/C][C]10.5492087398849[/C][C]22.0413055677074[/C][/ROW]
[ROW][C]Geometric Mean[/C][C]220.520661596011[/C][C][/C][C][/C][/ROW]
[ROW][C]Harmonic Mean[/C][C]210.326474891660[/C][C][/C][C][/C][/ROW]
[ROW][C]Quadratic Mean[/C][C]246.232893483656[/C][C][/C][C][/C][/ROW]
[ROW][C]Winsorized Mean ( 1 / 20 )[/C][C]232.558333333333[/C][C]10.4991649632088[/C][C]22.1501742422627[/C][/ROW]
[ROW][C]Winsorized Mean ( 2 / 20 )[/C][C]231.758333333333[/C][C]10.1340702671191[/C][C]22.8692250225749[/C][/ROW]
[ROW][C]Winsorized Mean ( 3 / 20 )[/C][C]230.543333333333[/C][C]9.5470018859020[/C][C]24.1482442434389[/C][/ROW]
[ROW][C]Winsorized Mean ( 4 / 20 )[/C][C]229.203333333333[/C][C]9.13037395867417[/C][C]25.103389452694[/C][/ROW]
[ROW][C]Winsorized Mean ( 5 / 20 )[/C][C]227.445[/C][C]8.63240754530557[/C][C]26.3478060791613[/C][/ROW]
[ROW][C]Winsorized Mean ( 6 / 20 )[/C][C]226.655[/C][C]8.3836090501773[/C][C]27.0354925478314[/C][/ROW]
[ROW][C]Winsorized Mean ( 7 / 20 )[/C][C]224.275[/C][C]7.72734875525304[/C][C]29.0235379692858[/C][/ROW]
[ROW][C]Winsorized Mean ( 8 / 20 )[/C][C]223.621666666667[/C][C]7.47955521943669[/C][C]29.8977225391095[/C][/ROW]
[ROW][C]Winsorized Mean ( 9 / 20 )[/C][C]223.426666666667[/C][C]7.36643320948172[/C][C]30.3303729651797[/C][/ROW]
[ROW][C]Winsorized Mean ( 10 / 20 )[/C][C]223.21[/C][C]7.07006768441059[/C][C]31.5711263262975[/C][/ROW]
[ROW][C]Winsorized Mean ( 11 / 20 )[/C][C]219.965[/C][C]5.8657392813169[/C][C]37.4999619742076[/C][/ROW]
[ROW][C]Winsorized Mean ( 12 / 20 )[/C][C]216.225[/C][C]5.10016208061936[/C][C]42.3957114660446[/C][/ROW]
[ROW][C]Winsorized Mean ( 13 / 20 )[/C][C]215.055[/C][C]4.50247792730578[/C][C]47.7636988947298[/C][/ROW]
[ROW][C]Winsorized Mean ( 14 / 20 )[/C][C]215.615[/C][C]4.08632888508281[/C][C]52.7649648531974[/C][/ROW]
[ROW][C]Winsorized Mean ( 15 / 20 )[/C][C]215.765[/C][C]3.86902068296329[/C][C]55.7673420951436[/C][/ROW]
[ROW][C]Winsorized Mean ( 16 / 20 )[/C][C]215.605[/C][C]3.80896609857754[/C][C]56.604599363727[/C][/ROW]
[ROW][C]Winsorized Mean ( 17 / 20 )[/C][C]216.568333333333[/C][C]3.28887226019489[/C][C]65.8488126627635[/C][/ROW]
[ROW][C]Winsorized Mean ( 18 / 20 )[/C][C]215.038333333333[/C][C]3.00230804969034[/C][C]71.6243402656542[/C][/ROW]
[ROW][C]Winsorized Mean ( 19 / 20 )[/C][C]215.64[/C][C]2.79893462378966[/C][C]77.0436001495564[/C][/ROW]
[ROW][C]Winsorized Mean ( 20 / 20 )[/C][C]216.34[/C][C]2.66849817048386[/C][C]81.0718187454379[/C][/ROW]
[ROW][C]Trimmed Mean ( 1 / 20 )[/C][C]230.282758620690[/C][C]9.9372712339007[/C][C]23.1736412542597[/C][/ROW]
[ROW][C]Trimmed Mean ( 2 / 20 )[/C][C]227.844642857143[/C][C]9.22419634328645[/C][C]24.7007581341189[/C][/ROW]
[ROW][C]Trimmed Mean ( 3 / 20 )[/C][C]225.670370370370[/C][C]8.57823967224167[/C][C]26.3073053438478[/C][/ROW]
[ROW][C]Trimmed Mean ( 4 / 20 )[/C][C]223.796153846154[/C][C]8.06730640243618[/C][C]27.7411248168994[/C][/ROW]
[ROW][C]Trimmed Mean ( 5 / 20 )[/C][C]222.174[/C][C]7.59693590756652[/C][C]29.2452118463597[/C][/ROW]
[ROW][C]Trimmed Mean ( 6 / 20 )[/C][C]220.85625[/C][C]7.18615437989749[/C][C]30.7335799266743[/C][/ROW]
[ROW][C]Trimmed Mean ( 7 / 20 )[/C][C]219.595652173913[/C][C]6.74021671157913[/C][C]32.5799097522586[/C][/ROW]
[ROW][C]Trimmed Mean ( 8 / 20 )[/C][C]218.684090909091[/C][C]6.3817185242907[/C][C]34.2672730043976[/C][/ROW]
[ROW][C]Trimmed Mean ( 9 / 20 )[/C][C]217.802380952381[/C][C]5.98659894070348[/C][C]36.3816556127589[/C][/ROW]
[ROW][C]Trimmed Mean ( 10 / 20 )[/C][C]216.865[/C][C]5.48790342247009[/C][C]39.5169126176768[/C][/ROW]
[ROW][C]Trimmed Mean ( 11 / 20 )[/C][C]215.863157894737[/C][C]4.89623686463427[/C][C]44.0875643606881[/C][/ROW]
[ROW][C]Trimmed Mean ( 12 / 20 )[/C][C]215.241666666667[/C][C]4.50678390767476[/C][C]47.7594823883444[/C][/ROW]
[ROW][C]Trimmed Mean ( 13 / 20 )[/C][C]215.097058823529[/C][C]4.22682100172740[/C][C]50.8886131529167[/C][/ROW]
[ROW][C]Trimmed Mean ( 14 / 20 )[/C][C]215.103125[/C][C]4.02453785258821[/C][C]53.4479070340128[/C][/ROW]
[ROW][C]Trimmed Mean ( 15 / 20 )[/C][C]215.03[/C][C]3.86429024278195[/C][C]55.6454061393684[/C][/ROW]
[ROW][C]Trimmed Mean ( 16 / 20 )[/C][C]214.925[/C][C]3.69511913519448[/C][C]58.1645657789293[/C][/ROW]
[ROW][C]Trimmed Mean ( 17 / 20 )[/C][C]214.826923076923[/C][C]3.45422175446136[/C][C]62.1925684995354[/C][/ROW]
[ROW][C]Trimmed Mean ( 18 / 20 )[/C][C]214.570833333333[/C][C]3.28233347076208[/C][C]65.3714301866822[/C][/ROW]
[ROW][C]Trimmed Mean ( 19 / 20 )[/C][C]214.5[/C][C]3.12229796604113[/C][C]68.699400996623[/C][/ROW]
[ROW][C]Trimmed Mean ( 20 / 20 )[/C][C]214.32[/C][C]2.93643715374512[/C][C]72.9864079422429[/C][/ROW]
[ROW][C]Median[/C][C]214.6[/C][C][/C][C][/C][/ROW]
[ROW][C]Midrange[/C][C]297.35[/C][C][/C][C][/C][/ROW]
[ROW][C]Midmean - Weighted Average at Xnp[/C][C]213.803225806452[/C][C][/C][C][/C][/ROW]
[ROW][C]Midmean - Weighted Average at X(n+1)p[/C][C]215.03[/C][C][/C][C][/C][/ROW]
[ROW][C]Midmean - Empirical Distribution Function[/C][C]213.803225806452[/C][C][/C][C][/C][/ROW]
[ROW][C]Midmean - Empirical Distribution Function - Averaging[/C][C]215.03[/C][C][/C][C][/C][/ROW]
[ROW][C]Midmean - Empirical Distribution Function - Interpolation[/C][C]215.03[/C][C][/C][C][/C][/ROW]
[ROW][C]Midmean - Closest Observation[/C][C]213.803225806452[/C][C][/C][C][/C][/ROW]
[ROW][C]Midmean - True Basic - Statistics Graphics Toolkit[/C][C]215.03[/C][C][/C][C][/C][/ROW]
[ROW][C]Midmean - MS Excel (old versions)[/C][C]215.103125[/C][C][/C][C][/C][/ROW]
[ROW][C]Number of observations[/C][C]60[/C][C][/C][C][/C][/ROW]
[/TABLE]
Source: https://freestatistics.org/blog/index.php?pk=67232&T=1

Globally Unique Identifier (entire table): ba.freestatistics.org/blog/index.php?pk=67232&T=1

As an alternative you can also use a QR Code:  

The GUIDs for individual cells are displayed in the table below:

Central Tendency - Ungrouped Data
MeasureValueS.E.Value/S.E.
Arithmetic Mean232.51833333333310.549208739884922.0413055677074
Geometric Mean220.520661596011
Harmonic Mean210.326474891660
Quadratic Mean246.232893483656
Winsorized Mean ( 1 / 20 )232.55833333333310.499164963208822.1501742422627
Winsorized Mean ( 2 / 20 )231.75833333333310.134070267119122.8692250225749
Winsorized Mean ( 3 / 20 )230.5433333333339.547001885902024.1482442434389
Winsorized Mean ( 4 / 20 )229.2033333333339.1303739586741725.103389452694
Winsorized Mean ( 5 / 20 )227.4458.6324075453055726.3478060791613
Winsorized Mean ( 6 / 20 )226.6558.383609050177327.0354925478314
Winsorized Mean ( 7 / 20 )224.2757.7273487552530429.0235379692858
Winsorized Mean ( 8 / 20 )223.6216666666677.4795552194366929.8977225391095
Winsorized Mean ( 9 / 20 )223.4266666666677.3664332094817230.3303729651797
Winsorized Mean ( 10 / 20 )223.217.0700676844105931.5711263262975
Winsorized Mean ( 11 / 20 )219.9655.865739281316937.4999619742076
Winsorized Mean ( 12 / 20 )216.2255.1001620806193642.3957114660446
Winsorized Mean ( 13 / 20 )215.0554.5024779273057847.7636988947298
Winsorized Mean ( 14 / 20 )215.6154.0863288850828152.7649648531974
Winsorized Mean ( 15 / 20 )215.7653.8690206829632955.7673420951436
Winsorized Mean ( 16 / 20 )215.6053.8089660985775456.604599363727
Winsorized Mean ( 17 / 20 )216.5683333333333.2888722601948965.8488126627635
Winsorized Mean ( 18 / 20 )215.0383333333333.0023080496903471.6243402656542
Winsorized Mean ( 19 / 20 )215.642.7989346237896677.0436001495564
Winsorized Mean ( 20 / 20 )216.342.6684981704838681.0718187454379
Trimmed Mean ( 1 / 20 )230.2827586206909.937271233900723.1736412542597
Trimmed Mean ( 2 / 20 )227.8446428571439.2241963432864524.7007581341189
Trimmed Mean ( 3 / 20 )225.6703703703708.5782396722416726.3073053438478
Trimmed Mean ( 4 / 20 )223.7961538461548.0673064024361827.7411248168994
Trimmed Mean ( 5 / 20 )222.1747.5969359075665229.2452118463597
Trimmed Mean ( 6 / 20 )220.856257.1861543798974930.7335799266743
Trimmed Mean ( 7 / 20 )219.5956521739136.7402167115791332.5799097522586
Trimmed Mean ( 8 / 20 )218.6840909090916.381718524290734.2672730043976
Trimmed Mean ( 9 / 20 )217.8023809523815.9865989407034836.3816556127589
Trimmed Mean ( 10 / 20 )216.8655.4879034224700939.5169126176768
Trimmed Mean ( 11 / 20 )215.8631578947374.8962368646342744.0875643606881
Trimmed Mean ( 12 / 20 )215.2416666666674.5067839076747647.7594823883444
Trimmed Mean ( 13 / 20 )215.0970588235294.2268210017274050.8886131529167
Trimmed Mean ( 14 / 20 )215.1031254.0245378525882153.4479070340128
Trimmed Mean ( 15 / 20 )215.033.8642902427819555.6454061393684
Trimmed Mean ( 16 / 20 )214.9253.6951191351944858.1645657789293
Trimmed Mean ( 17 / 20 )214.8269230769233.4542217544613662.1925684995354
Trimmed Mean ( 18 / 20 )214.5708333333333.2823334707620865.3714301866822
Trimmed Mean ( 19 / 20 )214.53.1222979660411368.699400996623
Trimmed Mean ( 20 / 20 )214.322.9364371537451272.9864079422429
Median214.6
Midrange297.35
Midmean - Weighted Average at Xnp213.803225806452
Midmean - Weighted Average at X(n+1)p215.03
Midmean - Empirical Distribution Function213.803225806452
Midmean - Empirical Distribution Function - Averaging215.03
Midmean - Empirical Distribution Function - Interpolation215.03
Midmean - Closest Observation213.803225806452
Midmean - True Basic - Statistics Graphics Toolkit215.03
Midmean - MS Excel (old versions)215.103125
Number of observations60


Variability - Ungrouped Data
Absolute range342.9
Relative range (unbiased)4.19635261171575
Relative range (biased)4.23176549787481
Variance (unbiased)6677.14830225989
Variance (biased)6565.86249722222
Standard Deviation (unbiased)81.7138195304802
Standard Deviation (biased)81.0300098557455
Coefficient of Variation (unbiased)0.35142957701033
Coefficient of Variation (biased)0.348488692027491
Mean Squared Error (MSE versus 0)60630.6378333333
Mean Squared Error (MSE versus Mean)6565.86249722222
Mean Absolute Deviation from Mean (MAD Mean)60.9832222222222
Mean Absolute Deviation from Median (MAD Median)57.7883333333333
Median Absolute Deviation from Mean44.2683333333333
Median Absolute Deviation from Median38
Mean Squared Deviation from Mean6565.86249722222
Mean Squared Deviation from Median6886.92916666667
Interquartile Difference (Weighted Average at Xnp)76
Interquartile Difference (Weighted Average at X(n+1)p)77.05
Interquartile Difference (Empirical Distribution Function)76
Interquartile Difference (Empirical Distribution Function - Averaging)75.7
Interquartile Difference (Empirical Distribution Function - Interpolation)74.35
Interquartile Difference (Closest Observation)76
Interquartile Difference (True Basic - Statistics Graphics Toolkit)74.35
Interquartile Difference (MS Excel (old versions))78.4
Semi Interquartile Difference (Weighted Average at Xnp)38
Semi Interquartile Difference (Weighted Average at X(n+1)p)38.525
Semi Interquartile Difference (Empirical Distribution Function)38
Semi Interquartile Difference (Empirical Distribution Function - Averaging)37.85
Semi Interquartile Difference (Empirical Distribution Function - Interpolation)37.175
Semi Interquartile Difference (Closest Observation)38
Semi Interquartile Difference (True Basic - Statistics Graphics Toolkit)37.175
Semi Interquartile Difference (MS Excel (old versions))39.2
Coefficient of Quartile Variation (Weighted Average at Xnp)0.176744186046512
Coefficient of Quartile Variation (Weighted Average at X(n+1)p)0.178129695988903
Coefficient of Quartile Variation (Empirical Distribution Function)0.176744186046512
Coefficient of Quartile Variation (Empirical Distribution Function - Averaging)0.174948000924428
Coefficient of Quartile Variation (Empirical Distribution Function - Interpolation)0.171768511031535
Coefficient of Quartile Variation (Closest Observation)0.176744186046512
Coefficient of Quartile Variation (True Basic - Statistics Graphics Toolkit)0.171768511031535
Coefficient of Quartile Variation (MS Excel (old versions))0.181313598519889
Number of all Pairs of Observations1770
Squared Differences between all Pairs of Observations13354.2966045198
Mean Absolute Differences between all Pairs of Observations86.9913559322034
Gini Mean Difference86.9913559322036
Leik Measure of Dispersion0.502911804901114
Index of Diversity0.981309260525483
Index of Qualitative Variation0.997941620873372
Coefficient of Dispersion0.284171585378482
Observations60

\begin{tabular}{lllllllll}
\hline
Variability - Ungrouped Data \tabularnewline
Absolute range & 342.9 \tabularnewline
Relative range (unbiased) & 4.19635261171575 \tabularnewline
Relative range (biased) & 4.23176549787481 \tabularnewline
Variance (unbiased) & 6677.14830225989 \tabularnewline
Variance (biased) & 6565.86249722222 \tabularnewline
Standard Deviation (unbiased) & 81.7138195304802 \tabularnewline
Standard Deviation (biased) & 81.0300098557455 \tabularnewline
Coefficient of Variation (unbiased) & 0.35142957701033 \tabularnewline
Coefficient of Variation (biased) & 0.348488692027491 \tabularnewline
Mean Squared Error (MSE versus 0) & 60630.6378333333 \tabularnewline
Mean Squared Error (MSE versus Mean) & 6565.86249722222 \tabularnewline
Mean Absolute Deviation from Mean (MAD Mean) & 60.9832222222222 \tabularnewline
Mean Absolute Deviation from Median (MAD Median) & 57.7883333333333 \tabularnewline
Median Absolute Deviation from Mean & 44.2683333333333 \tabularnewline
Median Absolute Deviation from Median & 38 \tabularnewline
Mean Squared Deviation from Mean & 6565.86249722222 \tabularnewline
Mean Squared Deviation from Median & 6886.92916666667 \tabularnewline
Interquartile Difference (Weighted Average at Xnp) & 76 \tabularnewline
Interquartile Difference (Weighted Average at X(n+1)p) & 77.05 \tabularnewline
Interquartile Difference (Empirical Distribution Function) & 76 \tabularnewline
Interquartile Difference (Empirical Distribution Function - Averaging) & 75.7 \tabularnewline
Interquartile Difference (Empirical Distribution Function - Interpolation) & 74.35 \tabularnewline
Interquartile Difference (Closest Observation) & 76 \tabularnewline
Interquartile Difference (True Basic - Statistics Graphics Toolkit) & 74.35 \tabularnewline
Interquartile Difference (MS Excel (old versions)) & 78.4 \tabularnewline
Semi Interquartile Difference (Weighted Average at Xnp) & 38 \tabularnewline
Semi Interquartile Difference (Weighted Average at X(n+1)p) & 38.525 \tabularnewline
Semi Interquartile Difference (Empirical Distribution Function) & 38 \tabularnewline
Semi Interquartile Difference (Empirical Distribution Function - Averaging) & 37.85 \tabularnewline
Semi Interquartile Difference (Empirical Distribution Function - Interpolation) & 37.175 \tabularnewline
Semi Interquartile Difference (Closest Observation) & 38 \tabularnewline
Semi Interquartile Difference (True Basic - Statistics Graphics Toolkit) & 37.175 \tabularnewline
Semi Interquartile Difference (MS Excel (old versions)) & 39.2 \tabularnewline
Coefficient of Quartile Variation (Weighted Average at Xnp) & 0.176744186046512 \tabularnewline
Coefficient of Quartile Variation (Weighted Average at X(n+1)p) & 0.178129695988903 \tabularnewline
Coefficient of Quartile Variation (Empirical Distribution Function) & 0.176744186046512 \tabularnewline
Coefficient of Quartile Variation (Empirical Distribution Function - Averaging) & 0.174948000924428 \tabularnewline
Coefficient of Quartile Variation (Empirical Distribution Function - Interpolation) & 0.171768511031535 \tabularnewline
Coefficient of Quartile Variation (Closest Observation) & 0.176744186046512 \tabularnewline
Coefficient of Quartile Variation (True Basic - Statistics Graphics Toolkit) & 0.171768511031535 \tabularnewline
Coefficient of Quartile Variation (MS Excel (old versions)) & 0.181313598519889 \tabularnewline
Number of all Pairs of Observations & 1770 \tabularnewline
Squared Differences between all Pairs of Observations & 13354.2966045198 \tabularnewline
Mean Absolute Differences between all Pairs of Observations & 86.9913559322034 \tabularnewline
Gini Mean Difference & 86.9913559322036 \tabularnewline
Leik Measure of Dispersion & 0.502911804901114 \tabularnewline
Index of Diversity & 0.981309260525483 \tabularnewline
Index of Qualitative Variation & 0.997941620873372 \tabularnewline
Coefficient of Dispersion & 0.284171585378482 \tabularnewline
Observations & 60 \tabularnewline
\hline
\end{tabular}
%Source: https://freestatistics.org/blog/index.php?pk=67232&T=2

[TABLE]
[ROW][C]Variability - Ungrouped Data[/C][/ROW]
[ROW][C]Absolute range[/C][C]342.9[/C][/ROW]
[ROW][C]Relative range (unbiased)[/C][C]4.19635261171575[/C][/ROW]
[ROW][C]Relative range (biased)[/C][C]4.23176549787481[/C][/ROW]
[ROW][C]Variance (unbiased)[/C][C]6677.14830225989[/C][/ROW]
[ROW][C]Variance (biased)[/C][C]6565.86249722222[/C][/ROW]
[ROW][C]Standard Deviation (unbiased)[/C][C]81.7138195304802[/C][/ROW]
[ROW][C]Standard Deviation (biased)[/C][C]81.0300098557455[/C][/ROW]
[ROW][C]Coefficient of Variation (unbiased)[/C][C]0.35142957701033[/C][/ROW]
[ROW][C]Coefficient of Variation (biased)[/C][C]0.348488692027491[/C][/ROW]
[ROW][C]Mean Squared Error (MSE versus 0)[/C][C]60630.6378333333[/C][/ROW]
[ROW][C]Mean Squared Error (MSE versus Mean)[/C][C]6565.86249722222[/C][/ROW]
[ROW][C]Mean Absolute Deviation from Mean (MAD Mean)[/C][C]60.9832222222222[/C][/ROW]
[ROW][C]Mean Absolute Deviation from Median (MAD Median)[/C][C]57.7883333333333[/C][/ROW]
[ROW][C]Median Absolute Deviation from Mean[/C][C]44.2683333333333[/C][/ROW]
[ROW][C]Median Absolute Deviation from Median[/C][C]38[/C][/ROW]
[ROW][C]Mean Squared Deviation from Mean[/C][C]6565.86249722222[/C][/ROW]
[ROW][C]Mean Squared Deviation from Median[/C][C]6886.92916666667[/C][/ROW]
[ROW][C]Interquartile Difference (Weighted Average at Xnp)[/C][C]76[/C][/ROW]
[ROW][C]Interquartile Difference (Weighted Average at X(n+1)p)[/C][C]77.05[/C][/ROW]
[ROW][C]Interquartile Difference (Empirical Distribution Function)[/C][C]76[/C][/ROW]
[ROW][C]Interquartile Difference (Empirical Distribution Function - Averaging)[/C][C]75.7[/C][/ROW]
[ROW][C]Interquartile Difference (Empirical Distribution Function - Interpolation)[/C][C]74.35[/C][/ROW]
[ROW][C]Interquartile Difference (Closest Observation)[/C][C]76[/C][/ROW]
[ROW][C]Interquartile Difference (True Basic - Statistics Graphics Toolkit)[/C][C]74.35[/C][/ROW]
[ROW][C]Interquartile Difference (MS Excel (old versions))[/C][C]78.4[/C][/ROW]
[ROW][C]Semi Interquartile Difference (Weighted Average at Xnp)[/C][C]38[/C][/ROW]
[ROW][C]Semi Interquartile Difference (Weighted Average at X(n+1)p)[/C][C]38.525[/C][/ROW]
[ROW][C]Semi Interquartile Difference (Empirical Distribution Function)[/C][C]38[/C][/ROW]
[ROW][C]Semi Interquartile Difference (Empirical Distribution Function - Averaging)[/C][C]37.85[/C][/ROW]
[ROW][C]Semi Interquartile Difference (Empirical Distribution Function - Interpolation)[/C][C]37.175[/C][/ROW]
[ROW][C]Semi Interquartile Difference (Closest Observation)[/C][C]38[/C][/ROW]
[ROW][C]Semi Interquartile Difference (True Basic - Statistics Graphics Toolkit)[/C][C]37.175[/C][/ROW]
[ROW][C]Semi Interquartile Difference (MS Excel (old versions))[/C][C]39.2[/C][/ROW]
[ROW][C]Coefficient of Quartile Variation (Weighted Average at Xnp)[/C][C]0.176744186046512[/C][/ROW]
[ROW][C]Coefficient of Quartile Variation (Weighted Average at X(n+1)p)[/C][C]0.178129695988903[/C][/ROW]
[ROW][C]Coefficient of Quartile Variation (Empirical Distribution Function)[/C][C]0.176744186046512[/C][/ROW]
[ROW][C]Coefficient of Quartile Variation (Empirical Distribution Function - Averaging)[/C][C]0.174948000924428[/C][/ROW]
[ROW][C]Coefficient of Quartile Variation (Empirical Distribution Function - Interpolation)[/C][C]0.171768511031535[/C][/ROW]
[ROW][C]Coefficient of Quartile Variation (Closest Observation)[/C][C]0.176744186046512[/C][/ROW]
[ROW][C]Coefficient of Quartile Variation (True Basic - Statistics Graphics Toolkit)[/C][C]0.171768511031535[/C][/ROW]
[ROW][C]Coefficient of Quartile Variation (MS Excel (old versions))[/C][C]0.181313598519889[/C][/ROW]
[ROW][C]Number of all Pairs of Observations[/C][C]1770[/C][/ROW]
[ROW][C]Squared Differences between all Pairs of Observations[/C][C]13354.2966045198[/C][/ROW]
[ROW][C]Mean Absolute Differences between all Pairs of Observations[/C][C]86.9913559322034[/C][/ROW]
[ROW][C]Gini Mean Difference[/C][C]86.9913559322036[/C][/ROW]
[ROW][C]Leik Measure of Dispersion[/C][C]0.502911804901114[/C][/ROW]
[ROW][C]Index of Diversity[/C][C]0.981309260525483[/C][/ROW]
[ROW][C]Index of Qualitative Variation[/C][C]0.997941620873372[/C][/ROW]
[ROW][C]Coefficient of Dispersion[/C][C]0.284171585378482[/C][/ROW]
[ROW][C]Observations[/C][C]60[/C][/ROW]
[/TABLE]
Source: https://freestatistics.org/blog/index.php?pk=67232&T=2

Globally Unique Identifier (entire table): ba.freestatistics.org/blog/index.php?pk=67232&T=2

As an alternative you can also use a QR Code:  

The GUIDs for individual cells are displayed in the table below:

Variability - Ungrouped Data
Absolute range342.9
Relative range (unbiased)4.19635261171575
Relative range (biased)4.23176549787481
Variance (unbiased)6677.14830225989
Variance (biased)6565.86249722222
Standard Deviation (unbiased)81.7138195304802
Standard Deviation (biased)81.0300098557455
Coefficient of Variation (unbiased)0.35142957701033
Coefficient of Variation (biased)0.348488692027491
Mean Squared Error (MSE versus 0)60630.6378333333
Mean Squared Error (MSE versus Mean)6565.86249722222
Mean Absolute Deviation from Mean (MAD Mean)60.9832222222222
Mean Absolute Deviation from Median (MAD Median)57.7883333333333
Median Absolute Deviation from Mean44.2683333333333
Median Absolute Deviation from Median38
Mean Squared Deviation from Mean6565.86249722222
Mean Squared Deviation from Median6886.92916666667
Interquartile Difference (Weighted Average at Xnp)76
Interquartile Difference (Weighted Average at X(n+1)p)77.05
Interquartile Difference (Empirical Distribution Function)76
Interquartile Difference (Empirical Distribution Function - Averaging)75.7
Interquartile Difference (Empirical Distribution Function - Interpolation)74.35
Interquartile Difference (Closest Observation)76
Interquartile Difference (True Basic - Statistics Graphics Toolkit)74.35
Interquartile Difference (MS Excel (old versions))78.4
Semi Interquartile Difference (Weighted Average at Xnp)38
Semi Interquartile Difference (Weighted Average at X(n+1)p)38.525
Semi Interquartile Difference (Empirical Distribution Function)38
Semi Interquartile Difference (Empirical Distribution Function - Averaging)37.85
Semi Interquartile Difference (Empirical Distribution Function - Interpolation)37.175
Semi Interquartile Difference (Closest Observation)38
Semi Interquartile Difference (True Basic - Statistics Graphics Toolkit)37.175
Semi Interquartile Difference (MS Excel (old versions))39.2
Coefficient of Quartile Variation (Weighted Average at Xnp)0.176744186046512
Coefficient of Quartile Variation (Weighted Average at X(n+1)p)0.178129695988903
Coefficient of Quartile Variation (Empirical Distribution Function)0.176744186046512
Coefficient of Quartile Variation (Empirical Distribution Function - Averaging)0.174948000924428
Coefficient of Quartile Variation (Empirical Distribution Function - Interpolation)0.171768511031535
Coefficient of Quartile Variation (Closest Observation)0.176744186046512
Coefficient of Quartile Variation (True Basic - Statistics Graphics Toolkit)0.171768511031535
Coefficient of Quartile Variation (MS Excel (old versions))0.181313598519889
Number of all Pairs of Observations1770
Squared Differences between all Pairs of Observations13354.2966045198
Mean Absolute Differences between all Pairs of Observations86.9913559322034
Gini Mean Difference86.9913559322036
Leik Measure of Dispersion0.502911804901114
Index of Diversity0.981309260525483
Index of Qualitative Variation0.997941620873372
Coefficient of Dispersion0.284171585378482
Observations60


Percentiles - Ungrouped Data
pWeighted Average at XnpWeighted Average at X(n+1)pEmpirical Distribution FunctionEmpirical Distribution Function - AveragingEmpirical Distribution Function - InterpolationClosest ObservationTrue Basic - Statistics Graphics ToolkitMS Excel (old versions)
0.02127.34127.484133.1133.1133.928125.9131.516125.9
0.04134.94135.124137.7137.7140.616133.1135.676133.1
0.06142.56143.046145.8145.8146.178145.8140.454145.8
0.08146.36146.416146.5146.5146.86146.5145.884146.5
0.1147147.11147147.55147.99147147.99147
0.12148.44148.644149.8149.8149.952148.1149.256148.1
0.14150.56150.826151.7151.7152.012149.8150.674151.7
0.16152.42152.612152.9152.9154.616152.9151.988152.9
0.18156.02156.722156.8156.8161.512156.8152.978156.8
0.2164.4164.54164.4164.75164.96164.4164.96164.4
0.22166.16167.326170.4170.4170.294165.1168.174165.1
0.24173.04174.624177177177.48170.4172.776177
0.26178.8179.58180180180.136180177.42180
0.28180.32181.008180.4180.4184.352180.4187.392180.4
0.3188188.15188188.25188.35188188.35188
0.32189.12190.112191.6191.6191.228188.5189.988191.6
0.34192.56193.376194194194.318191.6192.224194
0.36197.18199.088199.3199.3199.348199.3194.212199.3
0.38199.46200.112199.5199.5200.928199.5202.288199.5
0.4202.9203.22202.9203.3203.38202.9203.38202.9
0.42203.96204.506205205204.714203.7204.194205
0.44205.24205.504205.6205.6205.576205205.096205.6
0.46205.9206.4206.1206.1206.8206.1210.8206.1
0.48210.1211.912211.1211.1212.028211.1213.188211.1
0.5214214.6214214.6214.6214214.6214.6
0.52215.28215.488215.6215.6215.472215.2215.312215.6
0.54216.36217.386217.5217.5217.234215.6215.714217.5
0.56217.92218.2218.2218.2218.2218.2218.2218.2
0.58218.2218.618218.2218.2218.442218.2218.882218.2
0.6219.3225.72219.3224.65223.58219.3223.58230
0.62230.06230.246230.3230.3230.174230230.054230.3
0.64234.26240.22240.2240.2237.824230.3240.68240.2
0.66240.5240.778240.7240.7240.67240.7240.922240.7
0.68240.94241.576241241241.144241241.624241
0.7242.2246.12242.2245243.88242.2243.88247.8
0.72248.64251.664252252249.816247.8248.136252
0.74252.4253.336253253252.66252255.064253
0.76254.44256.912255.4255.4255.016255.4258.088255.4
0.78258.76265.806259.6259.6259.814259.6264.094270.3
0.8270.3285.82270.3280274.18270.3274.18289.7
0.82294.76315.104315315299.314289.7320.096315
0.84317.08320.8320.2320.2317.912315322.1320.2
0.86321.7325.828322.7322.7322.05322.7326.372322.7
0.88328.14344.528329.5329.5328.956329.5336.572351.6
0.9351.6359.7351.6356.1352.5351.6352.5360.6
0.92364.92384.696382.2382.2366.648360.6400.504382.2
0.94390.52414.016403403391.768382.2424.384403
0.96422.44451.416435.4435.4423.736435.4447.984464
0.98458.28467.744464464458.852464465.056468.8

\begin{tabular}{lllllllll}
\hline
Percentiles - Ungrouped Data \tabularnewline
p & Weighted Average at Xnp & Weighted Average at X(n+1)p & Empirical Distribution Function & Empirical Distribution Function - Averaging & Empirical Distribution Function - Interpolation & Closest Observation & True Basic - Statistics Graphics Toolkit & MS Excel (old versions) \tabularnewline
0.02 & 127.34 & 127.484 & 133.1 & 133.1 & 133.928 & 125.9 & 131.516 & 125.9 \tabularnewline
0.04 & 134.94 & 135.124 & 137.7 & 137.7 & 140.616 & 133.1 & 135.676 & 133.1 \tabularnewline
0.06 & 142.56 & 143.046 & 145.8 & 145.8 & 146.178 & 145.8 & 140.454 & 145.8 \tabularnewline
0.08 & 146.36 & 146.416 & 146.5 & 146.5 & 146.86 & 146.5 & 145.884 & 146.5 \tabularnewline
0.1 & 147 & 147.11 & 147 & 147.55 & 147.99 & 147 & 147.99 & 147 \tabularnewline
0.12 & 148.44 & 148.644 & 149.8 & 149.8 & 149.952 & 148.1 & 149.256 & 148.1 \tabularnewline
0.14 & 150.56 & 150.826 & 151.7 & 151.7 & 152.012 & 149.8 & 150.674 & 151.7 \tabularnewline
0.16 & 152.42 & 152.612 & 152.9 & 152.9 & 154.616 & 152.9 & 151.988 & 152.9 \tabularnewline
0.18 & 156.02 & 156.722 & 156.8 & 156.8 & 161.512 & 156.8 & 152.978 & 156.8 \tabularnewline
0.2 & 164.4 & 164.54 & 164.4 & 164.75 & 164.96 & 164.4 & 164.96 & 164.4 \tabularnewline
0.22 & 166.16 & 167.326 & 170.4 & 170.4 & 170.294 & 165.1 & 168.174 & 165.1 \tabularnewline
0.24 & 173.04 & 174.624 & 177 & 177 & 177.48 & 170.4 & 172.776 & 177 \tabularnewline
0.26 & 178.8 & 179.58 & 180 & 180 & 180.136 & 180 & 177.42 & 180 \tabularnewline
0.28 & 180.32 & 181.008 & 180.4 & 180.4 & 184.352 & 180.4 & 187.392 & 180.4 \tabularnewline
0.3 & 188 & 188.15 & 188 & 188.25 & 188.35 & 188 & 188.35 & 188 \tabularnewline
0.32 & 189.12 & 190.112 & 191.6 & 191.6 & 191.228 & 188.5 & 189.988 & 191.6 \tabularnewline
0.34 & 192.56 & 193.376 & 194 & 194 & 194.318 & 191.6 & 192.224 & 194 \tabularnewline
0.36 & 197.18 & 199.088 & 199.3 & 199.3 & 199.348 & 199.3 & 194.212 & 199.3 \tabularnewline
0.38 & 199.46 & 200.112 & 199.5 & 199.5 & 200.928 & 199.5 & 202.288 & 199.5 \tabularnewline
0.4 & 202.9 & 203.22 & 202.9 & 203.3 & 203.38 & 202.9 & 203.38 & 202.9 \tabularnewline
0.42 & 203.96 & 204.506 & 205 & 205 & 204.714 & 203.7 & 204.194 & 205 \tabularnewline
0.44 & 205.24 & 205.504 & 205.6 & 205.6 & 205.576 & 205 & 205.096 & 205.6 \tabularnewline
0.46 & 205.9 & 206.4 & 206.1 & 206.1 & 206.8 & 206.1 & 210.8 & 206.1 \tabularnewline
0.48 & 210.1 & 211.912 & 211.1 & 211.1 & 212.028 & 211.1 & 213.188 & 211.1 \tabularnewline
0.5 & 214 & 214.6 & 214 & 214.6 & 214.6 & 214 & 214.6 & 214.6 \tabularnewline
0.52 & 215.28 & 215.488 & 215.6 & 215.6 & 215.472 & 215.2 & 215.312 & 215.6 \tabularnewline
0.54 & 216.36 & 217.386 & 217.5 & 217.5 & 217.234 & 215.6 & 215.714 & 217.5 \tabularnewline
0.56 & 217.92 & 218.2 & 218.2 & 218.2 & 218.2 & 218.2 & 218.2 & 218.2 \tabularnewline
0.58 & 218.2 & 218.618 & 218.2 & 218.2 & 218.442 & 218.2 & 218.882 & 218.2 \tabularnewline
0.6 & 219.3 & 225.72 & 219.3 & 224.65 & 223.58 & 219.3 & 223.58 & 230 \tabularnewline
0.62 & 230.06 & 230.246 & 230.3 & 230.3 & 230.174 & 230 & 230.054 & 230.3 \tabularnewline
0.64 & 234.26 & 240.22 & 240.2 & 240.2 & 237.824 & 230.3 & 240.68 & 240.2 \tabularnewline
0.66 & 240.5 & 240.778 & 240.7 & 240.7 & 240.67 & 240.7 & 240.922 & 240.7 \tabularnewline
0.68 & 240.94 & 241.576 & 241 & 241 & 241.144 & 241 & 241.624 & 241 \tabularnewline
0.7 & 242.2 & 246.12 & 242.2 & 245 & 243.88 & 242.2 & 243.88 & 247.8 \tabularnewline
0.72 & 248.64 & 251.664 & 252 & 252 & 249.816 & 247.8 & 248.136 & 252 \tabularnewline
0.74 & 252.4 & 253.336 & 253 & 253 & 252.66 & 252 & 255.064 & 253 \tabularnewline
0.76 & 254.44 & 256.912 & 255.4 & 255.4 & 255.016 & 255.4 & 258.088 & 255.4 \tabularnewline
0.78 & 258.76 & 265.806 & 259.6 & 259.6 & 259.814 & 259.6 & 264.094 & 270.3 \tabularnewline
0.8 & 270.3 & 285.82 & 270.3 & 280 & 274.18 & 270.3 & 274.18 & 289.7 \tabularnewline
0.82 & 294.76 & 315.104 & 315 & 315 & 299.314 & 289.7 & 320.096 & 315 \tabularnewline
0.84 & 317.08 & 320.8 & 320.2 & 320.2 & 317.912 & 315 & 322.1 & 320.2 \tabularnewline
0.86 & 321.7 & 325.828 & 322.7 & 322.7 & 322.05 & 322.7 & 326.372 & 322.7 \tabularnewline
0.88 & 328.14 & 344.528 & 329.5 & 329.5 & 328.956 & 329.5 & 336.572 & 351.6 \tabularnewline
0.9 & 351.6 & 359.7 & 351.6 & 356.1 & 352.5 & 351.6 & 352.5 & 360.6 \tabularnewline
0.92 & 364.92 & 384.696 & 382.2 & 382.2 & 366.648 & 360.6 & 400.504 & 382.2 \tabularnewline
0.94 & 390.52 & 414.016 & 403 & 403 & 391.768 & 382.2 & 424.384 & 403 \tabularnewline
0.96 & 422.44 & 451.416 & 435.4 & 435.4 & 423.736 & 435.4 & 447.984 & 464 \tabularnewline
0.98 & 458.28 & 467.744 & 464 & 464 & 458.852 & 464 & 465.056 & 468.8 \tabularnewline
\hline
\end{tabular}
%Source: https://freestatistics.org/blog/index.php?pk=67232&T=3

[TABLE]
[ROW][C]Percentiles - Ungrouped Data[/C][/ROW]
[ROW][C]p[/C][C]Weighted Average at Xnp[/C][C]Weighted Average at X(n+1)p[/C][C]Empirical Distribution Function[/C][C]Empirical Distribution Function - Averaging[/C][C]Empirical Distribution Function - Interpolation[/C][C]Closest Observation[/C][C]True Basic - Statistics Graphics Toolkit[/C][C]MS Excel (old versions)[/C][/ROW]
[ROW][C]0.02[/C][C]127.34[/C][C]127.484[/C][C]133.1[/C][C]133.1[/C][C]133.928[/C][C]125.9[/C][C]131.516[/C][C]125.9[/C][/ROW]
[ROW][C]0.04[/C][C]134.94[/C][C]135.124[/C][C]137.7[/C][C]137.7[/C][C]140.616[/C][C]133.1[/C][C]135.676[/C][C]133.1[/C][/ROW]
[ROW][C]0.06[/C][C]142.56[/C][C]143.046[/C][C]145.8[/C][C]145.8[/C][C]146.178[/C][C]145.8[/C][C]140.454[/C][C]145.8[/C][/ROW]
[ROW][C]0.08[/C][C]146.36[/C][C]146.416[/C][C]146.5[/C][C]146.5[/C][C]146.86[/C][C]146.5[/C][C]145.884[/C][C]146.5[/C][/ROW]
[ROW][C]0.1[/C][C]147[/C][C]147.11[/C][C]147[/C][C]147.55[/C][C]147.99[/C][C]147[/C][C]147.99[/C][C]147[/C][/ROW]
[ROW][C]0.12[/C][C]148.44[/C][C]148.644[/C][C]149.8[/C][C]149.8[/C][C]149.952[/C][C]148.1[/C][C]149.256[/C][C]148.1[/C][/ROW]
[ROW][C]0.14[/C][C]150.56[/C][C]150.826[/C][C]151.7[/C][C]151.7[/C][C]152.012[/C][C]149.8[/C][C]150.674[/C][C]151.7[/C][/ROW]
[ROW][C]0.16[/C][C]152.42[/C][C]152.612[/C][C]152.9[/C][C]152.9[/C][C]154.616[/C][C]152.9[/C][C]151.988[/C][C]152.9[/C][/ROW]
[ROW][C]0.18[/C][C]156.02[/C][C]156.722[/C][C]156.8[/C][C]156.8[/C][C]161.512[/C][C]156.8[/C][C]152.978[/C][C]156.8[/C][/ROW]
[ROW][C]0.2[/C][C]164.4[/C][C]164.54[/C][C]164.4[/C][C]164.75[/C][C]164.96[/C][C]164.4[/C][C]164.96[/C][C]164.4[/C][/ROW]
[ROW][C]0.22[/C][C]166.16[/C][C]167.326[/C][C]170.4[/C][C]170.4[/C][C]170.294[/C][C]165.1[/C][C]168.174[/C][C]165.1[/C][/ROW]
[ROW][C]0.24[/C][C]173.04[/C][C]174.624[/C][C]177[/C][C]177[/C][C]177.48[/C][C]170.4[/C][C]172.776[/C][C]177[/C][/ROW]
[ROW][C]0.26[/C][C]178.8[/C][C]179.58[/C][C]180[/C][C]180[/C][C]180.136[/C][C]180[/C][C]177.42[/C][C]180[/C][/ROW]
[ROW][C]0.28[/C][C]180.32[/C][C]181.008[/C][C]180.4[/C][C]180.4[/C][C]184.352[/C][C]180.4[/C][C]187.392[/C][C]180.4[/C][/ROW]
[ROW][C]0.3[/C][C]188[/C][C]188.15[/C][C]188[/C][C]188.25[/C][C]188.35[/C][C]188[/C][C]188.35[/C][C]188[/C][/ROW]
[ROW][C]0.32[/C][C]189.12[/C][C]190.112[/C][C]191.6[/C][C]191.6[/C][C]191.228[/C][C]188.5[/C][C]189.988[/C][C]191.6[/C][/ROW]
[ROW][C]0.34[/C][C]192.56[/C][C]193.376[/C][C]194[/C][C]194[/C][C]194.318[/C][C]191.6[/C][C]192.224[/C][C]194[/C][/ROW]
[ROW][C]0.36[/C][C]197.18[/C][C]199.088[/C][C]199.3[/C][C]199.3[/C][C]199.348[/C][C]199.3[/C][C]194.212[/C][C]199.3[/C][/ROW]
[ROW][C]0.38[/C][C]199.46[/C][C]200.112[/C][C]199.5[/C][C]199.5[/C][C]200.928[/C][C]199.5[/C][C]202.288[/C][C]199.5[/C][/ROW]
[ROW][C]0.4[/C][C]202.9[/C][C]203.22[/C][C]202.9[/C][C]203.3[/C][C]203.38[/C][C]202.9[/C][C]203.38[/C][C]202.9[/C][/ROW]
[ROW][C]0.42[/C][C]203.96[/C][C]204.506[/C][C]205[/C][C]205[/C][C]204.714[/C][C]203.7[/C][C]204.194[/C][C]205[/C][/ROW]
[ROW][C]0.44[/C][C]205.24[/C][C]205.504[/C][C]205.6[/C][C]205.6[/C][C]205.576[/C][C]205[/C][C]205.096[/C][C]205.6[/C][/ROW]
[ROW][C]0.46[/C][C]205.9[/C][C]206.4[/C][C]206.1[/C][C]206.1[/C][C]206.8[/C][C]206.1[/C][C]210.8[/C][C]206.1[/C][/ROW]
[ROW][C]0.48[/C][C]210.1[/C][C]211.912[/C][C]211.1[/C][C]211.1[/C][C]212.028[/C][C]211.1[/C][C]213.188[/C][C]211.1[/C][/ROW]
[ROW][C]0.5[/C][C]214[/C][C]214.6[/C][C]214[/C][C]214.6[/C][C]214.6[/C][C]214[/C][C]214.6[/C][C]214.6[/C][/ROW]
[ROW][C]0.52[/C][C]215.28[/C][C]215.488[/C][C]215.6[/C][C]215.6[/C][C]215.472[/C][C]215.2[/C][C]215.312[/C][C]215.6[/C][/ROW]
[ROW][C]0.54[/C][C]216.36[/C][C]217.386[/C][C]217.5[/C][C]217.5[/C][C]217.234[/C][C]215.6[/C][C]215.714[/C][C]217.5[/C][/ROW]
[ROW][C]0.56[/C][C]217.92[/C][C]218.2[/C][C]218.2[/C][C]218.2[/C][C]218.2[/C][C]218.2[/C][C]218.2[/C][C]218.2[/C][/ROW]
[ROW][C]0.58[/C][C]218.2[/C][C]218.618[/C][C]218.2[/C][C]218.2[/C][C]218.442[/C][C]218.2[/C][C]218.882[/C][C]218.2[/C][/ROW]
[ROW][C]0.6[/C][C]219.3[/C][C]225.72[/C][C]219.3[/C][C]224.65[/C][C]223.58[/C][C]219.3[/C][C]223.58[/C][C]230[/C][/ROW]
[ROW][C]0.62[/C][C]230.06[/C][C]230.246[/C][C]230.3[/C][C]230.3[/C][C]230.174[/C][C]230[/C][C]230.054[/C][C]230.3[/C][/ROW]
[ROW][C]0.64[/C][C]234.26[/C][C]240.22[/C][C]240.2[/C][C]240.2[/C][C]237.824[/C][C]230.3[/C][C]240.68[/C][C]240.2[/C][/ROW]
[ROW][C]0.66[/C][C]240.5[/C][C]240.778[/C][C]240.7[/C][C]240.7[/C][C]240.67[/C][C]240.7[/C][C]240.922[/C][C]240.7[/C][/ROW]
[ROW][C]0.68[/C][C]240.94[/C][C]241.576[/C][C]241[/C][C]241[/C][C]241.144[/C][C]241[/C][C]241.624[/C][C]241[/C][/ROW]
[ROW][C]0.7[/C][C]242.2[/C][C]246.12[/C][C]242.2[/C][C]245[/C][C]243.88[/C][C]242.2[/C][C]243.88[/C][C]247.8[/C][/ROW]
[ROW][C]0.72[/C][C]248.64[/C][C]251.664[/C][C]252[/C][C]252[/C][C]249.816[/C][C]247.8[/C][C]248.136[/C][C]252[/C][/ROW]
[ROW][C]0.74[/C][C]252.4[/C][C]253.336[/C][C]253[/C][C]253[/C][C]252.66[/C][C]252[/C][C]255.064[/C][C]253[/C][/ROW]
[ROW][C]0.76[/C][C]254.44[/C][C]256.912[/C][C]255.4[/C][C]255.4[/C][C]255.016[/C][C]255.4[/C][C]258.088[/C][C]255.4[/C][/ROW]
[ROW][C]0.78[/C][C]258.76[/C][C]265.806[/C][C]259.6[/C][C]259.6[/C][C]259.814[/C][C]259.6[/C][C]264.094[/C][C]270.3[/C][/ROW]
[ROW][C]0.8[/C][C]270.3[/C][C]285.82[/C][C]270.3[/C][C]280[/C][C]274.18[/C][C]270.3[/C][C]274.18[/C][C]289.7[/C][/ROW]
[ROW][C]0.82[/C][C]294.76[/C][C]315.104[/C][C]315[/C][C]315[/C][C]299.314[/C][C]289.7[/C][C]320.096[/C][C]315[/C][/ROW]
[ROW][C]0.84[/C][C]317.08[/C][C]320.8[/C][C]320.2[/C][C]320.2[/C][C]317.912[/C][C]315[/C][C]322.1[/C][C]320.2[/C][/ROW]
[ROW][C]0.86[/C][C]321.7[/C][C]325.828[/C][C]322.7[/C][C]322.7[/C][C]322.05[/C][C]322.7[/C][C]326.372[/C][C]322.7[/C][/ROW]
[ROW][C]0.88[/C][C]328.14[/C][C]344.528[/C][C]329.5[/C][C]329.5[/C][C]328.956[/C][C]329.5[/C][C]336.572[/C][C]351.6[/C][/ROW]
[ROW][C]0.9[/C][C]351.6[/C][C]359.7[/C][C]351.6[/C][C]356.1[/C][C]352.5[/C][C]351.6[/C][C]352.5[/C][C]360.6[/C][/ROW]
[ROW][C]0.92[/C][C]364.92[/C][C]384.696[/C][C]382.2[/C][C]382.2[/C][C]366.648[/C][C]360.6[/C][C]400.504[/C][C]382.2[/C][/ROW]
[ROW][C]0.94[/C][C]390.52[/C][C]414.016[/C][C]403[/C][C]403[/C][C]391.768[/C][C]382.2[/C][C]424.384[/C][C]403[/C][/ROW]
[ROW][C]0.96[/C][C]422.44[/C][C]451.416[/C][C]435.4[/C][C]435.4[/C][C]423.736[/C][C]435.4[/C][C]447.984[/C][C]464[/C][/ROW]
[ROW][C]0.98[/C][C]458.28[/C][C]467.744[/C][C]464[/C][C]464[/C][C]458.852[/C][C]464[/C][C]465.056[/C][C]468.8[/C][/ROW]
[/TABLE]
Source: https://freestatistics.org/blog/index.php?pk=67232&T=3

Globally Unique Identifier (entire table): ba.freestatistics.org/blog/index.php?pk=67232&T=3

As an alternative you can also use a QR Code:  

The GUIDs for individual cells are displayed in the table below:

Percentiles - Ungrouped Data
pWeighted Average at XnpWeighted Average at X(n+1)pEmpirical Distribution FunctionEmpirical Distribution Function - AveragingEmpirical Distribution Function - InterpolationClosest ObservationTrue Basic - Statistics Graphics ToolkitMS Excel (old versions)
0.02127.34127.484133.1133.1133.928125.9131.516125.9
0.04134.94135.124137.7137.7140.616133.1135.676133.1
0.06142.56143.046145.8145.8146.178145.8140.454145.8
0.08146.36146.416146.5146.5146.86146.5145.884146.5
0.1147147.11147147.55147.99147147.99147
0.12148.44148.644149.8149.8149.952148.1149.256148.1
0.14150.56150.826151.7151.7152.012149.8150.674151.7
0.16152.42152.612152.9152.9154.616152.9151.988152.9
0.18156.02156.722156.8156.8161.512156.8152.978156.8
0.2164.4164.54164.4164.75164.96164.4164.96164.4
0.22166.16167.326170.4170.4170.294165.1168.174165.1
0.24173.04174.624177177177.48170.4172.776177
0.26178.8179.58180180180.136180177.42180
0.28180.32181.008180.4180.4184.352180.4187.392180.4
0.3188188.15188188.25188.35188188.35188
0.32189.12190.112191.6191.6191.228188.5189.988191.6
0.34192.56193.376194194194.318191.6192.224194
0.36197.18199.088199.3199.3199.348199.3194.212199.3
0.38199.46200.112199.5199.5200.928199.5202.288199.5
0.4202.9203.22202.9203.3203.38202.9203.38202.9
0.42203.96204.506205205204.714203.7204.194205
0.44205.24205.504205.6205.6205.576205205.096205.6
0.46205.9206.4206.1206.1206.8206.1210.8206.1
0.48210.1211.912211.1211.1212.028211.1213.188211.1
0.5214214.6214214.6214.6214214.6214.6
0.52215.28215.488215.6215.6215.472215.2215.312215.6
0.54216.36217.386217.5217.5217.234215.6215.714217.5
0.56217.92218.2218.2218.2218.2218.2218.2218.2
0.58218.2218.618218.2218.2218.442218.2218.882218.2
0.6219.3225.72219.3224.65223.58219.3223.58230
0.62230.06230.246230.3230.3230.174230230.054230.3
0.64234.26240.22240.2240.2237.824230.3240.68240.2
0.66240.5240.778240.7240.7240.67240.7240.922240.7
0.68240.94241.576241241241.144241241.624241
0.7242.2246.12242.2245243.88242.2243.88247.8
0.72248.64251.664252252249.816247.8248.136252
0.74252.4253.336253253252.66252255.064253
0.76254.44256.912255.4255.4255.016255.4258.088255.4
0.78258.76265.806259.6259.6259.814259.6264.094270.3
0.8270.3285.82270.3280274.18270.3274.18289.7
0.82294.76315.104315315299.314289.7320.096315
0.84317.08320.8320.2320.2317.912315322.1320.2
0.86321.7325.828322.7322.7322.05322.7326.372322.7
0.88328.14344.528329.5329.5328.956329.5336.572351.6
0.9351.6359.7351.6356.1352.5351.6352.5360.6
0.92364.92384.696382.2382.2366.648360.6400.504382.2
0.94390.52414.016403403391.768382.2424.384403
0.96422.44451.416435.4435.4423.736435.4447.984464
0.98458.28467.744464464458.852464465.056468.8


Frequency Table (Histogram)
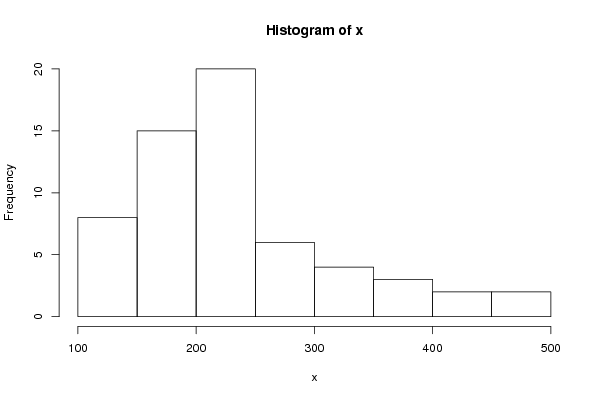
BinsMidpointAbs. FrequencyRel. FrequencyCumul. Rel. Freq.Density
[100,150[12580.1333330.1333330.002667
[150,200[175150.250.3833330.005
[200,250[225200.3333330.7166670.006667
[250,300[27560.10.8166670.002
[300,350[32540.0666670.8833330.001333
[350,400[37530.050.9333330.001
[400,450[42520.0333330.9666670.000667
[450,500]47520.03333310.000667

\begin{tabular}{lllllllll}
\hline
Frequency Table (Histogram) \tabularnewline
Bins & Midpoint & Abs. Frequency & Rel. Frequency & Cumul. Rel. Freq. & Density \tabularnewline
[100,150[ & 125 & 8 & 0.133333 & 0.133333 & 0.002667 \tabularnewline
[150,200[ & 175 & 15 & 0.25 & 0.383333 & 0.005 \tabularnewline
[200,250[ & 225 & 20 & 0.333333 & 0.716667 & 0.006667 \tabularnewline
[250,300[ & 275 & 6 & 0.1 & 0.816667 & 0.002 \tabularnewline
[300,350[ & 325 & 4 & 0.066667 & 0.883333 & 0.001333 \tabularnewline
[350,400[ & 375 & 3 & 0.05 & 0.933333 & 0.001 \tabularnewline
[400,450[ & 425 & 2 & 0.033333 & 0.966667 & 0.000667 \tabularnewline
[450,500] & 475 & 2 & 0.033333 & 1 & 0.000667 \tabularnewline
\hline
\end{tabular}
%Source: https://freestatistics.org/blog/index.php?pk=67232&T=4

[TABLE]
[ROW][C]Frequency Table (Histogram)[/C][/ROW]
[ROW][C]Bins[/C][C]Midpoint[/C][C]Abs. Frequency[/C][C]Rel. Frequency[/C][C]Cumul. Rel. Freq.[/C][C]Density[/C][/ROW]
[ROW][C][100,150[[/C][C]125[/C][C]8[/C][C]0.133333[/C][C]0.133333[/C][C]0.002667[/C][/ROW]
[ROW][C][150,200[[/C][C]175[/C][C]15[/C][C]0.25[/C][C]0.383333[/C][C]0.005[/C][/ROW]
[ROW][C][200,250[[/C][C]225[/C][C]20[/C][C]0.333333[/C][C]0.716667[/C][C]0.006667[/C][/ROW]
[ROW][C][250,300[[/C][C]275[/C][C]6[/C][C]0.1[/C][C]0.816667[/C][C]0.002[/C][/ROW]
[ROW][C][300,350[[/C][C]325[/C][C]4[/C][C]0.066667[/C][C]0.883333[/C][C]0.001333[/C][/ROW]
[ROW][C][350,400[[/C][C]375[/C][C]3[/C][C]0.05[/C][C]0.933333[/C][C]0.001[/C][/ROW]
[ROW][C][400,450[[/C][C]425[/C][C]2[/C][C]0.033333[/C][C]0.966667[/C][C]0.000667[/C][/ROW]
[ROW][C][450,500][/C][C]475[/C][C]2[/C][C]0.033333[/C][C]1[/C][C]0.000667[/C][/ROW]
[/TABLE]
Source: https://freestatistics.org/blog/index.php?pk=67232&T=4

Globally Unique Identifier (entire table): ba.freestatistics.org/blog/index.php?pk=67232&T=4

As an alternative you can also use a QR Code:  

The GUIDs for individual cells are displayed in the table below:

Frequency Table (Histogram)
BinsMidpointAbs. FrequencyRel. FrequencyCumul. Rel. Freq.Density
[100,150[12580.1333330.1333330.002667
[150,200[175150.250.3833330.005
[200,250[225200.3333330.7166670.006667
[250,300[27560.10.8166670.002
[300,350[32540.0666670.8833330.001333
[350,400[37530.050.9333330.001
[400,450[42520.0333330.9666670.000667
[450,500]47520.03333310.000667


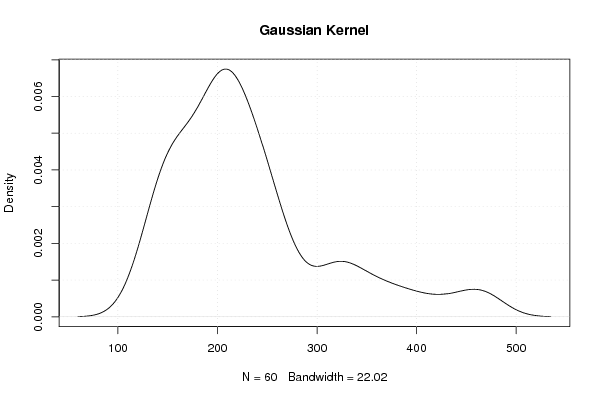
Properties of Density Trace
Bandwidth22.0185357087039
#Observations60

\begin{tabular}{lllllllll}
\hline
Properties of Density Trace \tabularnewline
Bandwidth & 22.0185357087039 \tabularnewline
#Observations & 60 \tabularnewline
\hline
\end{tabular}
%Source: https://freestatistics.org/blog/index.php?pk=67232&T=5

[TABLE]
[ROW][C]Properties of Density Trace[/C][/ROW]
[ROW][C]Bandwidth[/C][C]22.0185357087039[/C][/ROW]
[ROW][C]#Observations[/C][C]60[/C][/ROW]
[/TABLE]
Source: https://freestatistics.org/blog/index.php?pk=67232&T=5

Globally Unique Identifier (entire table): ba.freestatistics.org/blog/index.php?pk=67232&T=5

As an alternative you can also use a QR Code:  

The GUIDs for individual cells are displayed in the table below:

Properties of Density Trace
Bandwidth22.0185357087039
#Observations60


Parameters (Session):
Parameters (R input):
R code (references can be found in the software module):
load(file='createtable')
x <-sort(x[!is.na(x)])
num <- 50
res <- array(NA,dim=c(num,3))
geomean <- function(x) {
return(exp(mean(log(x))))
}
harmean <- function(x) {
return(1/mean(1/x))
}
quamean <- function(x) {
return(sqrt(mean(x*x)))
}
winmean <- function(x) {
x <-sort(x[!is.na(x)])
n<-length(x)
denom <- 3
nodenom <- n/denom
if (nodenom>40) denom <- n/40
sqrtn = sqrt(n)
roundnodenom = floor(nodenom)
win <- array(NA,dim=c(roundnodenom,2))
for (j in 1:roundnodenom) {
win[j,1] <- (j*x[j+1]+sum(x[(j+1):(n-j)])+j*x[n-j])/n
win[j,2] <- sd(c(rep(x[j+1],j),x[(j+1):(n-j)],rep(x[n-j],j)))/sqrtn
}
return(win)
}
trimean <- function(x) {
x <-sort(x[!is.na(x)])
n<-length(x)
denom <- 3
nodenom <- n/denom
if (nodenom>40) denom <- n/40
sqrtn = sqrt(n)
roundnodenom = floor(nodenom)
tri <- array(NA,dim=c(roundnodenom,2))
for (j in 1:roundnodenom) {
tri[j,1] <- mean(x,trim=j/n)
tri[j,2] <- sd(x[(j+1):(n-j)]) / sqrt(n-j*2)
}
return(tri)
}
midrange <- function(x) {
return((max(x)+min(x))/2)
}
q1 <- function(data,n,p,i,f) {
np <- n*p;
i <<- floor(np)
f <<- np - i
qvalue <- (1-f)*data[i] + f*data[i+1]
}
q2 <- function(data,n,p,i,f) {
np <- (n+1)*p
i <<- floor(np)
f <<- np - i
qvalue <- (1-f)*data[i] + f*data[i+1]
}
q3 <- function(data,n,p,i,f) {
np <- n*p
i <<- floor(np)
f <<- np - i
if (f==0) {
qvalue <- data[i]
} else {
qvalue <- data[i+1]
}
}
q4 <- function(data,n,p,i,f) {
np <- n*p
i <<- floor(np)
f <<- np - i
if (f==0) {
qvalue <- (data[i]+data[i+1])/2
} else {
qvalue <- data[i+1]
}
}
q5 <- function(data,n,p,i,f) {
np <- (n-1)*p
i <<- floor(np)
f <<- np - i
if (f==0) {
qvalue <- data[i+1]
} else {
qvalue <- data[i+1] + f*(data[i+2]-data[i+1])
}
}
q6 <- function(data,n,p,i,f) {
np <- n*p+0.5
i <<- floor(np)
f <<- np - i
qvalue <- data[i]
}
q7 <- function(data,n,p,i,f) {
np <- (n+1)*p
i <<- floor(np)
f <<- np - i
if (f==0) {
qvalue <- data[i]
} else {
qvalue <- f*data[i] + (1-f)*data[i+1]
}
}
q8 <- function(data,n,p,i,f) {
np <- (n+1)*p
i <<- floor(np)
f <<- np - i
if (f==0) {
qvalue <- data[i]
} else {
if (f == 0.5) {
qvalue <- (data[i]+data[i+1])/2
} else {
if (f < 0.5) {
qvalue <- data[i]
} else {
qvalue <- data[i+1]
}
}
}
}
iqd <- function(x,def) {
x <-sort(x[!is.na(x)])
n<-length(x)
if (def==1) {
qvalue1 <- q1(x,n,0.25,i,f)
qvalue3 <- q1(x,n,0.75,i,f)
}
if (def==2) {
qvalue1 <- q2(x,n,0.25,i,f)
qvalue3 <- q2(x,n,0.75,i,f)
}
if (def==3) {
qvalue1 <- q3(x,n,0.25,i,f)
qvalue3 <- q3(x,n,0.75,i,f)
}
if (def==4) {
qvalue1 <- q4(x,n,0.25,i,f)
qvalue3 <- q4(x,n,0.75,i,f)
}
if (def==5) {
qvalue1 <- q5(x,n,0.25,i,f)
qvalue3 <- q5(x,n,0.75,i,f)
}
if (def==6) {
qvalue1 <- q6(x,n,0.25,i,f)
qvalue3 <- q6(x,n,0.75,i,f)
}
if (def==7) {
qvalue1 <- q7(x,n,0.25,i,f)
qvalue3 <- q7(x,n,0.75,i,f)
}
if (def==8) {
qvalue1 <- q8(x,n,0.25,i,f)
qvalue3 <- q8(x,n,0.75,i,f)
}
iqdiff <- qvalue3 - qvalue1
return(c(iqdiff,iqdiff/2,iqdiff/(qvalue3 + qvalue1)))
}
midmean <- function(x,def) {
x <-sort(x[!is.na(x)])
n<-length(x)
if (def==1) {
qvalue1 <- q1(x,n,0.25,i,f)
qvalue3 <- q1(x,n,0.75,i,f)
}
if (def==2) {
qvalue1 <- q2(x,n,0.25,i,f)
qvalue3 <- q2(x,n,0.75,i,f)
}
if (def==3) {
qvalue1 <- q3(x,n,0.25,i,f)
qvalue3 <- q3(x,n,0.75,i,f)
}
if (def==4) {
qvalue1 <- q4(x,n,0.25,i,f)
qvalue3 <- q4(x,n,0.75,i,f)
}
if (def==5) {
qvalue1 <- q5(x,n,0.25,i,f)
qvalue3 <- q5(x,n,0.75,i,f)
}
if (def==6) {
qvalue1 <- q6(x,n,0.25,i,f)
qvalue3 <- q6(x,n,0.75,i,f)
}
if (def==7) {
qvalue1 <- q7(x,n,0.25,i,f)
qvalue3 <- q7(x,n,0.75,i,f)
}
if (def==8) {
qvalue1 <- q8(x,n,0.25,i,f)
qvalue3 <- q8(x,n,0.75,i,f)
}
midm <- 0
myn <- 0
roundno4 <- round(n/4)
round3no4 <- round(3*n/4)
for (i in 1:n) {
if ((x[i]>=qvalue1) & (x[i]<=qvalue3)){
midm = midm + x[i]
myn = myn + 1
}
}
midm = midm / myn
return(midm)
}
range <- max(x) - min(x)
lx <- length(x)
biasf <- (lx-1)/lx
varx <- var(x)
bvarx <- varx*biasf
sdx <- sqrt(varx)
mx <- mean(x)
bsdx <- sqrt(bvarx)
x2 <- x*x
mse0 <- sum(x2)/lx
xmm <- x-mx
xmm2 <- xmm*xmm
msem <- sum(xmm2)/lx
axmm <- abs(x - mx)
medx <- median(x)
axmmed <- abs(x - medx)
xmmed <- x - medx
xmmed2 <- xmmed*xmmed
msemed <- sum(xmmed2)/lx
qarr <- array(NA,dim=c(8,3))
for (j in 1:8) {
qarr[j,] <- iqd(x,j)
}
sdpo <- 0
adpo <- 0
for (i in 1:(lx-1)) {
for (j in (i+1):lx) {
ldi <- x[i]-x[j]
aldi <- abs(ldi)
sdpo = sdpo + ldi * ldi
adpo = adpo + aldi
}
}
denom <- (lx*(lx-1)/2)
sdpo = sdpo / denom
adpo = adpo / denom
gmd <- 0
for (i in 1:lx) {
for (j in 1:lx) {
ldi <- abs(x[i]-x[j])
gmd = gmd + ldi
}
}
gmd <- gmd / (lx*(lx-1))
sumx <- sum(x)
pk <- x / sumx
ck <- cumsum(pk)
dk <- array(NA,dim=lx)
for (i in 1:lx) {
if (ck[i] <= 0.5) dk[i] <- ck[i] else dk[i] <- 1 - ck[i]
}
bigd <- sum(dk) * 2 / (lx-1)
iod <- 1 - sum(pk*pk)
res[1,] <- c('Absolute range','absolute.htm', range)
res[2,] <- c('Relative range (unbiased)','relative.htm', range/sd(x))
res[3,] <- c('Relative range (biased)','relative.htm', range/sqrt(varx*biasf))
res[4,] <- c('Variance (unbiased)','unbiased.htm', varx)
res[5,] <- c('Variance (biased)','biased.htm', bvarx)
res[6,] <- c('Standard Deviation (unbiased)','unbiased1.htm', sdx)
res[7,] <- c('Standard Deviation (biased)','biased1.htm', bsdx)
res[8,] <- c('Coefficient of Variation (unbiased)','variation.htm', sdx/mx)
res[9,] <- c('Coefficient of Variation (biased)','variation.htm', bsdx/mx)
res[10,] <- c('Mean Squared Error (MSE versus 0)','mse.htm', mse0)
res[11,] <- c('Mean Squared Error (MSE versus Mean)','mse.htm', msem)
res[12,] <- c('Mean Absolute Deviation from Mean (MAD Mean)', 'mean2.htm', sum(axmm)/lx)
res[13,] <- c('Mean Absolute Deviation from Median (MAD Median)', 'median1.htm', sum(axmmed)/lx)
res[14,] <- c('Median Absolute Deviation from Mean', 'mean3.htm', median(axmm))
res[15,] <- c('Median Absolute Deviation from Median', 'median2.htm', median(axmmed))
res[16,] <- c('Mean Squared Deviation from Mean', 'mean1.htm', msem)
res[17,] <- c('Mean Squared Deviation from Median', 'median.htm', msemed)
mylink1 <- hyperlink('difference.htm','Interquartile Difference','')
mylink2 <- paste(mylink1,hyperlink('method_1.htm','(Weighted Average at Xnp)',''),sep=' ')
res[18,] <- c('', mylink2, qarr[1,1])
mylink2 <- paste(mylink1,hyperlink('method_2.htm','(Weighted Average at X(n+1)p)',''),sep=' ')
res[19,] <- c('', mylink2, qarr[2,1])
mylink2 <- paste(mylink1,hyperlink('method_3.htm','(Empirical Distribution Function)',''),sep=' ')
res[20,] <- c('', mylink2, qarr[3,1])
mylink2 <- paste(mylink1,hyperlink('method_4.htm','(Empirical Distribution Function - Averaging)',''),sep=' ')
res[21,] <- c('', mylink2, qarr[4,1])
mylink2 <- paste(mylink1,hyperlink('method_5.htm','(Empirical Distribution Function - Interpolation)',''),sep=' ')
res[22,] <- c('', mylink2, qarr[5,1])
mylink2 <- paste(mylink1,hyperlink('method_6.htm','(Closest Observation)',''),sep=' ')
res[23,] <- c('', mylink2, qarr[6,1])
mylink2 <- paste(mylink1,hyperlink('method_7.htm','(True Basic - Statistics Graphics Toolkit)',''),sep=' ')
res[24,] <- c('', mylink2, qarr[7,1])
mylink2 <- paste(mylink1,hyperlink('method_8.htm','(MS Excel (old versions))',''),sep=' ')
res[25,] <- c('', mylink2, qarr[8,1])
mylink1 <- hyperlink('deviation.htm','Semi Interquartile Difference','')
mylink2 <- paste(mylink1,hyperlink('method_1.htm','(Weighted Average at Xnp)',''),sep=' ')
res[26,] <- c('', mylink2, qarr[1,2])
mylink2 <- paste(mylink1,hyperlink('method_2.htm','(Weighted Average at X(n+1)p)',''),sep=' ')
res[27,] <- c('', mylink2, qarr[2,2])
mylink2 <- paste(mylink1,hyperlink('method_3.htm','(Empirical Distribution Function)',''),sep=' ')
res[28,] <- c('', mylink2, qarr[3,2])
mylink2 <- paste(mylink1,hyperlink('method_4.htm','(Empirical Distribution Function - Averaging)',''),sep=' ')
res[29,] <- c('', mylink2, qarr[4,2])
mylink2 <- paste(mylink1,hyperlink('method_5.htm','(Empirical Distribution Function - Interpolation)',''),sep=' ')
res[30,] <- c('', mylink2, qarr[5,2])
mylink2 <- paste(mylink1,hyperlink('method_6.htm','(Closest Observation)',''),sep=' ')
res[31,] <- c('', mylink2, qarr[6,2])
mylink2 <- paste(mylink1,hyperlink('method_7.htm','(True Basic - Statistics Graphics Toolkit)',''),sep=' ')
res[32,] <- c('', mylink2, qarr[7,2])
mylink2 <- paste(mylink1,hyperlink('method_8.htm','(MS Excel (old versions))',''),sep=' ')
res[33,] <- c('', mylink2, qarr[8,2])
mylink1 <- hyperlink('variation1.htm','Coefficient of Quartile Variation','')
mylink2 <- paste(mylink1,hyperlink('method_1.htm','(Weighted Average at Xnp)',''),sep=' ')
res[34,] <- c('', mylink2, qarr[1,3])
mylink2 <- paste(mylink1,hyperlink('method_2.htm','(Weighted Average at X(n+1)p)',''),sep=' ')
res[35,] <- c('', mylink2, qarr[2,3])
mylink2 <- paste(mylink1,hyperlink('method_3.htm','(Empirical Distribution Function)',''),sep=' ')
res[36,] <- c('', mylink2, qarr[3,3])
mylink2 <- paste(mylink1,hyperlink('method_4.htm','(Empirical Distribution Function - Averaging)',''),sep=' ')
res[37,] <- c('', mylink2, qarr[4,3])
mylink2 <- paste(mylink1,hyperlink('method_5.htm','(Empirical Distribution Function - Interpolation)',''),sep=' ')
res[38,] <- c('', mylink2, qarr[5,3])
mylink2 <- paste(mylink1,hyperlink('method_6.htm','(Closest Observation)',''),sep=' ')
res[39,] <- c('', mylink2, qarr[6,3])
mylink2 <- paste(mylink1,hyperlink('method_7.htm','(True Basic - Statistics Graphics Toolkit)',''),sep=' ')
res[40,] <- c('', mylink2, qarr[7,3])
mylink2 <- paste(mylink1,hyperlink('method_8.htm','(MS Excel (old versions))',''),sep=' ')
res[41,] <- c('', mylink2, qarr[8,3])
res[42,] <- c('Number of all Pairs of Observations', 'pair_numbers.htm', lx*(lx-1)/2)
res[43,] <- c('Squared Differences between all Pairs of Observations', 'squared_differences.htm', sdpo)
res[44,] <- c('Mean Absolute Differences between all Pairs of Observations', 'mean_abs_differences.htm', adpo)
res[45,] <- c('Gini Mean Difference', 'gini_mean_difference.htm', gmd)
res[46,] <- c('Leik Measure of Dispersion', 'leiks_d.htm', bigd)
res[47,] <- c('Index of Diversity', 'diversity.htm', iod)
res[48,] <- c('Index of Qualitative Variation', 'qualitative_variation.htm', iod*lx/(lx-1))
res[49,] <- c('Coefficient of Dispersion', 'dispersion.htm', sum(axmm)/lx/medx)
res[50,] <- c('Observations', '', lx)
res
(arm <- mean(x))
sqrtn <- sqrt(length(x))
(armse <- sd(x) / sqrtn)
(armose <- arm / armse)
(geo <- geomean(x))
(har <- harmean(x))
(qua <- quamean(x))
(win <- winmean(x))
(tri <- trimean(x))
(midr <- midrange(x))
midm <- array(NA,dim=8)
for (j in 1:8) midm[j] <- midmean(x,j)
midm
bitmap(file='test1.png')
lb <- win[,1] - 2*win[,2]
ub <- win[,1] + 2*win[,2]
if ((ylimmin == '') | (ylimmax == '')) plot(win[,1],type='b',main='Robustness of Central Tendency', xlab='j', pch=19, ylab='Winsorized Mean(j/n)', ylim=c(min(lb),max(ub))) else plot(win[,1],type='l',main='Robustness of Central Tendency', xlab='j', pch=19, ylab='Winsorized Mean(j/n)', ylim=c(ylimmin,ylimmax))
lines(ub,lty=3)
lines(lb,lty=3)
grid()
dev.off()
bitmap(file='test2.png')
lb <- tri[,1] - 2*tri[,2]
ub <- tri[,1] + 2*tri[,2]
if ((ylimmin == '') | (ylimmax == '')) plot(tri[,1],type='b',main='Robustness of Central Tendency', xlab='j', pch=19, ylab='Trimmed Mean(j/n)', ylim=c(min(lb),max(ub))) else plot(tri[,1],type='l',main='Robustness of Central Tendency', xlab='j', pch=19, ylab='Trimmed Mean(j/n)', ylim=c(ylimmin,ylimmax))
lines(ub,lty=3)
lines(lb,lty=3)
grid()
dev.off()
a<-table.start()
a<-table.row.start(a)
a<-table.element(a,'Central Tendency - Ungrouped Data',4,TRUE)
a<-table.row.end(a)
a<-table.row.start(a)
a<-table.element(a,'Measure',header=TRUE)
a<-table.element(a,'Value',header=TRUE)
a<-table.element(a,'S.E.',header=TRUE)
a<-table.element(a,'Value/S.E.',header=TRUE)
a<-table.row.end(a)
a<-table.row.start(a)
a<-table.element(a,hyperlink('arithmetic_mean.htm', 'Arithmetic Mean', 'click to view the definition of the Arithmetic Mean'),header=TRUE)
a<-table.element(a,arm)
a<-table.element(a,hyperlink('arithmetic_mean_standard_error.htm', armse, 'click to view the definition of the Standard Error of the Arithmetic Mean'))
a<-table.element(a,armose)
a<-table.row.end(a)
a<-table.row.start(a)
a<-table.element(a,hyperlink('geometric_mean.htm', 'Geometric Mean', 'click to view the definition of the Geometric Mean'),header=TRUE)
a<-table.element(a,geo)
a<-table.element(a,'')
a<-table.row.end(a)
a<-table.row.start(a)
a<-table.element(a,hyperlink('harmonic_mean.htm', 'Harmonic Mean', 'click to view the definition of the Harmonic Mean'),header=TRUE)
a<-table.element(a,har)
a<-table.element(a,'')
a<-table.row.end(a)
a<-table.row.start(a)
a<-table.element(a,hyperlink('quadratic_mean.htm', 'Quadratic Mean', 'click to view the definition of the Quadratic Mean'),header=TRUE)
a<-table.element(a,qua)
a<-table.element(a,'')
a<-table.row.end(a)
for (j in 1:length(win[,1])) {
a<-table.row.start(a)
mylabel <- paste('Winsorized Mean (',j)
mylabel <- paste(mylabel,'/')
mylabel <- paste(mylabel,length(win[,1]))
mylabel <- paste(mylabel,')')
a<-table.element(a,hyperlink('winsorized_mean.htm', mylabel, 'click to view the definition of the Winsorized Mean'),header=TRUE)
a<-table.element(a,win[j,1])
a<-table.element(a,win[j,2])
a<-table.element(a,win[j,1]/win[j,2])
a<-table.row.end(a)
}
for (j in 1:length(tri[,1])) {
a<-table.row.start(a)
mylabel <- paste('Trimmed Mean (',j)
mylabel <- paste(mylabel,'/')
mylabel <- paste(mylabel,length(tri[,1]))
mylabel <- paste(mylabel,')')
a<-table.element(a,hyperlink('arithmetic_mean.htm', mylabel, 'click to view the definition of the Trimmed Mean'),header=TRUE)
a<-table.element(a,tri[j,1])
a<-table.element(a,tri[j,2])
a<-table.element(a,tri[j,1]/tri[j,2])
a<-table.row.end(a)
}
a<-table.row.start(a)
a<-table.element(a,hyperlink('median_1.htm', 'Median', 'click to view the definition of the Median'),header=TRUE)
a<-table.element(a,median(x))
a<-table.element(a,'')
a<-table.row.end(a)
a<-table.row.start(a)
a<-table.element(a,hyperlink('midrange.htm', 'Midrange', 'click to view the definition of the Midrange'),header=TRUE)
a<-table.element(a,midr)
a<-table.element(a,'')
a<-table.row.end(a)
a<-table.row.start(a)
mymid <- hyperlink('midmean.htm', 'Midmean', 'click to view the definition of the Midmean')
mylabel <- paste(mymid,hyperlink('method_1.htm','Weighted Average at Xnp',''),sep=' - ')
a<-table.element(a,mylabel,header=TRUE)
a<-table.element(a,midm[1])
a<-table.element(a,'')
a<-table.row.end(a)
a<-table.row.start(a)
mymid <- hyperlink('midmean.htm', 'Midmean', 'click to view the definition of the Midmean')
mylabel <- paste(mymid,hyperlink('method_2.htm','Weighted Average at X(n+1)p',''),sep=' - ')
a<-table.element(a,mylabel,header=TRUE)
a<-table.element(a,midm[2])
a<-table.element(a,'')
a<-table.row.end(a)
a<-table.row.start(a)
mymid <- hyperlink('midmean.htm', 'Midmean', 'click to view the definition of the Midmean')
mylabel <- paste(mymid,hyperlink('method_3.htm','Empirical Distribution Function',''),sep=' - ')
a<-table.element(a,mylabel,header=TRUE)
a<-table.element(a,midm[3])
a<-table.element(a,'')
a<-table.row.end(a)
a<-table.row.start(a)
mymid <- hyperlink('midmean.htm', 'Midmean', 'click to view the definition of the Midmean')
mylabel <- paste(mymid,hyperlink('method_4.htm','Empirical Distribution Function - Averaging',''),sep=' - ')
a<-table.element(a,mylabel,header=TRUE)
a<-table.element(a,midm[4])
a<-table.element(a,'')
a<-table.row.end(a)
a<-table.row.start(a)
mymid <- hyperlink('midmean.htm', 'Midmean', 'click to view the definition of the Midmean')
mylabel <- paste(mymid,hyperlink('method_5.htm','Empirical Distribution Function - Interpolation',''),sep=' - ')
a<-table.element(a,mylabel,header=TRUE)
a<-table.element(a,midm[5])
a<-table.element(a,'')
a<-table.row.end(a)
a<-table.row.start(a)
mymid <- hyperlink('midmean.htm', 'Midmean', 'click to view the definition of the Midmean')
mylabel <- paste(mymid,hyperlink('method_6.htm','Closest Observation',''),sep=' - ')
a<-table.element(a,mylabel,header=TRUE)
a<-table.element(a,midm[6])
a<-table.element(a,'')
a<-table.row.end(a)
a<-table.row.start(a)
mymid <- hyperlink('midmean.htm', 'Midmean', 'click to view the definition of the Midmean')
mylabel <- paste(mymid,hyperlink('method_7.htm','True Basic - Statistics Graphics Toolkit',''),sep=' - ')
a<-table.element(a,mylabel,header=TRUE)
a<-table.element(a,midm[7])
a<-table.element(a,'')
a<-table.row.end(a)
a<-table.row.start(a)
mymid <- hyperlink('midmean.htm', 'Midmean', 'click to view the definition of the Midmean')
mylabel <- paste(mymid,hyperlink('method_8.htm','MS Excel (old versions)',''),sep=' - ')
a<-table.element(a,mylabel,header=TRUE)
a<-table.element(a,midm[8])
a<-table.element(a,'')
a<-table.row.end(a)
a<-table.row.start(a)
a<-table.element(a,'Number of observations',header=TRUE)
a<-table.element(a,length(x))
a<-table.element(a,'')
a<-table.row.end(a)
a<-table.end(a)
table.save(a,file='mytable.tab')
a<-table.start()
a<-table.row.start(a)
a<-table.element(a,'Variability - Ungrouped Data',2,TRUE)
a<-table.row.end(a)
for (i in 1:num) {
a<-table.row.start(a)
if (res[i,1] != '') {
a<-table.element(a,hyperlink(res[i,2],res[i,1],''),header=TRUE)
} else {
a<-table.element(a,res[i,2],header=TRUE)
}
a<-table.element(a,res[i,3])
a<-table.row.end(a)
}
a<-table.end(a)
table.save(a,file='mytable1.tab')
lx <- length(x)
qval <- array(NA,dim=c(99,8))
mystep <- 25
mystart <- 25
if (lx>10){
mystep=10
mystart=10
}
if (lx>20){
mystep=5
mystart=5
}
if (lx>50){
mystep=2
mystart=2
}
if (lx>=100){
mystep=1
mystart=1
}
for (perc in seq(mystart,99,mystep)) {
qval[perc,1] <- q1(x,lx,perc/100,i,f)
qval[perc,2] <- q2(x,lx,perc/100,i,f)
qval[perc,3] <- q3(x,lx,perc/100,i,f)
qval[perc,4] <- q4(x,lx,perc/100,i,f)
qval[perc,5] <- q5(x,lx,perc/100,i,f)
qval[perc,6] <- q6(x,lx,perc/100,i,f)
qval[perc,7] <- q7(x,lx,perc/100,i,f)
qval[perc,8] <- q8(x,lx,perc/100,i,f)
}
bitmap(file='test3.png')
myqqnorm <- qqnorm(x,col=2)
qqline(x)
grid()
dev.off()
a<-table.start()
a<-table.row.start(a)
a<-table.element(a,'Percentiles - Ungrouped Data',9,TRUE)
a<-table.row.end(a)
a<-table.row.start(a)
a<-table.element(a,'p',1,TRUE)
a<-table.element(a,hyperlink('method_1.htm', 'Weighted Average at Xnp',''),1,TRUE)
a<-table.element(a,hyperlink('method_2.htm','Weighted Average at X(n+1)p',''),1,TRUE)
a<-table.element(a,hyperlink('method_3.htm','Empirical Distribution Function',''),1,TRUE)
a<-table.element(a,hyperlink('method_4.htm','Empirical Distribution Function - Averaging',''),1,TRUE)
a<-table.element(a,hyperlink('method_5.htm','Empirical Distribution Function - Interpolation',''),1,TRUE)
a<-table.element(a,hyperlink('method_6.htm','Closest Observation',''),1,TRUE)
a<-table.element(a,hyperlink('method_7.htm','True Basic - Statistics Graphics Toolkit',''),1,TRUE)
a<-table.element(a,hyperlink('method_8.htm','MS Excel (old versions)',''),1,TRUE)
a<-table.row.end(a)
for (perc in seq(mystart,99,mystep)) {
a<-table.row.start(a)
a<-table.element(a,round(perc/100,2),1,TRUE)
for (j in 1:8) {
a<-table.element(a,round(qval[perc,j],6))
}
a<-table.row.end(a)
}
a<-table.end(a)
table.save(a,file='mytable2.tab')
bitmap(file='histogram1.png')
myhist<-hist(x)
dev.off()
myhist
n <- length(x)
a<-table.start()
a<-table.row.start(a)
a<-table.element(a,hyperlink('histogram.htm','Frequency Table (Histogram)',''),6,TRUE)
a<-table.row.end(a)
a<-table.row.start(a)
a<-table.element(a,'Bins',header=TRUE)
a<-table.element(a,'Midpoint',header=TRUE)
a<-table.element(a,'Abs. Frequency',header=TRUE)
a<-table.element(a,'Rel. Frequency',header=TRUE)
a<-table.element(a,'Cumul. Rel. Freq.',header=TRUE)
a<-table.element(a,'Density',header=TRUE)
a<-table.row.end(a)
crf <- 0
mybracket <- '['
mynumrows <- (length(myhist$breaks)-1)
for (i in 1:mynumrows) {
a<-table.row.start(a)
if (i == 1)
dum <- paste('[',myhist$breaks[i],sep='')
else
dum <- paste(mybracket,myhist$breaks[i],sep='')
dum <- paste(dum,myhist$breaks[i+1],sep=',')
if (i==mynumrows)
dum <- paste(dum,']',sep='')
else
dum <- paste(dum,mybracket,sep='')
a<-table.element(a,dum,header=TRUE)
a<-table.element(a,myhist$mids[i])
a<-table.element(a,myhist$counts[i])
rf <- myhist$counts[i]/n
crf <- crf + rf
a<-table.element(a,round(rf,6))
a<-table.element(a,round(crf,6))
a<-table.element(a,round(myhist$density[i],6))
a<-table.row.end(a)
}
a<-table.end(a)
table.save(a,file='mytable5.tab')
bitmap(file='density1.png')
mydensity1<-density(x,kernel='gaussian',na.rm=TRUE)
plot(mydensity1,main='Gaussian Kernel')
grid()
dev.off()
mydensity1
a<-table.start()
a<-table.row.start(a)
a<-table.element(a,'Properties of Density Trace',2,TRUE)
a<-table.row.end(a)
a<-table.row.start(a)
a<-table.element(a,'Bandwidth',header=TRUE)
a<-table.element(a,mydensity1$bw)
a<-table.row.end(a)
a<-table.row.start(a)
a<-table.element(a,'#Observations',header=TRUE)
a<-table.element(a,mydensity1$n)
a<-table.row.end(a)
a<-table.end(a)
table.save(a,file='mytable4.tab')