Free Statistics

of Irreproducible Research!

Author's title

Author*The author of this computation has been verified*
R Software Modulerwasp_multipleregression.wasp
Title produced by softwareMultiple Regression
Date of computationSun, 13 Dec 2009 05:27:32 -0700
Cite this page as followsStatistical Computations at FreeStatistics.org, Office for Research Development and Education, URL https://freestatistics.org/blog/index.php?v=date/2009/Dec/13/t1260707479d8tvfh3cwnaw5x1.htm/, Retrieved Sun, 28 Apr 2024 16:58:57 +0000
Statistical Computations at FreeStatistics.org, Office for Research Development and Education, URL https://freestatistics.org/blog/index.php?pk=67243, Retrieved Sun, 28 Apr 2024 16:58:57 +0000
QR Codes:

Original text written by user:Paper: Y(t-2) met lineaire trend
IsPrivate?No (this computation is public)
User-defined keywords
Estimated Impact147
Family? (F = Feedback message, R = changed R code, M = changed R Module, P = changed Parameters, D = changed Data)
-     [Multiple Regression] [Q1 The Seatbeltlaw] [2007-11-14 19:27:43] [8cd6641b921d30ebe00b648d1481bba0]
- RM D  [Multiple Regression] [Seatbelt] [2009-11-12 14:14:11] [b98453cac15ba1066b407e146608df68]
-    D    [Multiple Regression] [shw7: Multiple li...] [2009-11-19 18:39:22] [3c8b83428ce260cd44df892bb7619588]
-   P         [Multiple Regression] [Paper: Y(t-2) met...] [2009-12-13 12:27:32] [7a39e26d7a09dd77604df90cb29f8d39] [Current]
-               [Multiple Regression] [Y(t-2) met lineai...] [2009-12-17 17:14:53] [1433a524809eda02c3198b3ae6eebb69]
Feedback Forum

Post a new message
Dataseries X:
0.7905	0.313	0.7744	0.779
0.7719	0.364	0.7905	0.7744
0.7811	0.363	0.7719	0.7905
0.7557	-0.155	0.7811	0.7719
0.7637	0.052	0.7557	0.7811
0.7595	0.568	0.7637	0.7557
0.7471	0.668	0.7595	0.7637
0.7615	1.378	0.7471	0.7595
0.7487	0.252	0.7615	0.7471
0.7389	-0.402	0.7487	0.7615
0.7337	-0.05	0.7389	0.7487
0.751	0.555	0.7337	0.7389
0.7382	0.05	0.751	0.7337
0.7159	0.15	0.7382	0.751
0.7542	0.45	0.7159	0.7382
0.7636	0.299	0.7542	0.7159
0.7433	0.199	0.7636	0.7542
0.7658	0.496	0.7433	0.7636
0.7627	0.444	0.7658	0.7433
0.748	-0.393	0.7627	0.7658
0.7692	-0.444	0.748	0.7627
0.785	0.198	0.7692	0.748
0.7913	0.494	0.785	0.7692
0.772	0.133	0.7913	0.785
0.788	0.388	0.772	0.7913
0.807	0.484	0.788	0.772
0.8268	0.278	0.807	0.788
0.8244	0.369	0.8268	0.807
0.8487	0.165	0.8244	0.8268
0.8572	0.155	0.8487	0.8244
0.8214	0.087	0.8572	0.8487
0.8827	0.414	0.8214	0.8572
0.9216	0.36	0.8827	0.8214
0.8865	0.975	0.9216	0.8827
0.8816	0.27	0.8865	0.9216
0.8884	0.359	0.8816	0.8865
0.9466	0.169	0.8884	0.8816
0.918	0.381	0.9466	0.8884
0.9337	0.154	0.918	0.9466
0.9559	0.486	0.9337	0.918
0.9626	0.925	0.9559	0.9337
0.9434	0.728	0.9626	0.9559
0.8639	-0.014	0.9434	0.9626
0.7996	0.046	0.8639	0.9434
0.668	-0.819	0.7996	0.8639
0.6572	-1.674	0.668	0.7996
0.6928	-0.788	0.6572	0.668
0.6438	0.279	0.6928	0.6572
0.6454	0.396	0.6438	0.6928
0.6873	-0.141	0.6454	0.6438
0.7265	-0.019	0.6873	0.6454
0.7912	0.099	0.7265	0.6873
0.8114	0.742	0.7912	0.7265
0.8281	0.005	0.8114	0.7912
0.8393	0.448	0.8281	0.8114


Summary of computational transaction
Raw Inputview raw input (R code)
Raw Outputview raw output of R engine
Computing time4 seconds
R Server'Gwilym Jenkins' @ 72.249.127.135

\begin{tabular}{lllllllll}
\hline
Summary of computational transaction \tabularnewline
Raw Input & view raw input (R code)  \tabularnewline
Raw Output & view raw output of R engine  \tabularnewline
Computing time & 4 seconds \tabularnewline
R Server & 'Gwilym Jenkins' @ 72.249.127.135 \tabularnewline
\hline
\end{tabular}
%Source: https://freestatistics.org/blog/index.php?pk=67243&T=0

[TABLE]
[ROW][C]Summary of computational transaction[/C][/ROW]
[ROW][C]Raw Input[/C][C]view raw input (R code) [/C][/ROW]
[ROW][C]Raw Output[/C][C]view raw output of R engine [/C][/ROW]
[ROW][C]Computing time[/C][C]4 seconds[/C][/ROW]
[ROW][C]R Server[/C][C]'Gwilym Jenkins' @ 72.249.127.135[/C][/ROW]
[/TABLE]
Source: https://freestatistics.org/blog/index.php?pk=67243&T=0

Globally Unique Identifier (entire table): ba.freestatistics.org/blog/index.php?pk=67243&T=0

As an alternative you can also use a QR Code:  

The GUIDs for individual cells are displayed in the table below:

Summary of computational transaction
Raw Inputview raw input (R code)
Raw Outputview raw output of R engine
Computing time4 seconds
R Server'Gwilym Jenkins' @ 72.249.127.135


Multiple Linear Regression - Estimated Regression Equation
USDOLLAR[t] = + 0.111935700362069 + 0.0182913192531364Amerikaanse_inflatie[t] + 1.05085697392121`Y[t-1]`[t] -0.205313543557759`Y[t-2]`[t] + 0.000281672269563672t + e[t]

\begin{tabular}{lllllllll}
\hline
Multiple Linear Regression - Estimated Regression Equation \tabularnewline
USDOLLAR[t] =  +  0.111935700362069 +  0.0182913192531364Amerikaanse_inflatie[t] +  1.05085697392121`Y[t-1]`[t] -0.205313543557759`Y[t-2]`[t] +  0.000281672269563672t  + e[t] \tabularnewline
\hline
\end{tabular}
%Source: https://freestatistics.org/blog/index.php?pk=67243&T=1

[TABLE]
[ROW][C]Multiple Linear Regression - Estimated Regression Equation[/C][/ROW]
[ROW][C]USDOLLAR[t] =  +  0.111935700362069 +  0.0182913192531364Amerikaanse_inflatie[t] +  1.05085697392121`Y[t-1]`[t] -0.205313543557759`Y[t-2]`[t] +  0.000281672269563672t  + e[t][/C][/ROW]
[/TABLE]
Source: https://freestatistics.org/blog/index.php?pk=67243&T=1

Globally Unique Identifier (entire table): ba.freestatistics.org/blog/index.php?pk=67243&T=1

As an alternative you can also use a QR Code:  

The GUIDs for individual cells are displayed in the table below:

Multiple Linear Regression - Estimated Regression Equation
USDOLLAR[t] = + 0.111935700362069 + 0.0182913192531364Amerikaanse_inflatie[t] + 1.05085697392121`Y[t-1]`[t] -0.205313543557759`Y[t-2]`[t] + 0.000281672269563672t + e[t]


Multiple Linear Regression - Ordinary Least Squares
VariableParameterS.D.T-STATH0: parameter = 02-tail p-value1-tail p-value
(Intercept)0.1119357003620690.045812.44350.018120.00906
Amerikaanse_inflatie0.01829131925313640.0118451.54420.1288490.064425
`Y[t-1]`1.050856973921210.1611946.519200
`Y[t-2]`-0.2053135435577590.149834-1.37030.1767240.088362
t0.0002816722695636720.0002880.97950.3320440.166022

\begin{tabular}{lllllllll}
\hline
Multiple Linear Regression - Ordinary Least Squares \tabularnewline
Variable & Parameter & S.D. & T-STATH0: parameter = 0 & 2-tail p-value & 1-tail p-value \tabularnewline
(Intercept) & 0.111935700362069 & 0.04581 & 2.4435 & 0.01812 & 0.00906 \tabularnewline
Amerikaanse_inflatie & 0.0182913192531364 & 0.011845 & 1.5442 & 0.128849 & 0.064425 \tabularnewline
`Y[t-1]` & 1.05085697392121 & 0.161194 & 6.5192 & 0 & 0 \tabularnewline
`Y[t-2]` & -0.205313543557759 & 0.149834 & -1.3703 & 0.176724 & 0.088362 \tabularnewline
t & 0.000281672269563672 & 0.000288 & 0.9795 & 0.332044 & 0.166022 \tabularnewline
\hline
\end{tabular}
%Source: https://freestatistics.org/blog/index.php?pk=67243&T=2

[TABLE]
[ROW][C]Multiple Linear Regression - Ordinary Least Squares[/C][/ROW]
[ROW][C]Variable[/C][C]Parameter[/C][C]S.D.[/C][C]T-STATH0: parameter = 0[/C][C]2-tail p-value[/C][C]1-tail p-value[/C][/ROW]
[ROW][C](Intercept)[/C][C]0.111935700362069[/C][C]0.04581[/C][C]2.4435[/C][C]0.01812[/C][C]0.00906[/C][/ROW]
[ROW][C]Amerikaanse_inflatie[/C][C]0.0182913192531364[/C][C]0.011845[/C][C]1.5442[/C][C]0.128849[/C][C]0.064425[/C][/ROW]
[ROW][C]`Y[t-1]`[/C][C]1.05085697392121[/C][C]0.161194[/C][C]6.5192[/C][C]0[/C][C]0[/C][/ROW]
[ROW][C]`Y[t-2]`[/C][C]-0.205313543557759[/C][C]0.149834[/C][C]-1.3703[/C][C]0.176724[/C][C]0.088362[/C][/ROW]
[ROW][C]t[/C][C]0.000281672269563672[/C][C]0.000288[/C][C]0.9795[/C][C]0.332044[/C][C]0.166022[/C][/ROW]
[/TABLE]
Source: https://freestatistics.org/blog/index.php?pk=67243&T=2

Globally Unique Identifier (entire table): ba.freestatistics.org/blog/index.php?pk=67243&T=2

As an alternative you can also use a QR Code:  

The GUIDs for individual cells are displayed in the table below:

Multiple Linear Regression - Ordinary Least Squares
VariableParameterS.D.T-STATH0: parameter = 02-tail p-value1-tail p-value
(Intercept)0.1119357003620690.045812.44350.018120.00906
Amerikaanse_inflatie0.01829131925313640.0118451.54420.1288490.064425
`Y[t-1]`1.050856973921210.1611946.519200
`Y[t-2]`-0.2053135435577590.149834-1.37030.1767240.088362
t0.0002816722695636720.0002880.97950.3320440.166022


Multiple Linear Regression - Regression Statistics
Multiple R0.924271488211047
R-squared0.854277783919864
Adjusted R-squared0.842620006633453
F-TEST (value)73.2796452472692
F-TEST (DF numerator)4
F-TEST (DF denominator)50
p-value0
Multiple Linear Regression - Residual Statistics
Residual Standard Deviation0.0317330932234768
Sum Squared Residuals0.0503494602764936

\begin{tabular}{lllllllll}
\hline
Multiple Linear Regression - Regression Statistics \tabularnewline
Multiple R & 0.924271488211047 \tabularnewline
R-squared & 0.854277783919864 \tabularnewline
Adjusted R-squared & 0.842620006633453 \tabularnewline
F-TEST (value) & 73.2796452472692 \tabularnewline
F-TEST (DF numerator) & 4 \tabularnewline
F-TEST (DF denominator) & 50 \tabularnewline
p-value & 0 \tabularnewline
Multiple Linear Regression - Residual Statistics \tabularnewline
Residual Standard Deviation & 0.0317330932234768 \tabularnewline
Sum Squared Residuals & 0.0503494602764936 \tabularnewline
\hline
\end{tabular}
%Source: https://freestatistics.org/blog/index.php?pk=67243&T=3

[TABLE]
[ROW][C]Multiple Linear Regression - Regression Statistics[/C][/ROW]
[ROW][C]Multiple R[/C][C]0.924271488211047[/C][/ROW]
[ROW][C]R-squared[/C][C]0.854277783919864[/C][/ROW]
[ROW][C]Adjusted R-squared[/C][C]0.842620006633453[/C][/ROW]
[ROW][C]F-TEST (value)[/C][C]73.2796452472692[/C][/ROW]
[ROW][C]F-TEST (DF numerator)[/C][C]4[/C][/ROW]
[ROW][C]F-TEST (DF denominator)[/C][C]50[/C][/ROW]
[ROW][C]p-value[/C][C]0[/C][/ROW]
[ROW][C]Multiple Linear Regression - Residual Statistics[/C][/ROW]
[ROW][C]Residual Standard Deviation[/C][C]0.0317330932234768[/C][/ROW]
[ROW][C]Sum Squared Residuals[/C][C]0.0503494602764936[/C][/ROW]
[/TABLE]
Source: https://freestatistics.org/blog/index.php?pk=67243&T=3

Globally Unique Identifier (entire table): ba.freestatistics.org/blog/index.php?pk=67243&T=3

As an alternative you can also use a QR Code:  

The GUIDs for individual cells are displayed in the table below:

Multiple Linear Regression - Regression Statistics
Multiple R0.924271488211047
R-squared0.854277783919864
Adjusted R-squared0.842620006633453
F-TEST (value)73.2796452472692
F-TEST (DF numerator)4
F-TEST (DF denominator)50
p-value0
Multiple Linear Regression - Residual Statistics
Residual Standard Deviation0.0317330932234768
Sum Squared Residuals0.0503494602764936


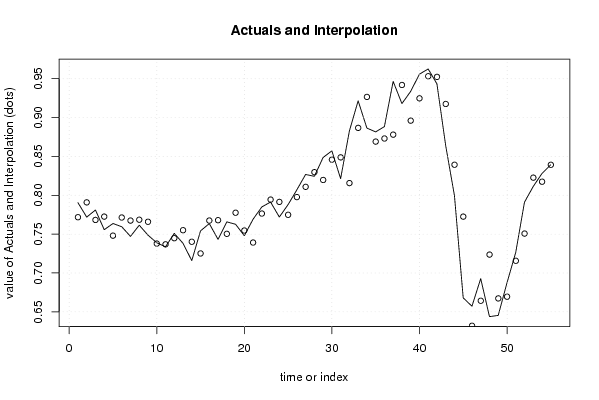
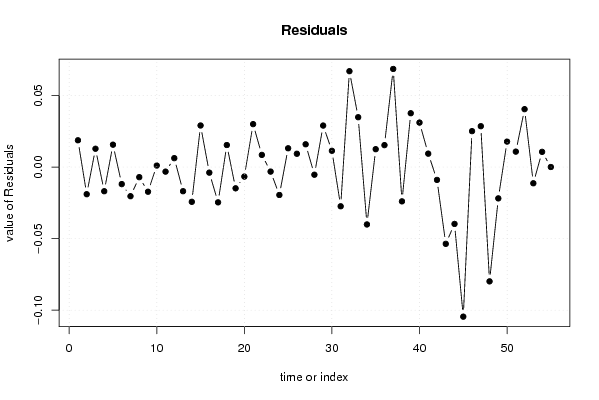
Multiple Linear Regression - Actuals, Interpolation, and Residuals
Time or IndexActualsInterpolationForecastResidualsPrediction Error
10.79050.7717869457309560.0187130542690440
20.77190.790864714862925-0.0189647148629254
30.78110.7682766080470220.0128233919529781
40.75570.77257009301371-0.0168700930137101
50.76370.7480574166303430.0156425833696571
60.75950.771399229432262-0.0118992294322618
70.74710.767453925988208-0.0203539259882079
80.76150.768554125333818-0.00705412533381808
90.74870.765918000488932-0.0172180004889317
100.73890.7378296656735210.00107033432647899
110.73370.7368794973333-0.0031794973333001
120.7510.7447750342134870.00622496578651287
130.73820.755067046335554-0.0168670463355542
140.71590.74017495696069-0.0242749569606907
150.75420.7251379278452920.0290620721547083
160.76360.767483925030152-0.00388392503015215
170.74330.767951012210999-0.0246510122109993
180.76580.7504028624187010.0153971375812990
190.76270.777545532934551-0.0148455329345513
200.7480.754640159640035-0.00664015964003453
210.76920.7391778490960750.0300221509039245
220.7850.7764988252635810.0085011747364186
230.79130.794445621096604-0.00314562109660412
240.7720.791500572063277-0.0195005720632765
250.7880.7748715158212970.0131284841787032
260.8070.7976854177125660.00931458228743438
270.82680.8108803440235620.0159196559764379
280.82440.829732537101204-0.00533253710120359
290.84870.8196955153432730.0290044846567270
300.85720.845822851391130.0113771486088707
310.82140.848803879121356-0.0274038791213563
320.88270.8157009680000760.0669990319999246
330.92160.8867626663907080.0348373336092923
340.88650.926586116066395-0.0400861160663946
350.88160.8691006316334660.0124993683665343
360.88840.8730675375232220.0153324624767778
370.94660.8780257229207870.068574277079213
380.9180.941948898658037-0.0239488986580372
390.93370.8960746837679310.0376253162320691
400.95590.924799495865850.0311005041341493
410.96260.9532166594747350.0093833405252648
420.94340.952377722909721-0.00897772290972091
430.86390.917535181652333-0.0536351816523331
440.79960.839313223686658-0.0397132236866579
450.6680.772525228091967-0.104525228091967
460.65720.6320767054828310.0251232945171685
470.69280.6642344936245260.0285655063754739
480.64380.723660898079205-0.079860898079205
490.64540.66728150082859-0.0218815008285904
500.68730.6694824694518240.0178175305481762
510.72650.7156980882078760.0108019117921236
520.79120.7507290920519510.0404709079480485
530.81140.82271423790652-0.0113142379065199
540.82810.8174587324915430.0106412675084565
550.83930.8392454370748645.45629251361077e-05

\begin{tabular}{lllllllll}
\hline
Multiple Linear Regression - Actuals, Interpolation, and Residuals \tabularnewline
Time or Index & Actuals & InterpolationForecast & ResidualsPrediction Error \tabularnewline
1 & 0.7905 & 0.771786945730956 & 0.0187130542690440 \tabularnewline
2 & 0.7719 & 0.790864714862925 & -0.0189647148629254 \tabularnewline
3 & 0.7811 & 0.768276608047022 & 0.0128233919529781 \tabularnewline
4 & 0.7557 & 0.77257009301371 & -0.0168700930137101 \tabularnewline
5 & 0.7637 & 0.748057416630343 & 0.0156425833696571 \tabularnewline
6 & 0.7595 & 0.771399229432262 & -0.0118992294322618 \tabularnewline
7 & 0.7471 & 0.767453925988208 & -0.0203539259882079 \tabularnewline
8 & 0.7615 & 0.768554125333818 & -0.00705412533381808 \tabularnewline
9 & 0.7487 & 0.765918000488932 & -0.0172180004889317 \tabularnewline
10 & 0.7389 & 0.737829665673521 & 0.00107033432647899 \tabularnewline
11 & 0.7337 & 0.7368794973333 & -0.0031794973333001 \tabularnewline
12 & 0.751 & 0.744775034213487 & 0.00622496578651287 \tabularnewline
13 & 0.7382 & 0.755067046335554 & -0.0168670463355542 \tabularnewline
14 & 0.7159 & 0.74017495696069 & -0.0242749569606907 \tabularnewline
15 & 0.7542 & 0.725137927845292 & 0.0290620721547083 \tabularnewline
16 & 0.7636 & 0.767483925030152 & -0.00388392503015215 \tabularnewline
17 & 0.7433 & 0.767951012210999 & -0.0246510122109993 \tabularnewline
18 & 0.7658 & 0.750402862418701 & 0.0153971375812990 \tabularnewline
19 & 0.7627 & 0.777545532934551 & -0.0148455329345513 \tabularnewline
20 & 0.748 & 0.754640159640035 & -0.00664015964003453 \tabularnewline
21 & 0.7692 & 0.739177849096075 & 0.0300221509039245 \tabularnewline
22 & 0.785 & 0.776498825263581 & 0.0085011747364186 \tabularnewline
23 & 0.7913 & 0.794445621096604 & -0.00314562109660412 \tabularnewline
24 & 0.772 & 0.791500572063277 & -0.0195005720632765 \tabularnewline
25 & 0.788 & 0.774871515821297 & 0.0131284841787032 \tabularnewline
26 & 0.807 & 0.797685417712566 & 0.00931458228743438 \tabularnewline
27 & 0.8268 & 0.810880344023562 & 0.0159196559764379 \tabularnewline
28 & 0.8244 & 0.829732537101204 & -0.00533253710120359 \tabularnewline
29 & 0.8487 & 0.819695515343273 & 0.0290044846567270 \tabularnewline
30 & 0.8572 & 0.84582285139113 & 0.0113771486088707 \tabularnewline
31 & 0.8214 & 0.848803879121356 & -0.0274038791213563 \tabularnewline
32 & 0.8827 & 0.815700968000076 & 0.0669990319999246 \tabularnewline
33 & 0.9216 & 0.886762666390708 & 0.0348373336092923 \tabularnewline
34 & 0.8865 & 0.926586116066395 & -0.0400861160663946 \tabularnewline
35 & 0.8816 & 0.869100631633466 & 0.0124993683665343 \tabularnewline
36 & 0.8884 & 0.873067537523222 & 0.0153324624767778 \tabularnewline
37 & 0.9466 & 0.878025722920787 & 0.068574277079213 \tabularnewline
38 & 0.918 & 0.941948898658037 & -0.0239488986580372 \tabularnewline
39 & 0.9337 & 0.896074683767931 & 0.0376253162320691 \tabularnewline
40 & 0.9559 & 0.92479949586585 & 0.0311005041341493 \tabularnewline
41 & 0.9626 & 0.953216659474735 & 0.0093833405252648 \tabularnewline
42 & 0.9434 & 0.952377722909721 & -0.00897772290972091 \tabularnewline
43 & 0.8639 & 0.917535181652333 & -0.0536351816523331 \tabularnewline
44 & 0.7996 & 0.839313223686658 & -0.0397132236866579 \tabularnewline
45 & 0.668 & 0.772525228091967 & -0.104525228091967 \tabularnewline
46 & 0.6572 & 0.632076705482831 & 0.0251232945171685 \tabularnewline
47 & 0.6928 & 0.664234493624526 & 0.0285655063754739 \tabularnewline
48 & 0.6438 & 0.723660898079205 & -0.079860898079205 \tabularnewline
49 & 0.6454 & 0.66728150082859 & -0.0218815008285904 \tabularnewline
50 & 0.6873 & 0.669482469451824 & 0.0178175305481762 \tabularnewline
51 & 0.7265 & 0.715698088207876 & 0.0108019117921236 \tabularnewline
52 & 0.7912 & 0.750729092051951 & 0.0404709079480485 \tabularnewline
53 & 0.8114 & 0.82271423790652 & -0.0113142379065199 \tabularnewline
54 & 0.8281 & 0.817458732491543 & 0.0106412675084565 \tabularnewline
55 & 0.8393 & 0.839245437074864 & 5.45629251361077e-05 \tabularnewline
\hline
\end{tabular}
%Source: https://freestatistics.org/blog/index.php?pk=67243&T=4

[TABLE]
[ROW][C]Multiple Linear Regression - Actuals, Interpolation, and Residuals[/C][/ROW]
[ROW][C]Time or Index[/C][C]Actuals[/C][C]InterpolationForecast[/C][C]ResidualsPrediction Error[/C][/ROW]
[ROW][C]1[/C][C]0.7905[/C][C]0.771786945730956[/C][C]0.0187130542690440[/C][/ROW]
[ROW][C]2[/C][C]0.7719[/C][C]0.790864714862925[/C][C]-0.0189647148629254[/C][/ROW]
[ROW][C]3[/C][C]0.7811[/C][C]0.768276608047022[/C][C]0.0128233919529781[/C][/ROW]
[ROW][C]4[/C][C]0.7557[/C][C]0.77257009301371[/C][C]-0.0168700930137101[/C][/ROW]
[ROW][C]5[/C][C]0.7637[/C][C]0.748057416630343[/C][C]0.0156425833696571[/C][/ROW]
[ROW][C]6[/C][C]0.7595[/C][C]0.771399229432262[/C][C]-0.0118992294322618[/C][/ROW]
[ROW][C]7[/C][C]0.7471[/C][C]0.767453925988208[/C][C]-0.0203539259882079[/C][/ROW]
[ROW][C]8[/C][C]0.7615[/C][C]0.768554125333818[/C][C]-0.00705412533381808[/C][/ROW]
[ROW][C]9[/C][C]0.7487[/C][C]0.765918000488932[/C][C]-0.0172180004889317[/C][/ROW]
[ROW][C]10[/C][C]0.7389[/C][C]0.737829665673521[/C][C]0.00107033432647899[/C][/ROW]
[ROW][C]11[/C][C]0.7337[/C][C]0.7368794973333[/C][C]-0.0031794973333001[/C][/ROW]
[ROW][C]12[/C][C]0.751[/C][C]0.744775034213487[/C][C]0.00622496578651287[/C][/ROW]
[ROW][C]13[/C][C]0.7382[/C][C]0.755067046335554[/C][C]-0.0168670463355542[/C][/ROW]
[ROW][C]14[/C][C]0.7159[/C][C]0.74017495696069[/C][C]-0.0242749569606907[/C][/ROW]
[ROW][C]15[/C][C]0.7542[/C][C]0.725137927845292[/C][C]0.0290620721547083[/C][/ROW]
[ROW][C]16[/C][C]0.7636[/C][C]0.767483925030152[/C][C]-0.00388392503015215[/C][/ROW]
[ROW][C]17[/C][C]0.7433[/C][C]0.767951012210999[/C][C]-0.0246510122109993[/C][/ROW]
[ROW][C]18[/C][C]0.7658[/C][C]0.750402862418701[/C][C]0.0153971375812990[/C][/ROW]
[ROW][C]19[/C][C]0.7627[/C][C]0.777545532934551[/C][C]-0.0148455329345513[/C][/ROW]
[ROW][C]20[/C][C]0.748[/C][C]0.754640159640035[/C][C]-0.00664015964003453[/C][/ROW]
[ROW][C]21[/C][C]0.7692[/C][C]0.739177849096075[/C][C]0.0300221509039245[/C][/ROW]
[ROW][C]22[/C][C]0.785[/C][C]0.776498825263581[/C][C]0.0085011747364186[/C][/ROW]
[ROW][C]23[/C][C]0.7913[/C][C]0.794445621096604[/C][C]-0.00314562109660412[/C][/ROW]
[ROW][C]24[/C][C]0.772[/C][C]0.791500572063277[/C][C]-0.0195005720632765[/C][/ROW]
[ROW][C]25[/C][C]0.788[/C][C]0.774871515821297[/C][C]0.0131284841787032[/C][/ROW]
[ROW][C]26[/C][C]0.807[/C][C]0.797685417712566[/C][C]0.00931458228743438[/C][/ROW]
[ROW][C]27[/C][C]0.8268[/C][C]0.810880344023562[/C][C]0.0159196559764379[/C][/ROW]
[ROW][C]28[/C][C]0.8244[/C][C]0.829732537101204[/C][C]-0.00533253710120359[/C][/ROW]
[ROW][C]29[/C][C]0.8487[/C][C]0.819695515343273[/C][C]0.0290044846567270[/C][/ROW]
[ROW][C]30[/C][C]0.8572[/C][C]0.84582285139113[/C][C]0.0113771486088707[/C][/ROW]
[ROW][C]31[/C][C]0.8214[/C][C]0.848803879121356[/C][C]-0.0274038791213563[/C][/ROW]
[ROW][C]32[/C][C]0.8827[/C][C]0.815700968000076[/C][C]0.0669990319999246[/C][/ROW]
[ROW][C]33[/C][C]0.9216[/C][C]0.886762666390708[/C][C]0.0348373336092923[/C][/ROW]
[ROW][C]34[/C][C]0.8865[/C][C]0.926586116066395[/C][C]-0.0400861160663946[/C][/ROW]
[ROW][C]35[/C][C]0.8816[/C][C]0.869100631633466[/C][C]0.0124993683665343[/C][/ROW]
[ROW][C]36[/C][C]0.8884[/C][C]0.873067537523222[/C][C]0.0153324624767778[/C][/ROW]
[ROW][C]37[/C][C]0.9466[/C][C]0.878025722920787[/C][C]0.068574277079213[/C][/ROW]
[ROW][C]38[/C][C]0.918[/C][C]0.941948898658037[/C][C]-0.0239488986580372[/C][/ROW]
[ROW][C]39[/C][C]0.9337[/C][C]0.896074683767931[/C][C]0.0376253162320691[/C][/ROW]
[ROW][C]40[/C][C]0.9559[/C][C]0.92479949586585[/C][C]0.0311005041341493[/C][/ROW]
[ROW][C]41[/C][C]0.9626[/C][C]0.953216659474735[/C][C]0.0093833405252648[/C][/ROW]
[ROW][C]42[/C][C]0.9434[/C][C]0.952377722909721[/C][C]-0.00897772290972091[/C][/ROW]
[ROW][C]43[/C][C]0.8639[/C][C]0.917535181652333[/C][C]-0.0536351816523331[/C][/ROW]
[ROW][C]44[/C][C]0.7996[/C][C]0.839313223686658[/C][C]-0.0397132236866579[/C][/ROW]
[ROW][C]45[/C][C]0.668[/C][C]0.772525228091967[/C][C]-0.104525228091967[/C][/ROW]
[ROW][C]46[/C][C]0.6572[/C][C]0.632076705482831[/C][C]0.0251232945171685[/C][/ROW]
[ROW][C]47[/C][C]0.6928[/C][C]0.664234493624526[/C][C]0.0285655063754739[/C][/ROW]
[ROW][C]48[/C][C]0.6438[/C][C]0.723660898079205[/C][C]-0.079860898079205[/C][/ROW]
[ROW][C]49[/C][C]0.6454[/C][C]0.66728150082859[/C][C]-0.0218815008285904[/C][/ROW]
[ROW][C]50[/C][C]0.6873[/C][C]0.669482469451824[/C][C]0.0178175305481762[/C][/ROW]
[ROW][C]51[/C][C]0.7265[/C][C]0.715698088207876[/C][C]0.0108019117921236[/C][/ROW]
[ROW][C]52[/C][C]0.7912[/C][C]0.750729092051951[/C][C]0.0404709079480485[/C][/ROW]
[ROW][C]53[/C][C]0.8114[/C][C]0.82271423790652[/C][C]-0.0113142379065199[/C][/ROW]
[ROW][C]54[/C][C]0.8281[/C][C]0.817458732491543[/C][C]0.0106412675084565[/C][/ROW]
[ROW][C]55[/C][C]0.8393[/C][C]0.839245437074864[/C][C]5.45629251361077e-05[/C][/ROW]
[/TABLE]
Source: https://freestatistics.org/blog/index.php?pk=67243&T=4

Globally Unique Identifier (entire table): ba.freestatistics.org/blog/index.php?pk=67243&T=4

As an alternative you can also use a QR Code:  

The GUIDs for individual cells are displayed in the table below:

Multiple Linear Regression - Actuals, Interpolation, and Residuals
Time or IndexActualsInterpolationForecastResidualsPrediction Error
10.79050.7717869457309560.0187130542690440
20.77190.790864714862925-0.0189647148629254
30.78110.7682766080470220.0128233919529781
40.75570.77257009301371-0.0168700930137101
50.76370.7480574166303430.0156425833696571
60.75950.771399229432262-0.0118992294322618
70.74710.767453925988208-0.0203539259882079
80.76150.768554125333818-0.00705412533381808
90.74870.765918000488932-0.0172180004889317
100.73890.7378296656735210.00107033432647899
110.73370.7368794973333-0.0031794973333001
120.7510.7447750342134870.00622496578651287
130.73820.755067046335554-0.0168670463355542
140.71590.74017495696069-0.0242749569606907
150.75420.7251379278452920.0290620721547083
160.76360.767483925030152-0.00388392503015215
170.74330.767951012210999-0.0246510122109993
180.76580.7504028624187010.0153971375812990
190.76270.777545532934551-0.0148455329345513
200.7480.754640159640035-0.00664015964003453
210.76920.7391778490960750.0300221509039245
220.7850.7764988252635810.0085011747364186
230.79130.794445621096604-0.00314562109660412
240.7720.791500572063277-0.0195005720632765
250.7880.7748715158212970.0131284841787032
260.8070.7976854177125660.00931458228743438
270.82680.8108803440235620.0159196559764379
280.82440.829732537101204-0.00533253710120359
290.84870.8196955153432730.0290044846567270
300.85720.845822851391130.0113771486088707
310.82140.848803879121356-0.0274038791213563
320.88270.8157009680000760.0669990319999246
330.92160.8867626663907080.0348373336092923
340.88650.926586116066395-0.0400861160663946
350.88160.8691006316334660.0124993683665343
360.88840.8730675375232220.0153324624767778
370.94660.8780257229207870.068574277079213
380.9180.941948898658037-0.0239488986580372
390.93370.8960746837679310.0376253162320691
400.95590.924799495865850.0311005041341493
410.96260.9532166594747350.0093833405252648
420.94340.952377722909721-0.00897772290972091
430.86390.917535181652333-0.0536351816523331
440.79960.839313223686658-0.0397132236866579
450.6680.772525228091967-0.104525228091967
460.65720.6320767054828310.0251232945171685
470.69280.6642344936245260.0285655063754739
480.64380.723660898079205-0.079860898079205
490.64540.66728150082859-0.0218815008285904
500.68730.6694824694518240.0178175305481762
510.72650.7156980882078760.0108019117921236
520.79120.7507290920519510.0404709079480485
530.81140.82271423790652-0.0113142379065199
540.82810.8174587324915430.0106412675084565
550.83930.8392454370748645.45629251361077e-05


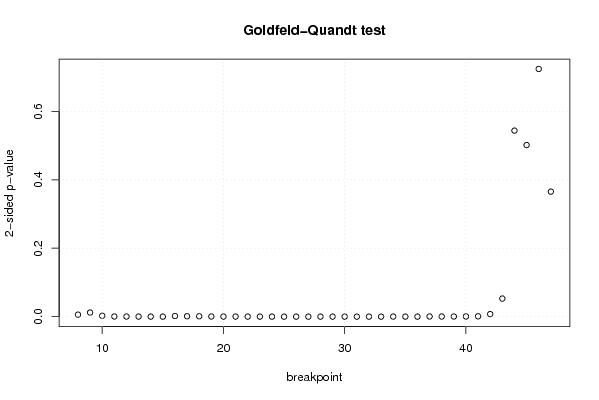
Goldfeld-Quandt test for Heteroskedasticity
p-valuesAlternative Hypothesis
breakpoint indexgreater2-sidedless
80.002920148636618460.005840297273236910.997079851363382
90.006015242988956220.01203048597791240.993984757011044
100.001292593321019040.002585186642038080.99870740667898
110.0002600224566116050.0005200449132232110.999739977543388
120.0001843540056699520.0003687080113399030.99981564599433
130.0001141134695537730.0002282269391075450.999885886530446
143.75948640625916e-057.51897281251832e-050.999962405135937
156.59619591920553e-050.0001319239183841110.999934038040808
160.0009134998987641660.001826999797528330.999086500101236
170.0005439270684235570.001087854136847110.999456072931576
180.0005433195972123760.001086639194424750.999456680402788
190.0002512514568036740.0005025029136073480.999748748543196
209.7170494400496e-050.0001943409888009920.9999028295056
210.0001219004284890440.0002438008569780870.999878099571511
229.60531530960808e-050.0001921063061921620.999903946846904
233.69625055449042e-057.39250110898084e-050.999963037494455
242.81546867707756e-055.63093735415511e-050.999971845313229
251.02041602877537e-052.04083205755075e-050.999989795839712
265.96968606940429e-061.19393721388086e-050.99999403031393
274.0002148869588e-068.0004297739176e-060.999995999785113
281.64106479442602e-063.28212958885205e-060.999998358935206
298.1752653745584e-071.63505307491168e-060.999999182473463
302.83704112820456e-075.67408225640912e-070.999999716295887
311.86515285208087e-063.73030570416173e-060.999998134847148
325.82415558789093e-061.16483111757819e-050.999994175844412
332.31356658958941e-054.62713317917883e-050.999976864334104
340.000111541186686870.000223082373373740.999888458813313
356.05805119773678e-050.0001211610239547360.999939419488023
362.43840497138314e-054.87680994276628e-050.999975615950286
370.0002600137650894290.0005200275301788580.99973998623491
380.0001792759241110410.0003585518482220820.999820724075889
390.0001977478311336970.0003954956622673940.999802252168866
400.0002865697830962010.0005731395661924010.999713430216904
410.0004940557001187960.0009881114002375910.999505944299881
420.003707753635253240.007415507270506480.996292246364747
430.02643692374698290.05287384749396580.973563076253017
440.7281322745659530.5437354508680940.271867725434047
450.7492349822290610.5015300355418780.250765017770939
460.6379980779665810.7240038440668380.362001922033419
470.8172845637298660.3654308725402680.182715436270134

\begin{tabular}{lllllllll}
\hline
Goldfeld-Quandt test for Heteroskedasticity \tabularnewline
p-values & Alternative Hypothesis \tabularnewline
breakpoint index & greater & 2-sided & less \tabularnewline
8 & 0.00292014863661846 & 0.00584029727323691 & 0.997079851363382 \tabularnewline
9 & 0.00601524298895622 & 0.0120304859779124 & 0.993984757011044 \tabularnewline
10 & 0.00129259332101904 & 0.00258518664203808 & 0.99870740667898 \tabularnewline
11 & 0.000260022456611605 & 0.000520044913223211 & 0.999739977543388 \tabularnewline
12 & 0.000184354005669952 & 0.000368708011339903 & 0.99981564599433 \tabularnewline
13 & 0.000114113469553773 & 0.000228226939107545 & 0.999885886530446 \tabularnewline
14 & 3.75948640625916e-05 & 7.51897281251832e-05 & 0.999962405135937 \tabularnewline
15 & 6.59619591920553e-05 & 0.000131923918384111 & 0.999934038040808 \tabularnewline
16 & 0.000913499898764166 & 0.00182699979752833 & 0.999086500101236 \tabularnewline
17 & 0.000543927068423557 & 0.00108785413684711 & 0.999456072931576 \tabularnewline
18 & 0.000543319597212376 & 0.00108663919442475 & 0.999456680402788 \tabularnewline
19 & 0.000251251456803674 & 0.000502502913607348 & 0.999748748543196 \tabularnewline
20 & 9.7170494400496e-05 & 0.000194340988800992 & 0.9999028295056 \tabularnewline
21 & 0.000121900428489044 & 0.000243800856978087 & 0.999878099571511 \tabularnewline
22 & 9.60531530960808e-05 & 0.000192106306192162 & 0.999903946846904 \tabularnewline
23 & 3.69625055449042e-05 & 7.39250110898084e-05 & 0.999963037494455 \tabularnewline
24 & 2.81546867707756e-05 & 5.63093735415511e-05 & 0.999971845313229 \tabularnewline
25 & 1.02041602877537e-05 & 2.04083205755075e-05 & 0.999989795839712 \tabularnewline
26 & 5.96968606940429e-06 & 1.19393721388086e-05 & 0.99999403031393 \tabularnewline
27 & 4.0002148869588e-06 & 8.0004297739176e-06 & 0.999995999785113 \tabularnewline
28 & 1.64106479442602e-06 & 3.28212958885205e-06 & 0.999998358935206 \tabularnewline
29 & 8.1752653745584e-07 & 1.63505307491168e-06 & 0.999999182473463 \tabularnewline
30 & 2.83704112820456e-07 & 5.67408225640912e-07 & 0.999999716295887 \tabularnewline
31 & 1.86515285208087e-06 & 3.73030570416173e-06 & 0.999998134847148 \tabularnewline
32 & 5.82415558789093e-06 & 1.16483111757819e-05 & 0.999994175844412 \tabularnewline
33 & 2.31356658958941e-05 & 4.62713317917883e-05 & 0.999976864334104 \tabularnewline
34 & 0.00011154118668687 & 0.00022308237337374 & 0.999888458813313 \tabularnewline
35 & 6.05805119773678e-05 & 0.000121161023954736 & 0.999939419488023 \tabularnewline
36 & 2.43840497138314e-05 & 4.87680994276628e-05 & 0.999975615950286 \tabularnewline
37 & 0.000260013765089429 & 0.000520027530178858 & 0.99973998623491 \tabularnewline
38 & 0.000179275924111041 & 0.000358551848222082 & 0.999820724075889 \tabularnewline
39 & 0.000197747831133697 & 0.000395495662267394 & 0.999802252168866 \tabularnewline
40 & 0.000286569783096201 & 0.000573139566192401 & 0.999713430216904 \tabularnewline
41 & 0.000494055700118796 & 0.000988111400237591 & 0.999505944299881 \tabularnewline
42 & 0.00370775363525324 & 0.00741550727050648 & 0.996292246364747 \tabularnewline
43 & 0.0264369237469829 & 0.0528738474939658 & 0.973563076253017 \tabularnewline
44 & 0.728132274565953 & 0.543735450868094 & 0.271867725434047 \tabularnewline
45 & 0.749234982229061 & 0.501530035541878 & 0.250765017770939 \tabularnewline
46 & 0.637998077966581 & 0.724003844066838 & 0.362001922033419 \tabularnewline
47 & 0.817284563729866 & 0.365430872540268 & 0.182715436270134 \tabularnewline
\hline
\end{tabular}
%Source: https://freestatistics.org/blog/index.php?pk=67243&T=5

[TABLE]
[ROW][C]Goldfeld-Quandt test for Heteroskedasticity[/C][/ROW]
[ROW][C]p-values[/C][C]Alternative Hypothesis[/C][/ROW]
[ROW][C]breakpoint index[/C][C]greater[/C][C]2-sided[/C][C]less[/C][/ROW]
[ROW][C]8[/C][C]0.00292014863661846[/C][C]0.00584029727323691[/C][C]0.997079851363382[/C][/ROW]
[ROW][C]9[/C][C]0.00601524298895622[/C][C]0.0120304859779124[/C][C]0.993984757011044[/C][/ROW]
[ROW][C]10[/C][C]0.00129259332101904[/C][C]0.00258518664203808[/C][C]0.99870740667898[/C][/ROW]
[ROW][C]11[/C][C]0.000260022456611605[/C][C]0.000520044913223211[/C][C]0.999739977543388[/C][/ROW]
[ROW][C]12[/C][C]0.000184354005669952[/C][C]0.000368708011339903[/C][C]0.99981564599433[/C][/ROW]
[ROW][C]13[/C][C]0.000114113469553773[/C][C]0.000228226939107545[/C][C]0.999885886530446[/C][/ROW]
[ROW][C]14[/C][C]3.75948640625916e-05[/C][C]7.51897281251832e-05[/C][C]0.999962405135937[/C][/ROW]
[ROW][C]15[/C][C]6.59619591920553e-05[/C][C]0.000131923918384111[/C][C]0.999934038040808[/C][/ROW]
[ROW][C]16[/C][C]0.000913499898764166[/C][C]0.00182699979752833[/C][C]0.999086500101236[/C][/ROW]
[ROW][C]17[/C][C]0.000543927068423557[/C][C]0.00108785413684711[/C][C]0.999456072931576[/C][/ROW]
[ROW][C]18[/C][C]0.000543319597212376[/C][C]0.00108663919442475[/C][C]0.999456680402788[/C][/ROW]
[ROW][C]19[/C][C]0.000251251456803674[/C][C]0.000502502913607348[/C][C]0.999748748543196[/C][/ROW]
[ROW][C]20[/C][C]9.7170494400496e-05[/C][C]0.000194340988800992[/C][C]0.9999028295056[/C][/ROW]
[ROW][C]21[/C][C]0.000121900428489044[/C][C]0.000243800856978087[/C][C]0.999878099571511[/C][/ROW]
[ROW][C]22[/C][C]9.60531530960808e-05[/C][C]0.000192106306192162[/C][C]0.999903946846904[/C][/ROW]
[ROW][C]23[/C][C]3.69625055449042e-05[/C][C]7.39250110898084e-05[/C][C]0.999963037494455[/C][/ROW]
[ROW][C]24[/C][C]2.81546867707756e-05[/C][C]5.63093735415511e-05[/C][C]0.999971845313229[/C][/ROW]
[ROW][C]25[/C][C]1.02041602877537e-05[/C][C]2.04083205755075e-05[/C][C]0.999989795839712[/C][/ROW]
[ROW][C]26[/C][C]5.96968606940429e-06[/C][C]1.19393721388086e-05[/C][C]0.99999403031393[/C][/ROW]
[ROW][C]27[/C][C]4.0002148869588e-06[/C][C]8.0004297739176e-06[/C][C]0.999995999785113[/C][/ROW]
[ROW][C]28[/C][C]1.64106479442602e-06[/C][C]3.28212958885205e-06[/C][C]0.999998358935206[/C][/ROW]
[ROW][C]29[/C][C]8.1752653745584e-07[/C][C]1.63505307491168e-06[/C][C]0.999999182473463[/C][/ROW]
[ROW][C]30[/C][C]2.83704112820456e-07[/C][C]5.67408225640912e-07[/C][C]0.999999716295887[/C][/ROW]
[ROW][C]31[/C][C]1.86515285208087e-06[/C][C]3.73030570416173e-06[/C][C]0.999998134847148[/C][/ROW]
[ROW][C]32[/C][C]5.82415558789093e-06[/C][C]1.16483111757819e-05[/C][C]0.999994175844412[/C][/ROW]
[ROW][C]33[/C][C]2.31356658958941e-05[/C][C]4.62713317917883e-05[/C][C]0.999976864334104[/C][/ROW]
[ROW][C]34[/C][C]0.00011154118668687[/C][C]0.00022308237337374[/C][C]0.999888458813313[/C][/ROW]
[ROW][C]35[/C][C]6.05805119773678e-05[/C][C]0.000121161023954736[/C][C]0.999939419488023[/C][/ROW]
[ROW][C]36[/C][C]2.43840497138314e-05[/C][C]4.87680994276628e-05[/C][C]0.999975615950286[/C][/ROW]
[ROW][C]37[/C][C]0.000260013765089429[/C][C]0.000520027530178858[/C][C]0.99973998623491[/C][/ROW]
[ROW][C]38[/C][C]0.000179275924111041[/C][C]0.000358551848222082[/C][C]0.999820724075889[/C][/ROW]
[ROW][C]39[/C][C]0.000197747831133697[/C][C]0.000395495662267394[/C][C]0.999802252168866[/C][/ROW]
[ROW][C]40[/C][C]0.000286569783096201[/C][C]0.000573139566192401[/C][C]0.999713430216904[/C][/ROW]
[ROW][C]41[/C][C]0.000494055700118796[/C][C]0.000988111400237591[/C][C]0.999505944299881[/C][/ROW]
[ROW][C]42[/C][C]0.00370775363525324[/C][C]0.00741550727050648[/C][C]0.996292246364747[/C][/ROW]
[ROW][C]43[/C][C]0.0264369237469829[/C][C]0.0528738474939658[/C][C]0.973563076253017[/C][/ROW]
[ROW][C]44[/C][C]0.728132274565953[/C][C]0.543735450868094[/C][C]0.271867725434047[/C][/ROW]
[ROW][C]45[/C][C]0.749234982229061[/C][C]0.501530035541878[/C][C]0.250765017770939[/C][/ROW]
[ROW][C]46[/C][C]0.637998077966581[/C][C]0.724003844066838[/C][C]0.362001922033419[/C][/ROW]
[ROW][C]47[/C][C]0.817284563729866[/C][C]0.365430872540268[/C][C]0.182715436270134[/C][/ROW]
[/TABLE]
Source: https://freestatistics.org/blog/index.php?pk=67243&T=5

Globally Unique Identifier (entire table): ba.freestatistics.org/blog/index.php?pk=67243&T=5

As an alternative you can also use a QR Code:  

The GUIDs for individual cells are displayed in the table below:

Goldfeld-Quandt test for Heteroskedasticity
p-valuesAlternative Hypothesis
breakpoint indexgreater2-sidedless
80.002920148636618460.005840297273236910.997079851363382
90.006015242988956220.01203048597791240.993984757011044
100.001292593321019040.002585186642038080.99870740667898
110.0002600224566116050.0005200449132232110.999739977543388
120.0001843540056699520.0003687080113399030.99981564599433
130.0001141134695537730.0002282269391075450.999885886530446
143.75948640625916e-057.51897281251832e-050.999962405135937
156.59619591920553e-050.0001319239183841110.999934038040808
160.0009134998987641660.001826999797528330.999086500101236
170.0005439270684235570.001087854136847110.999456072931576
180.0005433195972123760.001086639194424750.999456680402788
190.0002512514568036740.0005025029136073480.999748748543196
209.7170494400496e-050.0001943409888009920.9999028295056
210.0001219004284890440.0002438008569780870.999878099571511
229.60531530960808e-050.0001921063061921620.999903946846904
233.69625055449042e-057.39250110898084e-050.999963037494455
242.81546867707756e-055.63093735415511e-050.999971845313229
251.02041602877537e-052.04083205755075e-050.999989795839712
265.96968606940429e-061.19393721388086e-050.99999403031393
274.0002148869588e-068.0004297739176e-060.999995999785113
281.64106479442602e-063.28212958885205e-060.999998358935206
298.1752653745584e-071.63505307491168e-060.999999182473463
302.83704112820456e-075.67408225640912e-070.999999716295887
311.86515285208087e-063.73030570416173e-060.999998134847148
325.82415558789093e-061.16483111757819e-050.999994175844412
332.31356658958941e-054.62713317917883e-050.999976864334104
340.000111541186686870.000223082373373740.999888458813313
356.05805119773678e-050.0001211610239547360.999939419488023
362.43840497138314e-054.87680994276628e-050.999975615950286
370.0002600137650894290.0005200275301788580.99973998623491
380.0001792759241110410.0003585518482220820.999820724075889
390.0001977478311336970.0003954956622673940.999802252168866
400.0002865697830962010.0005731395661924010.999713430216904
410.0004940557001187960.0009881114002375910.999505944299881
420.003707753635253240.007415507270506480.996292246364747
430.02643692374698290.05287384749396580.973563076253017
440.7281322745659530.5437354508680940.271867725434047
450.7492349822290610.5015300355418780.250765017770939
460.6379980779665810.7240038440668380.362001922033419
470.8172845637298660.3654308725402680.182715436270134


Meta Analysis of Goldfeld-Quandt test for Heteroskedasticity
Description# significant tests% significant testsOK/NOK
1% type I error level340.85NOK
5% type I error level350.875NOK
10% type I error level360.9NOK

\begin{tabular}{lllllllll}
\hline
Meta Analysis of Goldfeld-Quandt test for Heteroskedasticity \tabularnewline
Description & # significant tests & % significant tests & OK/NOK \tabularnewline
1% type I error level & 34 & 0.85 & NOK \tabularnewline
5% type I error level & 35 & 0.875 & NOK \tabularnewline
10% type I error level & 36 & 0.9 & NOK \tabularnewline
\hline
\end{tabular}
%Source: https://freestatistics.org/blog/index.php?pk=67243&T=6

[TABLE]
[ROW][C]Meta Analysis of Goldfeld-Quandt test for Heteroskedasticity[/C][/ROW]
[ROW][C]Description[/C][C]# significant tests[/C][C]% significant tests[/C][C]OK/NOK[/C][/ROW]
[ROW][C]1% type I error level[/C][C]34[/C][C]0.85[/C][C]NOK[/C][/ROW]
[ROW][C]5% type I error level[/C][C]35[/C][C]0.875[/C][C]NOK[/C][/ROW]
[ROW][C]10% type I error level[/C][C]36[/C][C]0.9[/C][C]NOK[/C][/ROW]
[/TABLE]
Source: https://freestatistics.org/blog/index.php?pk=67243&T=6

Globally Unique Identifier (entire table): ba.freestatistics.org/blog/index.php?pk=67243&T=6

As an alternative you can also use a QR Code:  

The GUIDs for individual cells are displayed in the table below:

Meta Analysis of Goldfeld-Quandt test for Heteroskedasticity
Description# significant tests% significant testsOK/NOK
1% type I error level340.85NOK
5% type I error level350.875NOK
10% type I error level360.9NOK


Parameters (Session):
par1 = 1 ; par2 = Do not include Seasonal Dummies ; par3 = Linear Trend ;
Parameters (R input):
par1 = 1 ; par2 = Do not include Seasonal Dummies ; par3 = Linear Trend ;
R code (references can be found in the software module):
library(lattice)
library(lmtest)
n25 <- 25 #minimum number of obs. for Goldfeld-Quandt test
par1 <- as.numeric(par1)
x <- t(y)
k <- length(x[1,])
n <- length(x[,1])
x1 <- cbind(x[,par1], x[,1:k!=par1])
mycolnames <- c(colnames(x)[par1], colnames(x)[1:k!=par1])
colnames(x1) <- mycolnames #colnames(x)[par1]
x <- x1
if (par3 == 'First Differences'){
x2 <- array(0, dim=c(n-1,k), dimnames=list(1:(n-1), paste('(1-B)',colnames(x),sep='')))
for (i in 1:n-1) {
for (j in 1:k) {
x2[i,j] <- x[i+1,j] - x[i,j]
}
}
x <- x2
}
if (par2 == 'Include Monthly Dummies'){
x2 <- array(0, dim=c(n,11), dimnames=list(1:n, paste('M', seq(1:11), sep ='')))
for (i in 1:11){
x2[seq(i,n,12),i] <- 1
}
x <- cbind(x, x2)
}
if (par2 == 'Include Quarterly Dummies'){
x2 <- array(0, dim=c(n,3), dimnames=list(1:n, paste('Q', seq(1:3), sep ='')))
for (i in 1:3){
x2[seq(i,n,4),i] <- 1
}
x <- cbind(x, x2)
}
k <- length(x[1,])
if (par3 == 'Linear Trend'){
x <- cbind(x, c(1:n))
colnames(x)[k+1] <- 't'
}
x
k <- length(x[1,])
df <- as.data.frame(x)
(mylm <- lm(df))
(mysum <- summary(mylm))
if (n > n25) {
kp3 <- k + 3
nmkm3 <- n - k - 3
gqarr <- array(NA, dim=c(nmkm3-kp3+1,3))
numgqtests <- 0
numsignificant1 <- 0
numsignificant5 <- 0
numsignificant10 <- 0
for (mypoint in kp3:nmkm3) {
j <- 0
numgqtests <- numgqtests + 1
for (myalt in c('greater', 'two.sided', 'less')) {
j <- j + 1
gqarr[mypoint-kp3+1,j] <- gqtest(mylm, point=mypoint, alternative=myalt)$p.value
}
if (gqarr[mypoint-kp3+1,2] < 0.01) numsignificant1 <- numsignificant1 + 1
if (gqarr[mypoint-kp3+1,2] < 0.05) numsignificant5 <- numsignificant5 + 1
if (gqarr[mypoint-kp3+1,2] < 0.10) numsignificant10 <- numsignificant10 + 1
}
gqarr
}
bitmap(file='test0.png')
plot(x[,1], type='l', main='Actuals and Interpolation', ylab='value of Actuals and Interpolation (dots)', xlab='time or index')
points(x[,1]-mysum$resid)
grid()
dev.off()
bitmap(file='test1.png')
plot(mysum$resid, type='b', pch=19, main='Residuals', ylab='value of Residuals', xlab='time or index')
grid()
dev.off()
bitmap(file='test2.png')
hist(mysum$resid, main='Residual Histogram', xlab='values of Residuals')
grid()
dev.off()
bitmap(file='test3.png')
densityplot(~mysum$resid,col='black',main='Residual Density Plot', xlab='values of Residuals')
dev.off()
bitmap(file='test4.png')
qqnorm(mysum$resid, main='Residual Normal Q-Q Plot')
qqline(mysum$resid)
grid()
dev.off()
(myerror <- as.ts(mysum$resid))
bitmap(file='test5.png')
dum <- cbind(lag(myerror,k=1),myerror)
dum
dum1 <- dum[2:length(myerror),]
dum1
z <- as.data.frame(dum1)
z
plot(z,main=paste('Residual Lag plot, lowess, and regression line'), ylab='values of Residuals', xlab='lagged values of Residuals')
lines(lowess(z))
abline(lm(z))
grid()
dev.off()
bitmap(file='test6.png')
acf(mysum$resid, lag.max=length(mysum$resid)/2, main='Residual Autocorrelation Function')
grid()
dev.off()
bitmap(file='test7.png')
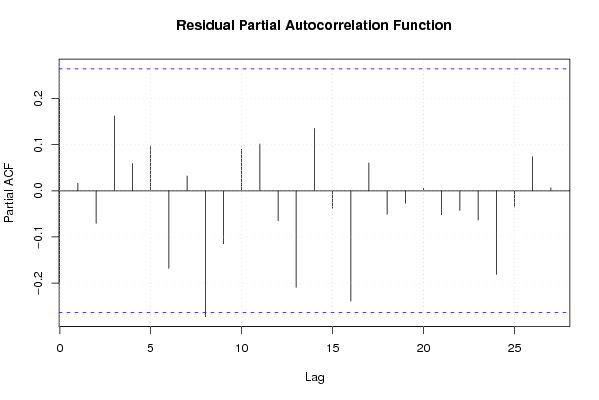
pacf(mysum$resid, lag.max=length(mysum$resid)/2, main='Residual Partial Autocorrelation Function')
grid()
dev.off()
bitmap(file='test8.png')
opar <- par(mfrow = c(2,2), oma = c(0, 0, 1.1, 0))
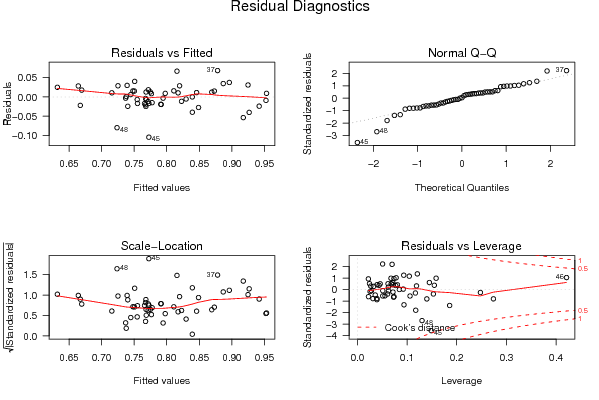
plot(mylm, las = 1, sub='Residual Diagnostics')
par(opar)
dev.off()
if (n > n25) {
bitmap(file='test9.png')
plot(kp3:nmkm3,gqarr[,2], main='Goldfeld-Quandt test',ylab='2-sided p-value',xlab='breakpoint')
grid()
dev.off()
}
load(file='createtable')
a<-table.start()
a<-table.row.start(a)
a<-table.element(a, 'Multiple Linear Regression - Estimated Regression Equation', 1, TRUE)
a<-table.row.end(a)
myeq <- colnames(x)[1]
myeq <- paste(myeq, '[t] = ', sep='')
for (i in 1:k){
if (mysum$coefficients[i,1] > 0) myeq <- paste(myeq, '+', '')
myeq <- paste(myeq, mysum$coefficients[i,1], sep=' ')
if (rownames(mysum$coefficients)[i] != '(Intercept)') {
myeq <- paste(myeq, rownames(mysum$coefficients)[i], sep='')
if (rownames(mysum$coefficients)[i] != 't') myeq <- paste(myeq, '[t]', sep='')
}
}
myeq <- paste(myeq, ' + e[t]')
a<-table.row.start(a)
a<-table.element(a, myeq)
a<-table.row.end(a)
a<-table.end(a)
table.save(a,file='mytable1.tab')
a<-table.start()
a<-table.row.start(a)
a<-table.element(a,hyperlink('ols1.htm','Multiple Linear Regression - Ordinary Least Squares',''), 6, TRUE)
a<-table.row.end(a)
a<-table.row.start(a)
a<-table.element(a,'Variable',header=TRUE)
a<-table.element(a,'Parameter',header=TRUE)
a<-table.element(a,'S.D.',header=TRUE)
a<-table.element(a,'T-STAT
H0: parameter = 0',header=TRUE)
a<-table.element(a,'2-tail p-value',header=TRUE)
a<-table.element(a,'1-tail p-value',header=TRUE)
a<-table.row.end(a)
for (i in 1:k){
a<-table.row.start(a)
a<-table.element(a,rownames(mysum$coefficients)[i],header=TRUE)
a<-table.element(a,mysum$coefficients[i,1])
a<-table.element(a, round(mysum$coefficients[i,2],6))
a<-table.element(a, round(mysum$coefficients[i,3],4))
a<-table.element(a, round(mysum$coefficients[i,4],6))
a<-table.element(a, round(mysum$coefficients[i,4]/2,6))
a<-table.row.end(a)
}
a<-table.end(a)
table.save(a,file='mytable2.tab')
a<-table.start()
a<-table.row.start(a)
a<-table.element(a, 'Multiple Linear Regression - Regression Statistics', 2, TRUE)
a<-table.row.end(a)
a<-table.row.start(a)
a<-table.element(a, 'Multiple R',1,TRUE)
a<-table.element(a, sqrt(mysum$r.squared))
a<-table.row.end(a)
a<-table.row.start(a)
a<-table.element(a, 'R-squared',1,TRUE)
a<-table.element(a, mysum$r.squared)
a<-table.row.end(a)
a<-table.row.start(a)
a<-table.element(a, 'Adjusted R-squared',1,TRUE)
a<-table.element(a, mysum$adj.r.squared)
a<-table.row.end(a)
a<-table.row.start(a)
a<-table.element(a, 'F-TEST (value)',1,TRUE)
a<-table.element(a, mysum$fstatistic[1])
a<-table.row.end(a)
a<-table.row.start(a)
a<-table.element(a, 'F-TEST (DF numerator)',1,TRUE)
a<-table.element(a, mysum$fstatistic[2])
a<-table.row.end(a)
a<-table.row.start(a)
a<-table.element(a, 'F-TEST (DF denominator)',1,TRUE)
a<-table.element(a, mysum$fstatistic[3])
a<-table.row.end(a)
a<-table.row.start(a)
a<-table.element(a, 'p-value',1,TRUE)
a<-table.element(a, 1-pf(mysum$fstatistic[1],mysum$fstatistic[2],mysum$fstatistic[3]))
a<-table.row.end(a)
a<-table.row.start(a)
a<-table.element(a, 'Multiple Linear Regression - Residual Statistics', 2, TRUE)
a<-table.row.end(a)
a<-table.row.start(a)
a<-table.element(a, 'Residual Standard Deviation',1,TRUE)
a<-table.element(a, mysum$sigma)
a<-table.row.end(a)
a<-table.row.start(a)
a<-table.element(a, 'Sum Squared Residuals',1,TRUE)
a<-table.element(a, sum(myerror*myerror))
a<-table.row.end(a)
a<-table.end(a)
table.save(a,file='mytable3.tab')
a<-table.start()
a<-table.row.start(a)
a<-table.element(a, 'Multiple Linear Regression - Actuals, Interpolation, and Residuals', 4, TRUE)
a<-table.row.end(a)
a<-table.row.start(a)
a<-table.element(a, 'Time or Index', 1, TRUE)
a<-table.element(a, 'Actuals', 1, TRUE)
a<-table.element(a, 'Interpolation
Forecast', 1, TRUE)
a<-table.element(a, 'Residuals
Prediction Error', 1, TRUE)
a<-table.row.end(a)
for (i in 1:n) {
a<-table.row.start(a)
a<-table.element(a,i, 1, TRUE)
a<-table.element(a,x[i])
a<-table.element(a,x[i]-mysum$resid[i])
a<-table.element(a,mysum$resid[i])
a<-table.row.end(a)
}
a<-table.end(a)
table.save(a,file='mytable4.tab')
if (n > n25) {
a<-table.start()
a<-table.row.start(a)
a<-table.element(a,'Goldfeld-Quandt test for Heteroskedasticity',4,TRUE)
a<-table.row.end(a)
a<-table.row.start(a)
a<-table.element(a,'p-values',header=TRUE)
a<-table.element(a,'Alternative Hypothesis',3,header=TRUE)
a<-table.row.end(a)
a<-table.row.start(a)
a<-table.element(a,'breakpoint index',header=TRUE)
a<-table.element(a,'greater',header=TRUE)
a<-table.element(a,'2-sided',header=TRUE)
a<-table.element(a,'less',header=TRUE)
a<-table.row.end(a)
for (mypoint in kp3:nmkm3) {
a<-table.row.start(a)
a<-table.element(a,mypoint,header=TRUE)
a<-table.element(a,gqarr[mypoint-kp3+1,1])
a<-table.element(a,gqarr[mypoint-kp3+1,2])
a<-table.element(a,gqarr[mypoint-kp3+1,3])
a<-table.row.end(a)
}
a<-table.end(a)
table.save(a,file='mytable5.tab')
a<-table.start()
a<-table.row.start(a)
a<-table.element(a,'Meta Analysis of Goldfeld-Quandt test for Heteroskedasticity',4,TRUE)
a<-table.row.end(a)
a<-table.row.start(a)
a<-table.element(a,'Description',header=TRUE)
a<-table.element(a,'# significant tests',header=TRUE)
a<-table.element(a,'% significant tests',header=TRUE)
a<-table.element(a,'OK/NOK',header=TRUE)
a<-table.row.end(a)
a<-table.row.start(a)
a<-table.element(a,'1% type I error level',header=TRUE)
a<-table.element(a,numsignificant1)
a<-table.element(a,numsignificant1/numgqtests)
if (numsignificant1/numgqtests < 0.01) dum <- 'OK' else dum <- 'NOK'
a<-table.element(a,dum)
a<-table.row.end(a)
a<-table.row.start(a)
a<-table.element(a,'5% type I error level',header=TRUE)
a<-table.element(a,numsignificant5)
a<-table.element(a,numsignificant5/numgqtests)
if (numsignificant5/numgqtests < 0.05) dum <- 'OK' else dum <- 'NOK'
a<-table.element(a,dum)
a<-table.row.end(a)
a<-table.row.start(a)
a<-table.element(a,'10% type I error level',header=TRUE)
a<-table.element(a,numsignificant10)
a<-table.element(a,numsignificant10/numgqtests)
if (numsignificant10/numgqtests < 0.1) dum <- 'OK' else dum <- 'NOK'
a<-table.element(a,dum)
a<-table.row.end(a)
a<-table.end(a)
table.save(a,file='mytable6.tab')
}