Free Statistics

of Irreproducible Research!

Author's title

Author*The author of this computation has been verified*
R Software Modulerwasp_multipleregression.wasp
Title produced by softwareMultiple Regression
Date of computationSun, 13 Dec 2009 06:47:53 -0700
Cite this page as followsStatistical Computations at FreeStatistics.org, Office for Research Development and Education, URL https://freestatistics.org/blog/index.php?v=date/2009/Dec/13/t1260712151h28kaas9jmmihcs.htm/, Retrieved Sun, 28 Apr 2024 07:52:36 +0000
Statistical Computations at FreeStatistics.org, Office for Research Development and Education, URL https://freestatistics.org/blog/index.php?pk=67280, Retrieved Sun, 28 Apr 2024 07:52:36 +0000
QR Codes:

Original text written by user:
IsPrivate?No (this computation is public)
User-defined keywords
Estimated Impact130
Family? (F = Feedback message, R = changed R code, M = changed R Module, P = changed Parameters, D = changed Data)
-     [Multiple Regression] [Q1 The Seatbeltlaw] [2007-11-14 19:27:43] [8cd6641b921d30ebe00b648d1481bba0]
- RM D  [Multiple Regression] [Seatbelt] [2009-11-12 14:10:54] [b98453cac15ba1066b407e146608df68]
-   PD    [Multiple Regression] [] [2009-11-19 10:28:54] [74be16979710d4c4e7c6647856088456]
-   P       [Multiple Regression] [] [2009-11-20 13:18:20] [74be16979710d4c4e7c6647856088456]
-    D        [Multiple Regression] [] [2009-11-20 13:28:43] [74be16979710d4c4e7c6647856088456]
-   PD            [Multiple Regression] [] [2009-12-13 13:47:53] [14869f38c4320b00c96ca15cc00142de] [Current]
Feedback Forum

Post a new message
Dataseries X:
431	436	443	448	460	467
484	431	436	443	448	460
510	484	431	436	443	448
513	510	484	431	436	443
503	513	510	484	431	436
471	503	513	510	484	431
471	471	503	513	510	484
476	471	471	503	513	510
475	476	471	471	503	513
470	475	476	471	471	503
461	470	475	476	471	471
455	461	470	475	476	471
456	455	461	470	475	476
517	456	455	461	470	475
525	517	456	455	461	470
523	525	517	456	455	461
519	523	525	517	456	455
509	519	523	525	517	456
512	509	519	523	525	517
519	512	509	519	523	525
517	519	512	509	519	523
510	517	519	512	509	519
509	510	517	519	512	509
501	509	510	517	519	512
507	501	509	510	517	519
569	507	501	509	510	517
580	569	507	501	509	510
578	580	569	507	501	509
565	578	580	569	507	501
547	565	578	580	569	507
555	547	565	578	580	569
562	555	547	565	578	580
561	562	555	547	565	578
555	561	562	555	547	565
544	555	561	562	555	547
537	544	555	561	562	555
543	537	544	555	561	562
594	543	537	544	555	561
611	594	543	537	544	555
613	611	594	543	537	544
611	613	611	594	543	537
594	611	613	611	594	543
595	594	611	613	611	594
591	595	594	611	613	611
589	591	595	594	611	613
584	589	591	595	594	611
573	584	589	591	595	594
567	573	584	589	591	595
569	567	573	584	589	591
621	569	567	573	584	589
629	621	569	567	573	584
628	629	621	569	567	573
612	628	629	621	569	567
595	612	628	629	621	569
597	595	612	628	629	621
593	597	595	612	628	629
590	593	597	595	612	628
580	590	593	597	595	612
574	580	590	593	597	595
573	574	580	590	593	597
573	573	574	580	590	593
620	573	573	574	580	590
626	620	573	573	574	580
620	626	620	573	573	574
588	620	626	620	573	573
566	588	620	626	620	573
557	566	588	620	626	620


Summary of computational transaction
Raw Inputview raw input (R code)
Raw Outputview raw output of R engine
Computing time4 seconds
R Server'Gwilym Jenkins' @ 72.249.127.135
R Framework error message
The field 'Names of X columns' contains a hard return which cannot be interpreted.
Please, resubmit your request without hard returns in the 'Names of X columns'.

\begin{tabular}{lllllllll}
\hline
Summary of computational transaction \tabularnewline
Raw Input & view raw input (R code)  \tabularnewline
Raw Output & view raw output of R engine  \tabularnewline
Computing time & 4 seconds \tabularnewline
R Server & 'Gwilym Jenkins' @ 72.249.127.135 \tabularnewline
R Framework error message & 
The field 'Names of X columns' contains a hard return which cannot be interpreted.
Please, resubmit your request without hard returns in the 'Names of X columns'.
\tabularnewline \hline \end{tabular} %Source: https://freestatistics.org/blog/index.php?pk=67280&T=0

[TABLE]
[ROW][C]Summary of computational transaction[/C][/ROW]
[ROW][C]Raw Input[/C][C]view raw input (R code) [/C][/ROW]
[ROW][C]Raw Output[/C][C]view raw output of R engine [/C][/ROW]
[ROW][C]Computing time[/C][C]4 seconds[/C][/ROW]
[ROW][C]R Server[/C][C]'Gwilym Jenkins' @ 72.249.127.135[/C][/ROW]
[ROW][C]R Framework error message[/C][C]
The field 'Names of X columns' contains a hard return which cannot be interpreted.
Please, resubmit your request without hard returns in the 'Names of X columns'.
[/C][/ROW] [/TABLE] Source: https://freestatistics.org/blog/index.php?pk=67280&T=0

Globally Unique Identifier (entire table): ba.freestatistics.org/blog/index.php?pk=67280&T=0

As an alternative you can also use a QR Code:  

The GUIDs for individual cells are displayed in the table below:

Summary of computational transaction
Raw Inputview raw input (R code)
Raw Outputview raw output of R engine
Computing time4 seconds
R Server'Gwilym Jenkins' @ 72.249.127.135
R Framework error message
The field 'Names of X columns' contains a hard return which cannot be interpreted.
Please, resubmit your request without hard returns in the 'Names of X columns'.


Multiple Linear Regression - Estimated Regression Equation
Y[t] = -45.7369064542018 + 1.13418044850272`Y(t-1)`[t] -0.16358852083517`Y(t-2)`[t] -0.0100567924246914`Y(t-3)`[t] + 0.116041570443329`Y(t-4)`[t] + 0.0199336238572533`Y(t-5) `[t] + 6.59174048804482M1[t] + 59.2644444889681M2[t] + 11.8349664900739M3[t] + 6.5260619174202M4[t] -2.29913043626265M5[t] -13.1189551740509M6[t] + 5.31204725573158M7[t] + 2.18713491252564M8[t] -0.462164422370506M9[t] -1.93905835432363M10[t] -1.94342270003405M11[t] -0.332543357065598t + e[t]

\begin{tabular}{lllllllll}
\hline
Multiple Linear Regression - Estimated Regression Equation \tabularnewline
Y[t] =  -45.7369064542018 +  1.13418044850272`Y(t-1)`[t] -0.16358852083517`Y(t-2)`[t] -0.0100567924246914`Y(t-3)`[t] +  0.116041570443329`Y(t-4)`[t] +  0.0199336238572533`Y(t-5)
`[t] +  6.59174048804482M1[t] +  59.2644444889681M2[t] +  11.8349664900739M3[t] +  6.5260619174202M4[t] -2.29913043626265M5[t] -13.1189551740509M6[t] +  5.31204725573158M7[t] +  2.18713491252564M8[t] -0.462164422370506M9[t] -1.93905835432363M10[t] -1.94342270003405M11[t] -0.332543357065598t  + e[t] \tabularnewline
\hline
\end{tabular}
%Source: https://freestatistics.org/blog/index.php?pk=67280&T=1

[TABLE]
[ROW][C]Multiple Linear Regression - Estimated Regression Equation[/C][/ROW]
[ROW][C]Y[t] =  -45.7369064542018 +  1.13418044850272`Y(t-1)`[t] -0.16358852083517`Y(t-2)`[t] -0.0100567924246914`Y(t-3)`[t] +  0.116041570443329`Y(t-4)`[t] +  0.0199336238572533`Y(t-5)
`[t] +  6.59174048804482M1[t] +  59.2644444889681M2[t] +  11.8349664900739M3[t] +  6.5260619174202M4[t] -2.29913043626265M5[t] -13.1189551740509M6[t] +  5.31204725573158M7[t] +  2.18713491252564M8[t] -0.462164422370506M9[t] -1.93905835432363M10[t] -1.94342270003405M11[t] -0.332543357065598t  + e[t][/C][/ROW]
[/TABLE]
Source: https://freestatistics.org/blog/index.php?pk=67280&T=1

Globally Unique Identifier (entire table): ba.freestatistics.org/blog/index.php?pk=67280&T=1

As an alternative you can also use a QR Code:  

The GUIDs for individual cells are displayed in the table below:

Multiple Linear Regression - Estimated Regression Equation
Y[t] = -45.7369064542018 + 1.13418044850272`Y(t-1)`[t] -0.16358852083517`Y(t-2)`[t] -0.0100567924246914`Y(t-3)`[t] + 0.116041570443329`Y(t-4)`[t] + 0.0199336238572533`Y(t-5) `[t] + 6.59174048804482M1[t] + 59.2644444889681M2[t] + 11.8349664900739M3[t] + 6.5260619174202M4[t] -2.29913043626265M5[t] -13.1189551740509M6[t] + 5.31204725573158M7[t] + 2.18713491252564M8[t] -0.462164422370506M9[t] -1.93905835432363M10[t] -1.94342270003405M11[t] -0.332543357065598t + e[t]


Multiple Linear Regression - Ordinary Least Squares
VariableParameterS.D.T-STATH0: parameter = 02-tail p-value1-tail p-value
(Intercept)-45.736906454201827.93241-1.63740.1079510.053976
`Y(t-1)`1.134180448502720.1433577.911600
`Y(t-2)`-0.163588520835170.219819-0.74420.4603110.230156
`Y(t-3)`-0.01005679242469140.240403-0.04180.9668020.483401
`Y(t-4)`0.1160415704433290.2455620.47260.6386280.319314
`Y(t-5) `0.01993362385725330.1676590.11890.9058460.452923
M16.591740488044823.527761.86850.0676720.033836
M259.26444448896813.92463515.100600
M311.83496649007399.5767171.23580.2224220.111211
M46.52606191742029.7586820.66870.5067970.253399
M5-2.299130436262659.761515-0.23550.8147790.407389
M6-13.11895517405098.982316-1.46050.1505270.075263
M75.312047255731584.343791.22290.2272140.113607
M82.187134912525644.802960.45540.6508530.325426
M9-0.4621644223705065.124348-0.09020.9285040.464252
M10-1.939058354323635.117028-0.37890.7063680.353184
M11-1.943422700034053.589363-0.54140.5906580.295329
t-0.3325433570655980.162008-2.05260.0454680.022734

\begin{tabular}{lllllllll}
\hline
Multiple Linear Regression - Ordinary Least Squares \tabularnewline
Variable & Parameter & S.D. & T-STATH0: parameter = 0 & 2-tail p-value & 1-tail p-value \tabularnewline
(Intercept) & -45.7369064542018 & 27.93241 & -1.6374 & 0.107951 & 0.053976 \tabularnewline
`Y(t-1)` & 1.13418044850272 & 0.143357 & 7.9116 & 0 & 0 \tabularnewline
`Y(t-2)` & -0.16358852083517 & 0.219819 & -0.7442 & 0.460311 & 0.230156 \tabularnewline
`Y(t-3)` & -0.0100567924246914 & 0.240403 & -0.0418 & 0.966802 & 0.483401 \tabularnewline
`Y(t-4)` & 0.116041570443329 & 0.245562 & 0.4726 & 0.638628 & 0.319314 \tabularnewline
`Y(t-5)
` & 0.0199336238572533 & 0.167659 & 0.1189 & 0.905846 & 0.452923 \tabularnewline
M1 & 6.59174048804482 & 3.52776 & 1.8685 & 0.067672 & 0.033836 \tabularnewline
M2 & 59.2644444889681 & 3.924635 & 15.1006 & 0 & 0 \tabularnewline
M3 & 11.8349664900739 & 9.576717 & 1.2358 & 0.222422 & 0.111211 \tabularnewline
M4 & 6.5260619174202 & 9.758682 & 0.6687 & 0.506797 & 0.253399 \tabularnewline
M5 & -2.29913043626265 & 9.761515 & -0.2355 & 0.814779 & 0.407389 \tabularnewline
M6 & -13.1189551740509 & 8.982316 & -1.4605 & 0.150527 & 0.075263 \tabularnewline
M7 & 5.31204725573158 & 4.34379 & 1.2229 & 0.227214 & 0.113607 \tabularnewline
M8 & 2.18713491252564 & 4.80296 & 0.4554 & 0.650853 & 0.325426 \tabularnewline
M9 & -0.462164422370506 & 5.124348 & -0.0902 & 0.928504 & 0.464252 \tabularnewline
M10 & -1.93905835432363 & 5.117028 & -0.3789 & 0.706368 & 0.353184 \tabularnewline
M11 & -1.94342270003405 & 3.589363 & -0.5414 & 0.590658 & 0.295329 \tabularnewline
t & -0.332543357065598 & 0.162008 & -2.0526 & 0.045468 & 0.022734 \tabularnewline
\hline
\end{tabular}
%Source: https://freestatistics.org/blog/index.php?pk=67280&T=2

[TABLE]
[ROW][C]Multiple Linear Regression - Ordinary Least Squares[/C][/ROW]
[ROW][C]Variable[/C][C]Parameter[/C][C]S.D.[/C][C]T-STATH0: parameter = 0[/C][C]2-tail p-value[/C][C]1-tail p-value[/C][/ROW]
[ROW][C](Intercept)[/C][C]-45.7369064542018[/C][C]27.93241[/C][C]-1.6374[/C][C]0.107951[/C][C]0.053976[/C][/ROW]
[ROW][C]`Y(t-1)`[/C][C]1.13418044850272[/C][C]0.143357[/C][C]7.9116[/C][C]0[/C][C]0[/C][/ROW]
[ROW][C]`Y(t-2)`[/C][C]-0.16358852083517[/C][C]0.219819[/C][C]-0.7442[/C][C]0.460311[/C][C]0.230156[/C][/ROW]
[ROW][C]`Y(t-3)`[/C][C]-0.0100567924246914[/C][C]0.240403[/C][C]-0.0418[/C][C]0.966802[/C][C]0.483401[/C][/ROW]
[ROW][C]`Y(t-4)`[/C][C]0.116041570443329[/C][C]0.245562[/C][C]0.4726[/C][C]0.638628[/C][C]0.319314[/C][/ROW]
[ROW][C]`Y(t-5)
`[/C][C]0.0199336238572533[/C][C]0.167659[/C][C]0.1189[/C][C]0.905846[/C][C]0.452923[/C][/ROW]
[ROW][C]M1[/C][C]6.59174048804482[/C][C]3.52776[/C][C]1.8685[/C][C]0.067672[/C][C]0.033836[/C][/ROW]
[ROW][C]M2[/C][C]59.2644444889681[/C][C]3.924635[/C][C]15.1006[/C][C]0[/C][C]0[/C][/ROW]
[ROW][C]M3[/C][C]11.8349664900739[/C][C]9.576717[/C][C]1.2358[/C][C]0.222422[/C][C]0.111211[/C][/ROW]
[ROW][C]M4[/C][C]6.5260619174202[/C][C]9.758682[/C][C]0.6687[/C][C]0.506797[/C][C]0.253399[/C][/ROW]
[ROW][C]M5[/C][C]-2.29913043626265[/C][C]9.761515[/C][C]-0.2355[/C][C]0.814779[/C][C]0.407389[/C][/ROW]
[ROW][C]M6[/C][C]-13.1189551740509[/C][C]8.982316[/C][C]-1.4605[/C][C]0.150527[/C][C]0.075263[/C][/ROW]
[ROW][C]M7[/C][C]5.31204725573158[/C][C]4.34379[/C][C]1.2229[/C][C]0.227214[/C][C]0.113607[/C][/ROW]
[ROW][C]M8[/C][C]2.18713491252564[/C][C]4.80296[/C][C]0.4554[/C][C]0.650853[/C][C]0.325426[/C][/ROW]
[ROW][C]M9[/C][C]-0.462164422370506[/C][C]5.124348[/C][C]-0.0902[/C][C]0.928504[/C][C]0.464252[/C][/ROW]
[ROW][C]M10[/C][C]-1.93905835432363[/C][C]5.117028[/C][C]-0.3789[/C][C]0.706368[/C][C]0.353184[/C][/ROW]
[ROW][C]M11[/C][C]-1.94342270003405[/C][C]3.589363[/C][C]-0.5414[/C][C]0.590658[/C][C]0.295329[/C][/ROW]
[ROW][C]t[/C][C]-0.332543357065598[/C][C]0.162008[/C][C]-2.0526[/C][C]0.045468[/C][C]0.022734[/C][/ROW]
[/TABLE]
Source: https://freestatistics.org/blog/index.php?pk=67280&T=2

Globally Unique Identifier (entire table): ba.freestatistics.org/blog/index.php?pk=67280&T=2

As an alternative you can also use a QR Code:  

The GUIDs for individual cells are displayed in the table below:

Multiple Linear Regression - Ordinary Least Squares
VariableParameterS.D.T-STATH0: parameter = 02-tail p-value1-tail p-value
(Intercept)-45.736906454201827.93241-1.63740.1079510.053976
`Y(t-1)`1.134180448502720.1433577.911600
`Y(t-2)`-0.163588520835170.219819-0.74420.4603110.230156
`Y(t-3)`-0.01005679242469140.240403-0.04180.9668020.483401
`Y(t-4)`0.1160415704433290.2455620.47260.6386280.319314
`Y(t-5) `0.01993362385725330.1676590.11890.9058460.452923
M16.591740488044823.527761.86850.0676720.033836
M259.26444448896813.92463515.100600
M311.83496649007399.5767171.23580.2224220.111211
M46.52606191742029.7586820.66870.5067970.253399
M5-2.299130436262659.761515-0.23550.8147790.407389
M6-13.11895517405098.982316-1.46050.1505270.075263
M75.312047255731584.343791.22290.2272140.113607
M82.187134912525644.802960.45540.6508530.325426
M9-0.4621644223705065.124348-0.09020.9285040.464252
M10-1.939058354323635.117028-0.37890.7063680.353184
M11-1.943422700034053.589363-0.54140.5906580.295329
t-0.3325433570655980.162008-2.05260.0454680.022734


Multiple Linear Regression - Regression Statistics
Multiple R0.995598893828259
R-squared0.991217157392052
Adjusted R-squared0.988170048732152
F-TEST (value)325.297607675240
F-TEST (DF numerator)17
F-TEST (DF denominator)49
p-value0
Multiple Linear Regression - Residual Statistics
Residual Standard Deviation5.52017753496632
Sum Squared Residuals1493.14564085979

\begin{tabular}{lllllllll}
\hline
Multiple Linear Regression - Regression Statistics \tabularnewline
Multiple R & 0.995598893828259 \tabularnewline
R-squared & 0.991217157392052 \tabularnewline
Adjusted R-squared & 0.988170048732152 \tabularnewline
F-TEST (value) & 325.297607675240 \tabularnewline
F-TEST (DF numerator) & 17 \tabularnewline
F-TEST (DF denominator) & 49 \tabularnewline
p-value & 0 \tabularnewline
Multiple Linear Regression - Residual Statistics \tabularnewline
Residual Standard Deviation & 5.52017753496632 \tabularnewline
Sum Squared Residuals & 1493.14564085979 \tabularnewline
\hline
\end{tabular}
%Source: https://freestatistics.org/blog/index.php?pk=67280&T=3

[TABLE]
[ROW][C]Multiple Linear Regression - Regression Statistics[/C][/ROW]
[ROW][C]Multiple R[/C][C]0.995598893828259[/C][/ROW]
[ROW][C]R-squared[/C][C]0.991217157392052[/C][/ROW]
[ROW][C]Adjusted R-squared[/C][C]0.988170048732152[/C][/ROW]
[ROW][C]F-TEST (value)[/C][C]325.297607675240[/C][/ROW]
[ROW][C]F-TEST (DF numerator)[/C][C]17[/C][/ROW]
[ROW][C]F-TEST (DF denominator)[/C][C]49[/C][/ROW]
[ROW][C]p-value[/C][C]0[/C][/ROW]
[ROW][C]Multiple Linear Regression - Residual Statistics[/C][/ROW]
[ROW][C]Residual Standard Deviation[/C][C]5.52017753496632[/C][/ROW]
[ROW][C]Sum Squared Residuals[/C][C]1493.14564085979[/C][/ROW]
[/TABLE]
Source: https://freestatistics.org/blog/index.php?pk=67280&T=3

Globally Unique Identifier (entire table): ba.freestatistics.org/blog/index.php?pk=67280&T=3

As an alternative you can also use a QR Code:  

The GUIDs for individual cells are displayed in the table below:

Multiple Linear Regression - Regression Statistics
Multiple R0.995598893828259
R-squared0.991217157392052
Adjusted R-squared0.988170048732152
F-TEST (value)325.297607675240
F-TEST (DF numerator)17
F-TEST (DF denominator)49
p-value0
Multiple Linear Regression - Residual Statistics
Residual Standard Deviation5.52017753496632
Sum Squared Residuals1493.14564085979


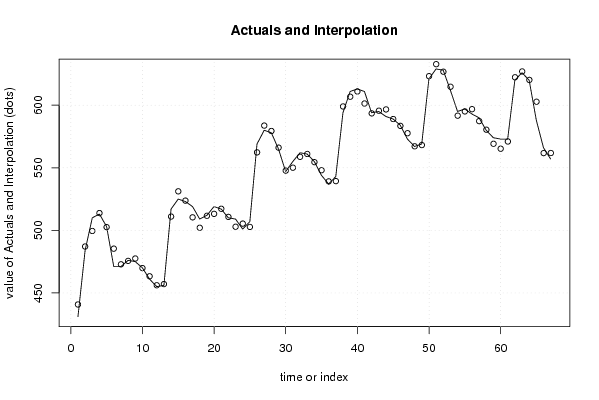
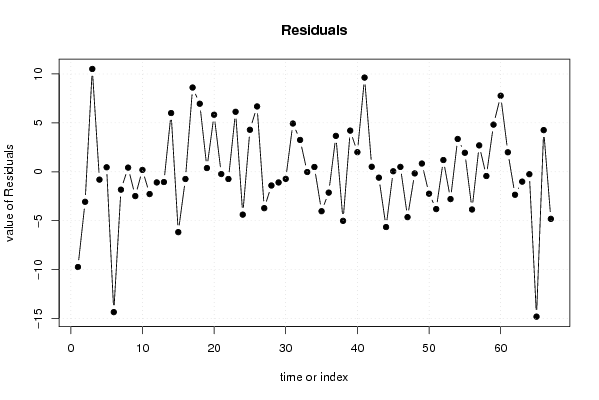
Multiple Linear Regression - Actuals, Interpolation, and Residuals
Time or IndexActualsInterpolationForecastResidualsPrediction Error
1431440.737933232989-9.73793323298886
2484487.070561029982-3.07056102998181
3510499.48903225731110.5109677426890
4513513.804409234132-0.80440923413228
5503502.5431601094510.456839890548531
6471485.347280478233-14.3472804782331
7471472.831242925902-1.83124292590170
8476475.5755867482210.424413251778947
9475477.485848823501-2.48584882350152
10470469.8116219890450.188378010954846
11461463.279240639035-2.27924063903517
12455456.090703194296-1.09070319429636
13456457.051024832742-1.05102483274220
14517510.9972667058626.00273329413807
15525531.172962689005-6.17296268900465
16523523.740349746562-0.740349746561775
17519510.388520461528.61147953847986
18509502.0446226958296.95537730417143
19512511.6200285705470.379971429452562
20519513.1686124438065.83138755619411
21517517.231801723617-0.231801723616744
22510510.73856331461-0.738563314610015
23509502.867960439776.13203956023007
24501505.381984429606-4.3819844296063
25507502.7091762664864.29082373351409
26569562.3210263196486.67897368035186
27580583.721539047799-3.72153904779922
28578579.404980817877-1.40498081787724
29565566.092669782408-1.09266978240755
30547547.726687292647-0.726687292647053
31555550.0690046020484.93099539795206
32562558.7475108878953.25248911210467
33561561.028837768938-0.0288377689378994
34555554.5117606680490.48823933195149
35544548.032488582235-4.0324885822346
36537539.13073089307-2.13073089307021
37543539.3339731648233.66602683517713
38594599.018777815697-5.01877781569742
39611606.7927667373184.20723326268211
40613610.997470259472.00252974053013
41611601.3709082335299.6290917664711
42594593.4897585645330.51024143546718
43595595.603534983781-0.603534983781001
44591596.65233291752-5.65233291751942
45589588.9489294887590.0510705112407572
46584583.50285464840.497145351600041
47573577.63961887935-4.63961887934948
48567567.168336819897-0.168336819897217
49569568.1603913148550.839608685145208
50621623.240993597469-2.24099359746939
51629632.813393882366-3.8133938823658
52628626.80315358731.19684641269974
53612614.792057453027-2.79205745302691
54595591.6499652743353.35003472566515
55597595.0597108524171.94028914758324
56593596.855957002558-3.85595700255832
57590587.3045821951852.69541780481541
58580580.435199379896-0.43519937989636
59574569.1806914596114.8193085403892
60573565.228244663137.77175533687009
61573571.0075011881051.99249881189465
62620622.351374531341-2.35137453134130
63626627.010305386201-1.01030538620139
64620620.249636354659-0.249636354658566
65588602.812683960065-14.8126839600650
66566561.7416856944244.25831430557641
67557561.816478065305-4.81647806530515

\begin{tabular}{lllllllll}
\hline
Multiple Linear Regression - Actuals, Interpolation, and Residuals \tabularnewline
Time or Index & Actuals & InterpolationForecast & ResidualsPrediction Error \tabularnewline
1 & 431 & 440.737933232989 & -9.73793323298886 \tabularnewline
2 & 484 & 487.070561029982 & -3.07056102998181 \tabularnewline
3 & 510 & 499.489032257311 & 10.5109677426890 \tabularnewline
4 & 513 & 513.804409234132 & -0.80440923413228 \tabularnewline
5 & 503 & 502.543160109451 & 0.456839890548531 \tabularnewline
6 & 471 & 485.347280478233 & -14.3472804782331 \tabularnewline
7 & 471 & 472.831242925902 & -1.83124292590170 \tabularnewline
8 & 476 & 475.575586748221 & 0.424413251778947 \tabularnewline
9 & 475 & 477.485848823501 & -2.48584882350152 \tabularnewline
10 & 470 & 469.811621989045 & 0.188378010954846 \tabularnewline
11 & 461 & 463.279240639035 & -2.27924063903517 \tabularnewline
12 & 455 & 456.090703194296 & -1.09070319429636 \tabularnewline
13 & 456 & 457.051024832742 & -1.05102483274220 \tabularnewline
14 & 517 & 510.997266705862 & 6.00273329413807 \tabularnewline
15 & 525 & 531.172962689005 & -6.17296268900465 \tabularnewline
16 & 523 & 523.740349746562 & -0.740349746561775 \tabularnewline
17 & 519 & 510.38852046152 & 8.61147953847986 \tabularnewline
18 & 509 & 502.044622695829 & 6.95537730417143 \tabularnewline
19 & 512 & 511.620028570547 & 0.379971429452562 \tabularnewline
20 & 519 & 513.168612443806 & 5.83138755619411 \tabularnewline
21 & 517 & 517.231801723617 & -0.231801723616744 \tabularnewline
22 & 510 & 510.73856331461 & -0.738563314610015 \tabularnewline
23 & 509 & 502.86796043977 & 6.13203956023007 \tabularnewline
24 & 501 & 505.381984429606 & -4.3819844296063 \tabularnewline
25 & 507 & 502.709176266486 & 4.29082373351409 \tabularnewline
26 & 569 & 562.321026319648 & 6.67897368035186 \tabularnewline
27 & 580 & 583.721539047799 & -3.72153904779922 \tabularnewline
28 & 578 & 579.404980817877 & -1.40498081787724 \tabularnewline
29 & 565 & 566.092669782408 & -1.09266978240755 \tabularnewline
30 & 547 & 547.726687292647 & -0.726687292647053 \tabularnewline
31 & 555 & 550.069004602048 & 4.93099539795206 \tabularnewline
32 & 562 & 558.747510887895 & 3.25248911210467 \tabularnewline
33 & 561 & 561.028837768938 & -0.0288377689378994 \tabularnewline
34 & 555 & 554.511760668049 & 0.48823933195149 \tabularnewline
35 & 544 & 548.032488582235 & -4.0324885822346 \tabularnewline
36 & 537 & 539.13073089307 & -2.13073089307021 \tabularnewline
37 & 543 & 539.333973164823 & 3.66602683517713 \tabularnewline
38 & 594 & 599.018777815697 & -5.01877781569742 \tabularnewline
39 & 611 & 606.792766737318 & 4.20723326268211 \tabularnewline
40 & 613 & 610.99747025947 & 2.00252974053013 \tabularnewline
41 & 611 & 601.370908233529 & 9.6290917664711 \tabularnewline
42 & 594 & 593.489758564533 & 0.51024143546718 \tabularnewline
43 & 595 & 595.603534983781 & -0.603534983781001 \tabularnewline
44 & 591 & 596.65233291752 & -5.65233291751942 \tabularnewline
45 & 589 & 588.948929488759 & 0.0510705112407572 \tabularnewline
46 & 584 & 583.5028546484 & 0.497145351600041 \tabularnewline
47 & 573 & 577.63961887935 & -4.63961887934948 \tabularnewline
48 & 567 & 567.168336819897 & -0.168336819897217 \tabularnewline
49 & 569 & 568.160391314855 & 0.839608685145208 \tabularnewline
50 & 621 & 623.240993597469 & -2.24099359746939 \tabularnewline
51 & 629 & 632.813393882366 & -3.8133938823658 \tabularnewline
52 & 628 & 626.8031535873 & 1.19684641269974 \tabularnewline
53 & 612 & 614.792057453027 & -2.79205745302691 \tabularnewline
54 & 595 & 591.649965274335 & 3.35003472566515 \tabularnewline
55 & 597 & 595.059710852417 & 1.94028914758324 \tabularnewline
56 & 593 & 596.855957002558 & -3.85595700255832 \tabularnewline
57 & 590 & 587.304582195185 & 2.69541780481541 \tabularnewline
58 & 580 & 580.435199379896 & -0.43519937989636 \tabularnewline
59 & 574 & 569.180691459611 & 4.8193085403892 \tabularnewline
60 & 573 & 565.22824466313 & 7.77175533687009 \tabularnewline
61 & 573 & 571.007501188105 & 1.99249881189465 \tabularnewline
62 & 620 & 622.351374531341 & -2.35137453134130 \tabularnewline
63 & 626 & 627.010305386201 & -1.01030538620139 \tabularnewline
64 & 620 & 620.249636354659 & -0.249636354658566 \tabularnewline
65 & 588 & 602.812683960065 & -14.8126839600650 \tabularnewline
66 & 566 & 561.741685694424 & 4.25831430557641 \tabularnewline
67 & 557 & 561.816478065305 & -4.81647806530515 \tabularnewline
\hline
\end{tabular}
%Source: https://freestatistics.org/blog/index.php?pk=67280&T=4

[TABLE]
[ROW][C]Multiple Linear Regression - Actuals, Interpolation, and Residuals[/C][/ROW]
[ROW][C]Time or Index[/C][C]Actuals[/C][C]InterpolationForecast[/C][C]ResidualsPrediction Error[/C][/ROW]
[ROW][C]1[/C][C]431[/C][C]440.737933232989[/C][C]-9.73793323298886[/C][/ROW]
[ROW][C]2[/C][C]484[/C][C]487.070561029982[/C][C]-3.07056102998181[/C][/ROW]
[ROW][C]3[/C][C]510[/C][C]499.489032257311[/C][C]10.5109677426890[/C][/ROW]
[ROW][C]4[/C][C]513[/C][C]513.804409234132[/C][C]-0.80440923413228[/C][/ROW]
[ROW][C]5[/C][C]503[/C][C]502.543160109451[/C][C]0.456839890548531[/C][/ROW]
[ROW][C]6[/C][C]471[/C][C]485.347280478233[/C][C]-14.3472804782331[/C][/ROW]
[ROW][C]7[/C][C]471[/C][C]472.831242925902[/C][C]-1.83124292590170[/C][/ROW]
[ROW][C]8[/C][C]476[/C][C]475.575586748221[/C][C]0.424413251778947[/C][/ROW]
[ROW][C]9[/C][C]475[/C][C]477.485848823501[/C][C]-2.48584882350152[/C][/ROW]
[ROW][C]10[/C][C]470[/C][C]469.811621989045[/C][C]0.188378010954846[/C][/ROW]
[ROW][C]11[/C][C]461[/C][C]463.279240639035[/C][C]-2.27924063903517[/C][/ROW]
[ROW][C]12[/C][C]455[/C][C]456.090703194296[/C][C]-1.09070319429636[/C][/ROW]
[ROW][C]13[/C][C]456[/C][C]457.051024832742[/C][C]-1.05102483274220[/C][/ROW]
[ROW][C]14[/C][C]517[/C][C]510.997266705862[/C][C]6.00273329413807[/C][/ROW]
[ROW][C]15[/C][C]525[/C][C]531.172962689005[/C][C]-6.17296268900465[/C][/ROW]
[ROW][C]16[/C][C]523[/C][C]523.740349746562[/C][C]-0.740349746561775[/C][/ROW]
[ROW][C]17[/C][C]519[/C][C]510.38852046152[/C][C]8.61147953847986[/C][/ROW]
[ROW][C]18[/C][C]509[/C][C]502.044622695829[/C][C]6.95537730417143[/C][/ROW]
[ROW][C]19[/C][C]512[/C][C]511.620028570547[/C][C]0.379971429452562[/C][/ROW]
[ROW][C]20[/C][C]519[/C][C]513.168612443806[/C][C]5.83138755619411[/C][/ROW]
[ROW][C]21[/C][C]517[/C][C]517.231801723617[/C][C]-0.231801723616744[/C][/ROW]
[ROW][C]22[/C][C]510[/C][C]510.73856331461[/C][C]-0.738563314610015[/C][/ROW]
[ROW][C]23[/C][C]509[/C][C]502.86796043977[/C][C]6.13203956023007[/C][/ROW]
[ROW][C]24[/C][C]501[/C][C]505.381984429606[/C][C]-4.3819844296063[/C][/ROW]
[ROW][C]25[/C][C]507[/C][C]502.709176266486[/C][C]4.29082373351409[/C][/ROW]
[ROW][C]26[/C][C]569[/C][C]562.321026319648[/C][C]6.67897368035186[/C][/ROW]
[ROW][C]27[/C][C]580[/C][C]583.721539047799[/C][C]-3.72153904779922[/C][/ROW]
[ROW][C]28[/C][C]578[/C][C]579.404980817877[/C][C]-1.40498081787724[/C][/ROW]
[ROW][C]29[/C][C]565[/C][C]566.092669782408[/C][C]-1.09266978240755[/C][/ROW]
[ROW][C]30[/C][C]547[/C][C]547.726687292647[/C][C]-0.726687292647053[/C][/ROW]
[ROW][C]31[/C][C]555[/C][C]550.069004602048[/C][C]4.93099539795206[/C][/ROW]
[ROW][C]32[/C][C]562[/C][C]558.747510887895[/C][C]3.25248911210467[/C][/ROW]
[ROW][C]33[/C][C]561[/C][C]561.028837768938[/C][C]-0.0288377689378994[/C][/ROW]
[ROW][C]34[/C][C]555[/C][C]554.511760668049[/C][C]0.48823933195149[/C][/ROW]
[ROW][C]35[/C][C]544[/C][C]548.032488582235[/C][C]-4.0324885822346[/C][/ROW]
[ROW][C]36[/C][C]537[/C][C]539.13073089307[/C][C]-2.13073089307021[/C][/ROW]
[ROW][C]37[/C][C]543[/C][C]539.333973164823[/C][C]3.66602683517713[/C][/ROW]
[ROW][C]38[/C][C]594[/C][C]599.018777815697[/C][C]-5.01877781569742[/C][/ROW]
[ROW][C]39[/C][C]611[/C][C]606.792766737318[/C][C]4.20723326268211[/C][/ROW]
[ROW][C]40[/C][C]613[/C][C]610.99747025947[/C][C]2.00252974053013[/C][/ROW]
[ROW][C]41[/C][C]611[/C][C]601.370908233529[/C][C]9.6290917664711[/C][/ROW]
[ROW][C]42[/C][C]594[/C][C]593.489758564533[/C][C]0.51024143546718[/C][/ROW]
[ROW][C]43[/C][C]595[/C][C]595.603534983781[/C][C]-0.603534983781001[/C][/ROW]
[ROW][C]44[/C][C]591[/C][C]596.65233291752[/C][C]-5.65233291751942[/C][/ROW]
[ROW][C]45[/C][C]589[/C][C]588.948929488759[/C][C]0.0510705112407572[/C][/ROW]
[ROW][C]46[/C][C]584[/C][C]583.5028546484[/C][C]0.497145351600041[/C][/ROW]
[ROW][C]47[/C][C]573[/C][C]577.63961887935[/C][C]-4.63961887934948[/C][/ROW]
[ROW][C]48[/C][C]567[/C][C]567.168336819897[/C][C]-0.168336819897217[/C][/ROW]
[ROW][C]49[/C][C]569[/C][C]568.160391314855[/C][C]0.839608685145208[/C][/ROW]
[ROW][C]50[/C][C]621[/C][C]623.240993597469[/C][C]-2.24099359746939[/C][/ROW]
[ROW][C]51[/C][C]629[/C][C]632.813393882366[/C][C]-3.8133938823658[/C][/ROW]
[ROW][C]52[/C][C]628[/C][C]626.8031535873[/C][C]1.19684641269974[/C][/ROW]
[ROW][C]53[/C][C]612[/C][C]614.792057453027[/C][C]-2.79205745302691[/C][/ROW]
[ROW][C]54[/C][C]595[/C][C]591.649965274335[/C][C]3.35003472566515[/C][/ROW]
[ROW][C]55[/C][C]597[/C][C]595.059710852417[/C][C]1.94028914758324[/C][/ROW]
[ROW][C]56[/C][C]593[/C][C]596.855957002558[/C][C]-3.85595700255832[/C][/ROW]
[ROW][C]57[/C][C]590[/C][C]587.304582195185[/C][C]2.69541780481541[/C][/ROW]
[ROW][C]58[/C][C]580[/C][C]580.435199379896[/C][C]-0.43519937989636[/C][/ROW]
[ROW][C]59[/C][C]574[/C][C]569.180691459611[/C][C]4.8193085403892[/C][/ROW]
[ROW][C]60[/C][C]573[/C][C]565.22824466313[/C][C]7.77175533687009[/C][/ROW]
[ROW][C]61[/C][C]573[/C][C]571.007501188105[/C][C]1.99249881189465[/C][/ROW]
[ROW][C]62[/C][C]620[/C][C]622.351374531341[/C][C]-2.35137453134130[/C][/ROW]
[ROW][C]63[/C][C]626[/C][C]627.010305386201[/C][C]-1.01030538620139[/C][/ROW]
[ROW][C]64[/C][C]620[/C][C]620.249636354659[/C][C]-0.249636354658566[/C][/ROW]
[ROW][C]65[/C][C]588[/C][C]602.812683960065[/C][C]-14.8126839600650[/C][/ROW]
[ROW][C]66[/C][C]566[/C][C]561.741685694424[/C][C]4.25831430557641[/C][/ROW]
[ROW][C]67[/C][C]557[/C][C]561.816478065305[/C][C]-4.81647806530515[/C][/ROW]
[/TABLE]
Source: https://freestatistics.org/blog/index.php?pk=67280&T=4

Globally Unique Identifier (entire table): ba.freestatistics.org/blog/index.php?pk=67280&T=4

As an alternative you can also use a QR Code:  

The GUIDs for individual cells are displayed in the table below:

Multiple Linear Regression - Actuals, Interpolation, and Residuals
Time or IndexActualsInterpolationForecastResidualsPrediction Error
1431440.737933232989-9.73793323298886
2484487.070561029982-3.07056102998181
3510499.48903225731110.5109677426890
4513513.804409234132-0.80440923413228
5503502.5431601094510.456839890548531
6471485.347280478233-14.3472804782331
7471472.831242925902-1.83124292590170
8476475.5755867482210.424413251778947
9475477.485848823501-2.48584882350152
10470469.8116219890450.188378010954846
11461463.279240639035-2.27924063903517
12455456.090703194296-1.09070319429636
13456457.051024832742-1.05102483274220
14517510.9972667058626.00273329413807
15525531.172962689005-6.17296268900465
16523523.740349746562-0.740349746561775
17519510.388520461528.61147953847986
18509502.0446226958296.95537730417143
19512511.6200285705470.379971429452562
20519513.1686124438065.83138755619411
21517517.231801723617-0.231801723616744
22510510.73856331461-0.738563314610015
23509502.867960439776.13203956023007
24501505.381984429606-4.3819844296063
25507502.7091762664864.29082373351409
26569562.3210263196486.67897368035186
27580583.721539047799-3.72153904779922
28578579.404980817877-1.40498081787724
29565566.092669782408-1.09266978240755
30547547.726687292647-0.726687292647053
31555550.0690046020484.93099539795206
32562558.7475108878953.25248911210467
33561561.028837768938-0.0288377689378994
34555554.5117606680490.48823933195149
35544548.032488582235-4.0324885822346
36537539.13073089307-2.13073089307021
37543539.3339731648233.66602683517713
38594599.018777815697-5.01877781569742
39611606.7927667373184.20723326268211
40613610.997470259472.00252974053013
41611601.3709082335299.6290917664711
42594593.4897585645330.51024143546718
43595595.603534983781-0.603534983781001
44591596.65233291752-5.65233291751942
45589588.9489294887590.0510705112407572
46584583.50285464840.497145351600041
47573577.63961887935-4.63961887934948
48567567.168336819897-0.168336819897217
49569568.1603913148550.839608685145208
50621623.240993597469-2.24099359746939
51629632.813393882366-3.8133938823658
52628626.80315358731.19684641269974
53612614.792057453027-2.79205745302691
54595591.6499652743353.35003472566515
55597595.0597108524171.94028914758324
56593596.855957002558-3.85595700255832
57590587.3045821951852.69541780481541
58580580.435199379896-0.43519937989636
59574569.1806914596114.8193085403892
60573565.228244663137.77175533687009
61573571.0075011881051.99249881189465
62620622.351374531341-2.35137453134130
63626627.010305386201-1.01030538620139
64620620.249636354659-0.249636354658566
65588602.812683960065-14.8126839600650
66566561.7416856944244.25831430557641
67557561.816478065305-4.81647806530515


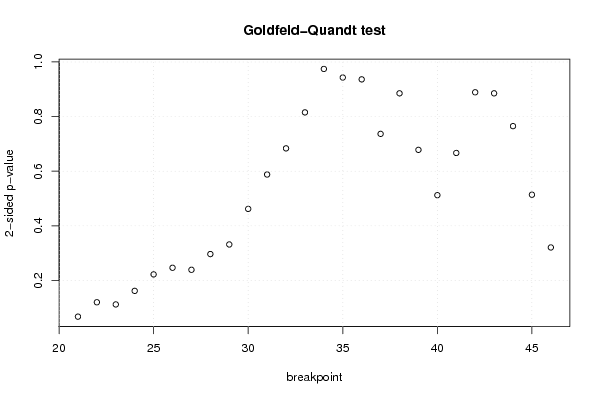
Goldfeld-Quandt test for Heteroskedasticity
p-valuesAlternative Hypothesis
breakpoint indexgreater2-sidedless
210.9662243347295170.06755133054096570.0337756652704828
220.9398798069856540.1202403860286920.0601201930143459
230.9438431258424610.1123137483150780.0561568741575388
240.9190037047780470.1619925904439060.0809962952219529
250.8888418797177680.2223162405644640.111158120282232
260.8767210941086850.2465578117826300.123278905891315
270.8804491674112420.2391016651775150.119550832588758
280.8516601649977450.2966796700045100.148339835002255
290.8340695741221960.3318608517556080.165930425877804
300.7689757834171180.4620484331657640.231024216582882
310.7060158171833240.5879683656333520.293984182816676
320.6581313955394570.6837372089210870.341868604460543
330.5923147000663490.8153705998673030.407685299933651
340.5127890950807830.9744218098384340.487210904919217
350.4715187524928330.9430375049856650.528481247507167
360.4681523646975860.9363047293951730.531847635302414
370.3683817922585460.7367635845170930.631618207741454
380.4426179233029530.8852358466059060.557382076697047
390.3391095032660600.6782190065321190.66089049673394
400.2561129501759440.5122259003518890.743887049824056
410.6665578714036630.6668842571926750.333442128596337
420.5555309604271880.8889380791456240.444469039572812
430.442597723495940.885195446991880.55740227650406
440.3825375944677930.7650751889355850.617462405532208
450.2569777954808190.5139555909616370.743022204519181
460.1604510161601960.3209020323203910.839548983839804

\begin{tabular}{lllllllll}
\hline
Goldfeld-Quandt test for Heteroskedasticity \tabularnewline
p-values & Alternative Hypothesis \tabularnewline
breakpoint index & greater & 2-sided & less \tabularnewline
21 & 0.966224334729517 & 0.0675513305409657 & 0.0337756652704828 \tabularnewline
22 & 0.939879806985654 & 0.120240386028692 & 0.0601201930143459 \tabularnewline
23 & 0.943843125842461 & 0.112313748315078 & 0.0561568741575388 \tabularnewline
24 & 0.919003704778047 & 0.161992590443906 & 0.0809962952219529 \tabularnewline
25 & 0.888841879717768 & 0.222316240564464 & 0.111158120282232 \tabularnewline
26 & 0.876721094108685 & 0.246557811782630 & 0.123278905891315 \tabularnewline
27 & 0.880449167411242 & 0.239101665177515 & 0.119550832588758 \tabularnewline
28 & 0.851660164997745 & 0.296679670004510 & 0.148339835002255 \tabularnewline
29 & 0.834069574122196 & 0.331860851755608 & 0.165930425877804 \tabularnewline
30 & 0.768975783417118 & 0.462048433165764 & 0.231024216582882 \tabularnewline
31 & 0.706015817183324 & 0.587968365633352 & 0.293984182816676 \tabularnewline
32 & 0.658131395539457 & 0.683737208921087 & 0.341868604460543 \tabularnewline
33 & 0.592314700066349 & 0.815370599867303 & 0.407685299933651 \tabularnewline
34 & 0.512789095080783 & 0.974421809838434 & 0.487210904919217 \tabularnewline
35 & 0.471518752492833 & 0.943037504985665 & 0.528481247507167 \tabularnewline
36 & 0.468152364697586 & 0.936304729395173 & 0.531847635302414 \tabularnewline
37 & 0.368381792258546 & 0.736763584517093 & 0.631618207741454 \tabularnewline
38 & 0.442617923302953 & 0.885235846605906 & 0.557382076697047 \tabularnewline
39 & 0.339109503266060 & 0.678219006532119 & 0.66089049673394 \tabularnewline
40 & 0.256112950175944 & 0.512225900351889 & 0.743887049824056 \tabularnewline
41 & 0.666557871403663 & 0.666884257192675 & 0.333442128596337 \tabularnewline
42 & 0.555530960427188 & 0.888938079145624 & 0.444469039572812 \tabularnewline
43 & 0.44259772349594 & 0.88519544699188 & 0.55740227650406 \tabularnewline
44 & 0.382537594467793 & 0.765075188935585 & 0.617462405532208 \tabularnewline
45 & 0.256977795480819 & 0.513955590961637 & 0.743022204519181 \tabularnewline
46 & 0.160451016160196 & 0.320902032320391 & 0.839548983839804 \tabularnewline
\hline
\end{tabular}
%Source: https://freestatistics.org/blog/index.php?pk=67280&T=5

[TABLE]
[ROW][C]Goldfeld-Quandt test for Heteroskedasticity[/C][/ROW]
[ROW][C]p-values[/C][C]Alternative Hypothesis[/C][/ROW]
[ROW][C]breakpoint index[/C][C]greater[/C][C]2-sided[/C][C]less[/C][/ROW]
[ROW][C]21[/C][C]0.966224334729517[/C][C]0.0675513305409657[/C][C]0.0337756652704828[/C][/ROW]
[ROW][C]22[/C][C]0.939879806985654[/C][C]0.120240386028692[/C][C]0.0601201930143459[/C][/ROW]
[ROW][C]23[/C][C]0.943843125842461[/C][C]0.112313748315078[/C][C]0.0561568741575388[/C][/ROW]
[ROW][C]24[/C][C]0.919003704778047[/C][C]0.161992590443906[/C][C]0.0809962952219529[/C][/ROW]
[ROW][C]25[/C][C]0.888841879717768[/C][C]0.222316240564464[/C][C]0.111158120282232[/C][/ROW]
[ROW][C]26[/C][C]0.876721094108685[/C][C]0.246557811782630[/C][C]0.123278905891315[/C][/ROW]
[ROW][C]27[/C][C]0.880449167411242[/C][C]0.239101665177515[/C][C]0.119550832588758[/C][/ROW]
[ROW][C]28[/C][C]0.851660164997745[/C][C]0.296679670004510[/C][C]0.148339835002255[/C][/ROW]
[ROW][C]29[/C][C]0.834069574122196[/C][C]0.331860851755608[/C][C]0.165930425877804[/C][/ROW]
[ROW][C]30[/C][C]0.768975783417118[/C][C]0.462048433165764[/C][C]0.231024216582882[/C][/ROW]
[ROW][C]31[/C][C]0.706015817183324[/C][C]0.587968365633352[/C][C]0.293984182816676[/C][/ROW]
[ROW][C]32[/C][C]0.658131395539457[/C][C]0.683737208921087[/C][C]0.341868604460543[/C][/ROW]
[ROW][C]33[/C][C]0.592314700066349[/C][C]0.815370599867303[/C][C]0.407685299933651[/C][/ROW]
[ROW][C]34[/C][C]0.512789095080783[/C][C]0.974421809838434[/C][C]0.487210904919217[/C][/ROW]
[ROW][C]35[/C][C]0.471518752492833[/C][C]0.943037504985665[/C][C]0.528481247507167[/C][/ROW]
[ROW][C]36[/C][C]0.468152364697586[/C][C]0.936304729395173[/C][C]0.531847635302414[/C][/ROW]
[ROW][C]37[/C][C]0.368381792258546[/C][C]0.736763584517093[/C][C]0.631618207741454[/C][/ROW]
[ROW][C]38[/C][C]0.442617923302953[/C][C]0.885235846605906[/C][C]0.557382076697047[/C][/ROW]
[ROW][C]39[/C][C]0.339109503266060[/C][C]0.678219006532119[/C][C]0.66089049673394[/C][/ROW]
[ROW][C]40[/C][C]0.256112950175944[/C][C]0.512225900351889[/C][C]0.743887049824056[/C][/ROW]
[ROW][C]41[/C][C]0.666557871403663[/C][C]0.666884257192675[/C][C]0.333442128596337[/C][/ROW]
[ROW][C]42[/C][C]0.555530960427188[/C][C]0.888938079145624[/C][C]0.444469039572812[/C][/ROW]
[ROW][C]43[/C][C]0.44259772349594[/C][C]0.88519544699188[/C][C]0.55740227650406[/C][/ROW]
[ROW][C]44[/C][C]0.382537594467793[/C][C]0.765075188935585[/C][C]0.617462405532208[/C][/ROW]
[ROW][C]45[/C][C]0.256977795480819[/C][C]0.513955590961637[/C][C]0.743022204519181[/C][/ROW]
[ROW][C]46[/C][C]0.160451016160196[/C][C]0.320902032320391[/C][C]0.839548983839804[/C][/ROW]
[/TABLE]
Source: https://freestatistics.org/blog/index.php?pk=67280&T=5

Globally Unique Identifier (entire table): ba.freestatistics.org/blog/index.php?pk=67280&T=5

As an alternative you can also use a QR Code:  

The GUIDs for individual cells are displayed in the table below:

Goldfeld-Quandt test for Heteroskedasticity
p-valuesAlternative Hypothesis
breakpoint indexgreater2-sidedless
210.9662243347295170.06755133054096570.0337756652704828
220.9398798069856540.1202403860286920.0601201930143459
230.9438431258424610.1123137483150780.0561568741575388
240.9190037047780470.1619925904439060.0809962952219529
250.8888418797177680.2223162405644640.111158120282232
260.8767210941086850.2465578117826300.123278905891315
270.8804491674112420.2391016651775150.119550832588758
280.8516601649977450.2966796700045100.148339835002255
290.8340695741221960.3318608517556080.165930425877804
300.7689757834171180.4620484331657640.231024216582882
310.7060158171833240.5879683656333520.293984182816676
320.6581313955394570.6837372089210870.341868604460543
330.5923147000663490.8153705998673030.407685299933651
340.5127890950807830.9744218098384340.487210904919217
350.4715187524928330.9430375049856650.528481247507167
360.4681523646975860.9363047293951730.531847635302414
370.3683817922585460.7367635845170930.631618207741454
380.4426179233029530.8852358466059060.557382076697047
390.3391095032660600.6782190065321190.66089049673394
400.2561129501759440.5122259003518890.743887049824056
410.6665578714036630.6668842571926750.333442128596337
420.5555309604271880.8889380791456240.444469039572812
430.442597723495940.885195446991880.55740227650406
440.3825375944677930.7650751889355850.617462405532208
450.2569777954808190.5139555909616370.743022204519181
460.1604510161601960.3209020323203910.839548983839804


Meta Analysis of Goldfeld-Quandt test for Heteroskedasticity
Description# significant tests% significant testsOK/NOK
1% type I error level00OK
5% type I error level00OK
10% type I error level10.0384615384615385OK

\begin{tabular}{lllllllll}
\hline
Meta Analysis of Goldfeld-Quandt test for Heteroskedasticity \tabularnewline
Description & # significant tests & % significant tests & OK/NOK \tabularnewline
1% type I error level & 0 & 0 & OK \tabularnewline
5% type I error level & 0 & 0 & OK \tabularnewline
10% type I error level & 1 & 0.0384615384615385 & OK \tabularnewline
\hline
\end{tabular}
%Source: https://freestatistics.org/blog/index.php?pk=67280&T=6

[TABLE]
[ROW][C]Meta Analysis of Goldfeld-Quandt test for Heteroskedasticity[/C][/ROW]
[ROW][C]Description[/C][C]# significant tests[/C][C]% significant tests[/C][C]OK/NOK[/C][/ROW]
[ROW][C]1% type I error level[/C][C]0[/C][C]0[/C][C]OK[/C][/ROW]
[ROW][C]5% type I error level[/C][C]0[/C][C]0[/C][C]OK[/C][/ROW]
[ROW][C]10% type I error level[/C][C]1[/C][C]0.0384615384615385[/C][C]OK[/C][/ROW]
[/TABLE]
Source: https://freestatistics.org/blog/index.php?pk=67280&T=6

Globally Unique Identifier (entire table): ba.freestatistics.org/blog/index.php?pk=67280&T=6

As an alternative you can also use a QR Code:  

The GUIDs for individual cells are displayed in the table below:

Meta Analysis of Goldfeld-Quandt test for Heteroskedasticity
Description# significant tests% significant testsOK/NOK
1% type I error level00OK
5% type I error level00OK
10% type I error level10.0384615384615385OK


Parameters (Session):
par1 = 1 ; par2 = Include Monthly Dummies ; par3 = Linear Trend ;
Parameters (R input):
par1 = 1 ; par2 = Include Monthly Dummies ; par3 = Linear Trend ;
R code (references can be found in the software module):
library(lattice)
library(lmtest)
n25 <- 25 #minimum number of obs. for Goldfeld-Quandt test
par1 <- as.numeric(par1)
x <- t(y)
k <- length(x[1,])
n <- length(x[,1])
x1 <- cbind(x[,par1], x[,1:k!=par1])
mycolnames <- c(colnames(x)[par1], colnames(x)[1:k!=par1])
colnames(x1) <- mycolnames #colnames(x)[par1]
x <- x1
if (par3 == 'First Differences'){
x2 <- array(0, dim=c(n-1,k), dimnames=list(1:(n-1), paste('(1-B)',colnames(x),sep='')))
for (i in 1:n-1) {
for (j in 1:k) {
x2[i,j] <- x[i+1,j] - x[i,j]
}
}
x <- x2
}
if (par2 == 'Include Monthly Dummies'){
x2 <- array(0, dim=c(n,11), dimnames=list(1:n, paste('M', seq(1:11), sep ='')))
for (i in 1:11){
x2[seq(i,n,12),i] <- 1
}
x <- cbind(x, x2)
}
if (par2 == 'Include Quarterly Dummies'){
x2 <- array(0, dim=c(n,3), dimnames=list(1:n, paste('Q', seq(1:3), sep ='')))
for (i in 1:3){
x2[seq(i,n,4),i] <- 1
}
x <- cbind(x, x2)
}
k <- length(x[1,])
if (par3 == 'Linear Trend'){
x <- cbind(x, c(1:n))
colnames(x)[k+1] <- 't'
}
x
k <- length(x[1,])
df <- as.data.frame(x)
(mylm <- lm(df))
(mysum <- summary(mylm))
if (n > n25) {
kp3 <- k + 3
nmkm3 <- n - k - 3
gqarr <- array(NA, dim=c(nmkm3-kp3+1,3))
numgqtests <- 0
numsignificant1 <- 0
numsignificant5 <- 0
numsignificant10 <- 0
for (mypoint in kp3:nmkm3) {
j <- 0
numgqtests <- numgqtests + 1
for (myalt in c('greater', 'two.sided', 'less')) {
j <- j + 1
gqarr[mypoint-kp3+1,j] <- gqtest(mylm, point=mypoint, alternative=myalt)$p.value
}
if (gqarr[mypoint-kp3+1,2] < 0.01) numsignificant1 <- numsignificant1 + 1
if (gqarr[mypoint-kp3+1,2] < 0.05) numsignificant5 <- numsignificant5 + 1
if (gqarr[mypoint-kp3+1,2] < 0.10) numsignificant10 <- numsignificant10 + 1
}
gqarr
}
bitmap(file='test0.png')
plot(x[,1], type='l', main='Actuals and Interpolation', ylab='value of Actuals and Interpolation (dots)', xlab='time or index')
points(x[,1]-mysum$resid)
grid()
dev.off()
bitmap(file='test1.png')
plot(mysum$resid, type='b', pch=19, main='Residuals', ylab='value of Residuals', xlab='time or index')
grid()
dev.off()
bitmap(file='test2.png')
hist(mysum$resid, main='Residual Histogram', xlab='values of Residuals')
grid()
dev.off()
bitmap(file='test3.png')
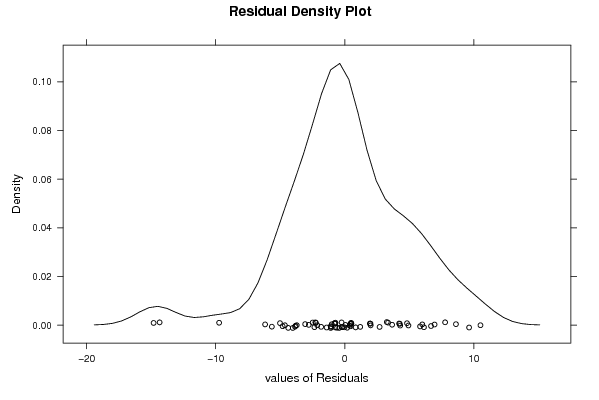
densityplot(~mysum$resid,col='black',main='Residual Density Plot', xlab='values of Residuals')
dev.off()
bitmap(file='test4.png')
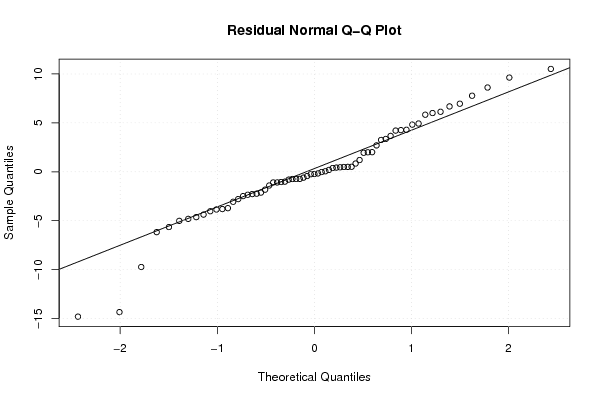
qqnorm(mysum$resid, main='Residual Normal Q-Q Plot')
qqline(mysum$resid)
grid()
dev.off()
(myerror <- as.ts(mysum$resid))
bitmap(file='test5.png')
dum <- cbind(lag(myerror,k=1),myerror)
dum
dum1 <- dum[2:length(myerror),]
dum1
z <- as.data.frame(dum1)
z
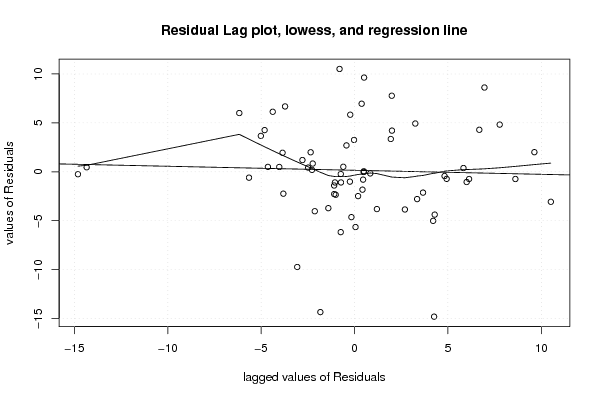
plot(z,main=paste('Residual Lag plot, lowess, and regression line'), ylab='values of Residuals', xlab='lagged values of Residuals')
lines(lowess(z))
abline(lm(z))
grid()
dev.off()
bitmap(file='test6.png')
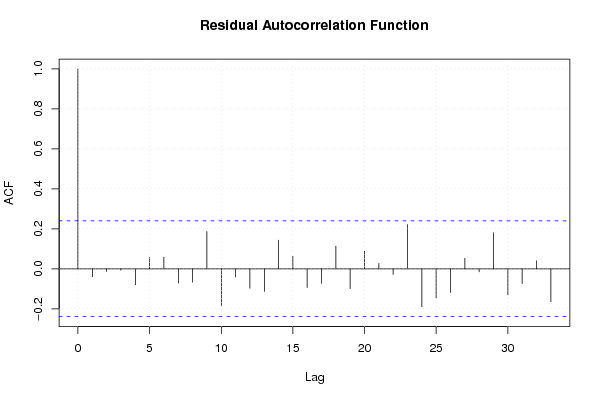
acf(mysum$resid, lag.max=length(mysum$resid)/2, main='Residual Autocorrelation Function')
grid()
dev.off()
bitmap(file='test7.png')
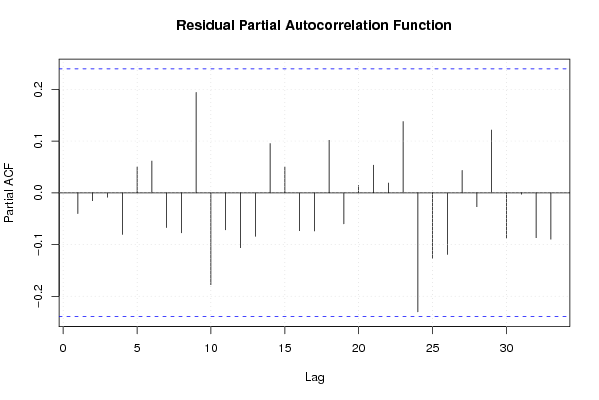
pacf(mysum$resid, lag.max=length(mysum$resid)/2, main='Residual Partial Autocorrelation Function')
grid()
dev.off()
bitmap(file='test8.png')
opar <- par(mfrow = c(2,2), oma = c(0, 0, 1.1, 0))
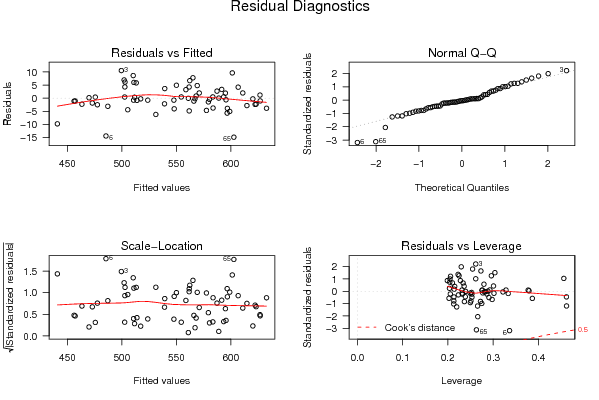
plot(mylm, las = 1, sub='Residual Diagnostics')
par(opar)
dev.off()
if (n > n25) {
bitmap(file='test9.png')
plot(kp3:nmkm3,gqarr[,2], main='Goldfeld-Quandt test',ylab='2-sided p-value',xlab='breakpoint')
grid()
dev.off()
}
load(file='createtable')
a<-table.start()
a<-table.row.start(a)
a<-table.element(a, 'Multiple Linear Regression - Estimated Regression Equation', 1, TRUE)
a<-table.row.end(a)
myeq <- colnames(x)[1]
myeq <- paste(myeq, '[t] = ', sep='')
for (i in 1:k){
if (mysum$coefficients[i,1] > 0) myeq <- paste(myeq, '+', '')
myeq <- paste(myeq, mysum$coefficients[i,1], sep=' ')
if (rownames(mysum$coefficients)[i] != '(Intercept)') {
myeq <- paste(myeq, rownames(mysum$coefficients)[i], sep='')
if (rownames(mysum$coefficients)[i] != 't') myeq <- paste(myeq, '[t]', sep='')
}
}
myeq <- paste(myeq, ' + e[t]')
a<-table.row.start(a)
a<-table.element(a, myeq)
a<-table.row.end(a)
a<-table.end(a)
table.save(a,file='mytable1.tab')
a<-table.start()
a<-table.row.start(a)
a<-table.element(a,hyperlink('ols1.htm','Multiple Linear Regression - Ordinary Least Squares',''), 6, TRUE)
a<-table.row.end(a)
a<-table.row.start(a)
a<-table.element(a,'Variable',header=TRUE)
a<-table.element(a,'Parameter',header=TRUE)
a<-table.element(a,'S.D.',header=TRUE)
a<-table.element(a,'T-STAT
H0: parameter = 0',header=TRUE)
a<-table.element(a,'2-tail p-value',header=TRUE)
a<-table.element(a,'1-tail p-value',header=TRUE)
a<-table.row.end(a)
for (i in 1:k){
a<-table.row.start(a)
a<-table.element(a,rownames(mysum$coefficients)[i],header=TRUE)
a<-table.element(a,mysum$coefficients[i,1])
a<-table.element(a, round(mysum$coefficients[i,2],6))
a<-table.element(a, round(mysum$coefficients[i,3],4))
a<-table.element(a, round(mysum$coefficients[i,4],6))
a<-table.element(a, round(mysum$coefficients[i,4]/2,6))
a<-table.row.end(a)
}
a<-table.end(a)
table.save(a,file='mytable2.tab')
a<-table.start()
a<-table.row.start(a)
a<-table.element(a, 'Multiple Linear Regression - Regression Statistics', 2, TRUE)
a<-table.row.end(a)
a<-table.row.start(a)
a<-table.element(a, 'Multiple R',1,TRUE)
a<-table.element(a, sqrt(mysum$r.squared))
a<-table.row.end(a)
a<-table.row.start(a)
a<-table.element(a, 'R-squared',1,TRUE)
a<-table.element(a, mysum$r.squared)
a<-table.row.end(a)
a<-table.row.start(a)
a<-table.element(a, 'Adjusted R-squared',1,TRUE)
a<-table.element(a, mysum$adj.r.squared)
a<-table.row.end(a)
a<-table.row.start(a)
a<-table.element(a, 'F-TEST (value)',1,TRUE)
a<-table.element(a, mysum$fstatistic[1])
a<-table.row.end(a)
a<-table.row.start(a)
a<-table.element(a, 'F-TEST (DF numerator)',1,TRUE)
a<-table.element(a, mysum$fstatistic[2])
a<-table.row.end(a)
a<-table.row.start(a)
a<-table.element(a, 'F-TEST (DF denominator)',1,TRUE)
a<-table.element(a, mysum$fstatistic[3])
a<-table.row.end(a)
a<-table.row.start(a)
a<-table.element(a, 'p-value',1,TRUE)
a<-table.element(a, 1-pf(mysum$fstatistic[1],mysum$fstatistic[2],mysum$fstatistic[3]))
a<-table.row.end(a)
a<-table.row.start(a)
a<-table.element(a, 'Multiple Linear Regression - Residual Statistics', 2, TRUE)
a<-table.row.end(a)
a<-table.row.start(a)
a<-table.element(a, 'Residual Standard Deviation',1,TRUE)
a<-table.element(a, mysum$sigma)
a<-table.row.end(a)
a<-table.row.start(a)
a<-table.element(a, 'Sum Squared Residuals',1,TRUE)
a<-table.element(a, sum(myerror*myerror))
a<-table.row.end(a)
a<-table.end(a)
table.save(a,file='mytable3.tab')
a<-table.start()
a<-table.row.start(a)
a<-table.element(a, 'Multiple Linear Regression - Actuals, Interpolation, and Residuals', 4, TRUE)
a<-table.row.end(a)
a<-table.row.start(a)
a<-table.element(a, 'Time or Index', 1, TRUE)
a<-table.element(a, 'Actuals', 1, TRUE)
a<-table.element(a, 'Interpolation
Forecast', 1, TRUE)
a<-table.element(a, 'Residuals
Prediction Error', 1, TRUE)
a<-table.row.end(a)
for (i in 1:n) {
a<-table.row.start(a)
a<-table.element(a,i, 1, TRUE)
a<-table.element(a,x[i])
a<-table.element(a,x[i]-mysum$resid[i])
a<-table.element(a,mysum$resid[i])
a<-table.row.end(a)
}
a<-table.end(a)
table.save(a,file='mytable4.tab')
if (n > n25) {
a<-table.start()
a<-table.row.start(a)
a<-table.element(a,'Goldfeld-Quandt test for Heteroskedasticity',4,TRUE)
a<-table.row.end(a)
a<-table.row.start(a)
a<-table.element(a,'p-values',header=TRUE)
a<-table.element(a,'Alternative Hypothesis',3,header=TRUE)
a<-table.row.end(a)
a<-table.row.start(a)
a<-table.element(a,'breakpoint index',header=TRUE)
a<-table.element(a,'greater',header=TRUE)
a<-table.element(a,'2-sided',header=TRUE)
a<-table.element(a,'less',header=TRUE)
a<-table.row.end(a)
for (mypoint in kp3:nmkm3) {
a<-table.row.start(a)
a<-table.element(a,mypoint,header=TRUE)
a<-table.element(a,gqarr[mypoint-kp3+1,1])
a<-table.element(a,gqarr[mypoint-kp3+1,2])
a<-table.element(a,gqarr[mypoint-kp3+1,3])
a<-table.row.end(a)
}
a<-table.end(a)
table.save(a,file='mytable5.tab')
a<-table.start()
a<-table.row.start(a)
a<-table.element(a,'Meta Analysis of Goldfeld-Quandt test for Heteroskedasticity',4,TRUE)
a<-table.row.end(a)
a<-table.row.start(a)
a<-table.element(a,'Description',header=TRUE)
a<-table.element(a,'# significant tests',header=TRUE)
a<-table.element(a,'% significant tests',header=TRUE)
a<-table.element(a,'OK/NOK',header=TRUE)
a<-table.row.end(a)
a<-table.row.start(a)
a<-table.element(a,'1% type I error level',header=TRUE)
a<-table.element(a,numsignificant1)
a<-table.element(a,numsignificant1/numgqtests)
if (numsignificant1/numgqtests < 0.01) dum <- 'OK' else dum <- 'NOK'
a<-table.element(a,dum)
a<-table.row.end(a)
a<-table.row.start(a)
a<-table.element(a,'5% type I error level',header=TRUE)
a<-table.element(a,numsignificant5)
a<-table.element(a,numsignificant5/numgqtests)
if (numsignificant5/numgqtests < 0.05) dum <- 'OK' else dum <- 'NOK'
a<-table.element(a,dum)
a<-table.row.end(a)
a<-table.row.start(a)
a<-table.element(a,'10% type I error level',header=TRUE)
a<-table.element(a,numsignificant10)
a<-table.element(a,numsignificant10/numgqtests)
if (numsignificant10/numgqtests < 0.1) dum <- 'OK' else dum <- 'NOK'
a<-table.element(a,dum)
a<-table.row.end(a)
a<-table.end(a)
table.save(a,file='mytable6.tab')
}