Free Statistics

of Irreproducible Research!

Author's title

Author*The author of this computation has been verified*
R Software Modulerwasp_multipleregression.wasp
Title produced by softwareMultiple Regression
Date of computationSun, 13 Dec 2009 06:53:10 -0700
Cite this page as followsStatistical Computations at FreeStatistics.org, Office for Research Development and Education, URL https://freestatistics.org/blog/index.php?v=date/2009/Dec/13/t1260712643ibc2hmbizrr4h3c.htm/, Retrieved Sun, 28 Apr 2024 15:03:28 +0000
Statistical Computations at FreeStatistics.org, Office for Research Development and Education, URL https://freestatistics.org/blog/index.php?pk=67285, Retrieved Sun, 28 Apr 2024 15:03:28 +0000
QR Codes:

Original text written by user:
IsPrivate?No (this computation is public)
User-defined keywords
Estimated Impact147
Family? (F = Feedback message, R = changed R code, M = changed R Module, P = changed Parameters, D = changed Data)
-     [Multiple Regression] [] [2009-11-23 13:58:38] [1eac2882020791f6c49a90a91c34285a]
- R PD    [Multiple Regression] [] [2009-12-13 13:53:10] [21503129a47c64de7f80e1fde84c3a45] [Current]
Feedback Forum

Post a new message
Dataseries X:
99.9	98.8
98.6	100.5
107.2	110.4
95.7	96.4
93.7	101.9
106.7	106.2
86.7	81
95.3	94.7
99.3	101
101.8	109.4
96	102.3
91.7	90.7
95.3	96.2
96.6	96.1
107.2	106
108	103.1
98.4	102
103.1	104.7
81.1	86
96.6	92.1
103.7	106.9
106.6	112.6
97.6	101.7
87.6	92
99.4	97.4
98.5	97
105.2	105.4
104.6	102.7
97.5	98.1
108.9	104.5
86.8	87.4
88.9	89.9
110.3	109.8
114.8	111.7
94.6	98.6
92	96.9
93.8	95.1
93.8	97
107.6	112.7
101	102.9
95.4	97.4
96.5	111.4
89.2	87.4
87.1	96.8
110.5	114.1
110.8	110.3
104.2	103.9
88.9	101.6
89.8	94.6
90	95.9
93.9	104.7
91.3	102.8
87.8	98.1
99.7	113.9
73.5	80.9
79.2	95.7
96.9	113.2
95.2	105.9
95.6	108.8
89.7	102.3


Summary of computational transaction
Raw Inputview raw input (R code)
Raw Outputview raw output of R engine
Computing time3 seconds
R Server'Gwilym Jenkins' @ 72.249.127.135

\begin{tabular}{lllllllll}
\hline
Summary of computational transaction \tabularnewline
Raw Input & view raw input (R code)  \tabularnewline
Raw Output & view raw output of R engine  \tabularnewline
Computing time & 3 seconds \tabularnewline
R Server & 'Gwilym Jenkins' @ 72.249.127.135 \tabularnewline
\hline
\end{tabular}
%Source: https://freestatistics.org/blog/index.php?pk=67285&T=0

[TABLE]
[ROW][C]Summary of computational transaction[/C][/ROW]
[ROW][C]Raw Input[/C][C]view raw input (R code) [/C][/ROW]
[ROW][C]Raw Output[/C][C]view raw output of R engine [/C][/ROW]
[ROW][C]Computing time[/C][C]3 seconds[/C][/ROW]
[ROW][C]R Server[/C][C]'Gwilym Jenkins' @ 72.249.127.135[/C][/ROW]
[/TABLE]
Source: https://freestatistics.org/blog/index.php?pk=67285&T=0

Globally Unique Identifier (entire table): ba.freestatistics.org/blog/index.php?pk=67285&T=0

As an alternative you can also use a QR Code:  

The GUIDs for individual cells are displayed in the table below:

Summary of computational transaction
Raw Inputview raw input (R code)
Raw Outputview raw output of R engine
Computing time3 seconds
R Server'Gwilym Jenkins' @ 72.249.127.135


Multiple Linear Regression - Estimated Regression Equation
TotProd[t] = + 68.9998726894388 + 0.272276741690668ProdMetal[t] -0.843105051703042M1[t] -0.0138936993450399M2[t] + 8.0629457216336M3[t] + 2.83037297108659M4[t] + 2.17532426340796M5[t] + 8.43384670689379M6[t] -9.94021868678311M7[t] -2.35189545873824M8[t] + 8.71128351209637M9[t] + 9.1395056597435M10[t] + 4.37415861979585M11[t] + 0.088907391478745t + e[t]

\begin{tabular}{lllllllll}
\hline
Multiple Linear Regression - Estimated Regression Equation \tabularnewline
TotProd[t] =  +  68.9998726894388 +  0.272276741690668ProdMetal[t] -0.843105051703042M1[t] -0.0138936993450399M2[t] +  8.0629457216336M3[t] +  2.83037297108659M4[t] +  2.17532426340796M5[t] +  8.43384670689379M6[t] -9.94021868678311M7[t] -2.35189545873824M8[t] +  8.71128351209637M9[t] +  9.1395056597435M10[t] +  4.37415861979585M11[t] +  0.088907391478745t  + e[t] \tabularnewline
\hline
\end{tabular}
%Source: https://freestatistics.org/blog/index.php?pk=67285&T=1

[TABLE]
[ROW][C]Multiple Linear Regression - Estimated Regression Equation[/C][/ROW]
[ROW][C]TotProd[t] =  +  68.9998726894388 +  0.272276741690668ProdMetal[t] -0.843105051703042M1[t] -0.0138936993450399M2[t] +  8.0629457216336M3[t] +  2.83037297108659M4[t] +  2.17532426340796M5[t] +  8.43384670689379M6[t] -9.94021868678311M7[t] -2.35189545873824M8[t] +  8.71128351209637M9[t] +  9.1395056597435M10[t] +  4.37415861979585M11[t] +  0.088907391478745t  + e[t][/C][/ROW]
[/TABLE]
Source: https://freestatistics.org/blog/index.php?pk=67285&T=1

Globally Unique Identifier (entire table): ba.freestatistics.org/blog/index.php?pk=67285&T=1

As an alternative you can also use a QR Code:  

The GUIDs for individual cells are displayed in the table below:

Multiple Linear Regression - Estimated Regression Equation
TotProd[t] = + 68.9998726894388 + 0.272276741690668ProdMetal[t] -0.843105051703042M1[t] -0.0138936993450399M2[t] + 8.0629457216336M3[t] + 2.83037297108659M4[t] + 2.17532426340796M5[t] + 8.43384670689379M6[t] -9.94021868678311M7[t] -2.35189545873824M8[t] + 8.71128351209637M9[t] + 9.1395056597435M10[t] + 4.37415861979585M11[t] + 0.088907391478745t + e[t]


Multiple Linear Regression - Ordinary Least Squares
VariableParameterS.D.T-STATH0: parameter = 02-tail p-value1-tail p-value
(Intercept)68.99987268943888.8713947.777800
ProdMetal0.2722767416906680.0922052.9530.0049440.002472
M1-0.8431050517030422.033966-0.41450.6804250.340213
M2-0.01389369934503992.030811-0.00680.9945710.497285
M38.06294572163362.3276753.46390.0011630.000581
M42.830372971086592.1582271.31140.196220.09811
M52.175324263407962.0143481.07990.285810.142905
M68.433846706893792.2820243.69580.0005820.000291
M7-9.940218686783112.088901-4.75862e-051e-05
M8-2.351895458738241.983136-1.18590.2417330.120866
M98.711283512096372.3522843.70330.0005690.000284
M109.13950565974352.4468043.73530.0005160.000258
M114.374158619795852.0956972.08720.0424380.021219
t0.0889073914787450.0265253.35180.0016130.000806

\begin{tabular}{lllllllll}
\hline
Multiple Linear Regression - Ordinary Least Squares \tabularnewline
Variable & Parameter & S.D. & T-STATH0: parameter = 0 & 2-tail p-value & 1-tail p-value \tabularnewline
(Intercept) & 68.9998726894388 & 8.871394 & 7.7778 & 0 & 0 \tabularnewline
ProdMetal & 0.272276741690668 & 0.092205 & 2.953 & 0.004944 & 0.002472 \tabularnewline
M1 & -0.843105051703042 & 2.033966 & -0.4145 & 0.680425 & 0.340213 \tabularnewline
M2 & -0.0138936993450399 & 2.030811 & -0.0068 & 0.994571 & 0.497285 \tabularnewline
M3 & 8.0629457216336 & 2.327675 & 3.4639 & 0.001163 & 0.000581 \tabularnewline
M4 & 2.83037297108659 & 2.158227 & 1.3114 & 0.19622 & 0.09811 \tabularnewline
M5 & 2.17532426340796 & 2.014348 & 1.0799 & 0.28581 & 0.142905 \tabularnewline
M6 & 8.43384670689379 & 2.282024 & 3.6958 & 0.000582 & 0.000291 \tabularnewline
M7 & -9.94021868678311 & 2.088901 & -4.7586 & 2e-05 & 1e-05 \tabularnewline
M8 & -2.35189545873824 & 1.983136 & -1.1859 & 0.241733 & 0.120866 \tabularnewline
M9 & 8.71128351209637 & 2.352284 & 3.7033 & 0.000569 & 0.000284 \tabularnewline
M10 & 9.1395056597435 & 2.446804 & 3.7353 & 0.000516 & 0.000258 \tabularnewline
M11 & 4.37415861979585 & 2.095697 & 2.0872 & 0.042438 & 0.021219 \tabularnewline
t & 0.088907391478745 & 0.026525 & 3.3518 & 0.001613 & 0.000806 \tabularnewline
\hline
\end{tabular}
%Source: https://freestatistics.org/blog/index.php?pk=67285&T=2

[TABLE]
[ROW][C]Multiple Linear Regression - Ordinary Least Squares[/C][/ROW]
[ROW][C]Variable[/C][C]Parameter[/C][C]S.D.[/C][C]T-STATH0: parameter = 0[/C][C]2-tail p-value[/C][C]1-tail p-value[/C][/ROW]
[ROW][C](Intercept)[/C][C]68.9998726894388[/C][C]8.871394[/C][C]7.7778[/C][C]0[/C][C]0[/C][/ROW]
[ROW][C]ProdMetal[/C][C]0.272276741690668[/C][C]0.092205[/C][C]2.953[/C][C]0.004944[/C][C]0.002472[/C][/ROW]
[ROW][C]M1[/C][C]-0.843105051703042[/C][C]2.033966[/C][C]-0.4145[/C][C]0.680425[/C][C]0.340213[/C][/ROW]
[ROW][C]M2[/C][C]-0.0138936993450399[/C][C]2.030811[/C][C]-0.0068[/C][C]0.994571[/C][C]0.497285[/C][/ROW]
[ROW][C]M3[/C][C]8.0629457216336[/C][C]2.327675[/C][C]3.4639[/C][C]0.001163[/C][C]0.000581[/C][/ROW]
[ROW][C]M4[/C][C]2.83037297108659[/C][C]2.158227[/C][C]1.3114[/C][C]0.19622[/C][C]0.09811[/C][/ROW]
[ROW][C]M5[/C][C]2.17532426340796[/C][C]2.014348[/C][C]1.0799[/C][C]0.28581[/C][C]0.142905[/C][/ROW]
[ROW][C]M6[/C][C]8.43384670689379[/C][C]2.282024[/C][C]3.6958[/C][C]0.000582[/C][C]0.000291[/C][/ROW]
[ROW][C]M7[/C][C]-9.94021868678311[/C][C]2.088901[/C][C]-4.7586[/C][C]2e-05[/C][C]1e-05[/C][/ROW]
[ROW][C]M8[/C][C]-2.35189545873824[/C][C]1.983136[/C][C]-1.1859[/C][C]0.241733[/C][C]0.120866[/C][/ROW]
[ROW][C]M9[/C][C]8.71128351209637[/C][C]2.352284[/C][C]3.7033[/C][C]0.000569[/C][C]0.000284[/C][/ROW]
[ROW][C]M10[/C][C]9.1395056597435[/C][C]2.446804[/C][C]3.7353[/C][C]0.000516[/C][C]0.000258[/C][/ROW]
[ROW][C]M11[/C][C]4.37415861979585[/C][C]2.095697[/C][C]2.0872[/C][C]0.042438[/C][C]0.021219[/C][/ROW]
[ROW][C]t[/C][C]0.088907391478745[/C][C]0.026525[/C][C]3.3518[/C][C]0.001613[/C][C]0.000806[/C][/ROW]
[/TABLE]
Source: https://freestatistics.org/blog/index.php?pk=67285&T=2

Globally Unique Identifier (entire table): ba.freestatistics.org/blog/index.php?pk=67285&T=2

As an alternative you can also use a QR Code:  

The GUIDs for individual cells are displayed in the table below:

Multiple Linear Regression - Ordinary Least Squares
VariableParameterS.D.T-STATH0: parameter = 02-tail p-value1-tail p-value
(Intercept)68.99987268943888.8713947.777800
ProdMetal0.2722767416906680.0922052.9530.0049440.002472
M1-0.8431050517030422.033966-0.41450.6804250.340213
M2-0.01389369934503992.030811-0.00680.9945710.497285
M38.06294572163362.3276753.46390.0011630.000581
M42.830372971086592.1582271.31140.196220.09811
M52.175324263407962.0143481.07990.285810.142905
M68.433846706893792.2820243.69580.0005820.000291
M7-9.940218686783112.088901-4.75862e-051e-05
M8-2.351895458738241.983136-1.18590.2417330.120866
M98.711283512096372.3522843.70330.0005690.000284
M109.13950565974352.4468043.73530.0005160.000258
M114.374158619795852.0956972.08720.0424380.021219
t0.0889073914787450.0265253.35180.0016130.000806


Multiple Linear Regression - Regression Statistics
Multiple R0.937242633290538
R-squared0.878423753657381
Adjusted R-squared0.844065249256206
F-TEST (value)25.5664141663670
F-TEST (DF numerator)13
F-TEST (DF denominator)46
p-value1.11022302462516e-16
Multiple Linear Regression - Residual Statistics
Residual Standard Deviation3.12812386152141
Sum Squared Residuals450.117309078901

\begin{tabular}{lllllllll}
\hline
Multiple Linear Regression - Regression Statistics \tabularnewline
Multiple R & 0.937242633290538 \tabularnewline
R-squared & 0.878423753657381 \tabularnewline
Adjusted R-squared & 0.844065249256206 \tabularnewline
F-TEST (value) & 25.5664141663670 \tabularnewline
F-TEST (DF numerator) & 13 \tabularnewline
F-TEST (DF denominator) & 46 \tabularnewline
p-value & 1.11022302462516e-16 \tabularnewline
Multiple Linear Regression - Residual Statistics \tabularnewline
Residual Standard Deviation & 3.12812386152141 \tabularnewline
Sum Squared Residuals & 450.117309078901 \tabularnewline
\hline
\end{tabular}
%Source: https://freestatistics.org/blog/index.php?pk=67285&T=3

[TABLE]
[ROW][C]Multiple Linear Regression - Regression Statistics[/C][/ROW]
[ROW][C]Multiple R[/C][C]0.937242633290538[/C][/ROW]
[ROW][C]R-squared[/C][C]0.878423753657381[/C][/ROW]
[ROW][C]Adjusted R-squared[/C][C]0.844065249256206[/C][/ROW]
[ROW][C]F-TEST (value)[/C][C]25.5664141663670[/C][/ROW]
[ROW][C]F-TEST (DF numerator)[/C][C]13[/C][/ROW]
[ROW][C]F-TEST (DF denominator)[/C][C]46[/C][/ROW]
[ROW][C]p-value[/C][C]1.11022302462516e-16[/C][/ROW]
[ROW][C]Multiple Linear Regression - Residual Statistics[/C][/ROW]
[ROW][C]Residual Standard Deviation[/C][C]3.12812386152141[/C][/ROW]
[ROW][C]Sum Squared Residuals[/C][C]450.117309078901[/C][/ROW]
[/TABLE]
Source: https://freestatistics.org/blog/index.php?pk=67285&T=3

Globally Unique Identifier (entire table): ba.freestatistics.org/blog/index.php?pk=67285&T=3

As an alternative you can also use a QR Code:  

The GUIDs for individual cells are displayed in the table below:

Multiple Linear Regression - Regression Statistics
Multiple R0.937242633290538
R-squared0.878423753657381
Adjusted R-squared0.844065249256206
F-TEST (value)25.5664141663670
F-TEST (DF numerator)13
F-TEST (DF denominator)46
p-value1.11022302462516e-16
Multiple Linear Regression - Residual Statistics
Residual Standard Deviation3.12812386152141
Sum Squared Residuals450.117309078901


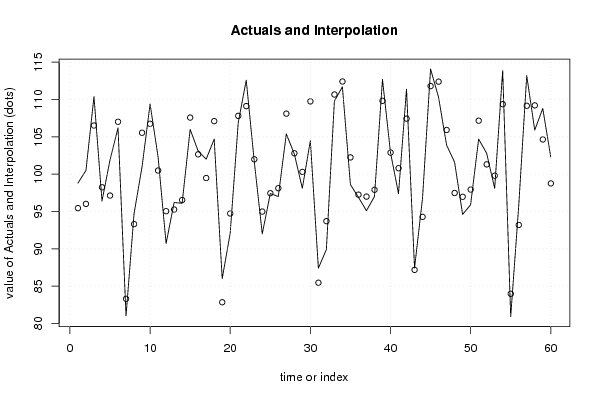
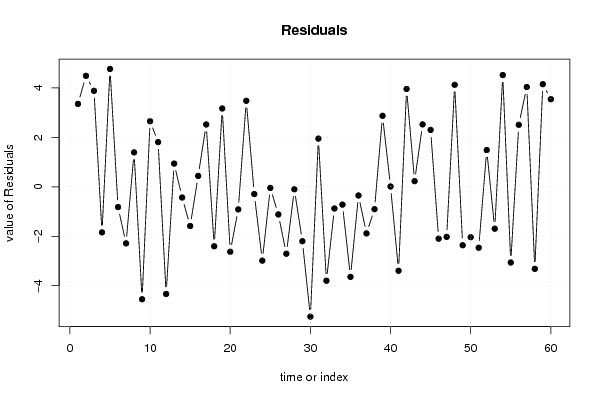
Multiple Linear Regression - Actuals, Interpolation, and Residuals
Time or IndexActualsInterpolationForecastResidualsPrediction Error
198.895.44612152411263.35387847588742
2100.596.01028050375124.4897194962488
3110.4106.5176072947483.88239270525169
496.498.2427594062374-1.84275940623736
5101.997.13206460665614.76793539334386
6106.2107.019092083599-0.81909208359941
78183.2883992475879-2.28839924758789
894.793.30720984565121.39279015434875
9101105.548403174727-4.54840317472728
10109.4106.7462245680802.65377543192018
11102.3100.4905798178051.80942018219495
1290.795.034538600218-4.33453860021807
1396.295.26053721008020.93946278991982
1496.196.5326157181148-0.432615718114795
15106107.584495992493-1.58449599249326
16103.1102.6586520267780.441347973222465
1710299.47865399034722.52134600965277
18104.7107.105784511258-2.40578451125794
198682.83053819186513.16946180813492
2092.194.728058307594-2.62805830759406
21106.9107.813309535911-0.913309535911158
22112.6109.120041625943.47995837406003
23101.7101.993111302255-0.293111302255055
249294.9850926570313-2.98509265703126
2597.497.4437605487569-0.0437605487568535
269798.116830225072-1.11683022507200
27105.4108.106831206857-2.70683120685685
28102.7102.799799802774-0.0997998027741924
2998.1100.300493620571-2.20049362057057
30104.5109.751878310809-5.25187831080876
3187.485.44940431724681.95059568275317
3289.993.6984160943208-3.79841609432085
33109.8110.677224728815-0.87722472881452
34111.7112.419599605548-0.719599605548383
3598.6102.243169774928-3.643169774928
3696.997.2499990182151-0.349999018215143
3795.196.985899493034-1.88589949303406
389797.9040182368708-0.904018236870802
39112.7109.8271840846592.8728159153406
40102.9102.8864922304330.0135077695672743
4197.4100.795601160765-3.39560116076510
42111.4107.4425354115893.9574645884106
4387.487.16975719504940.230242804950623
4496.894.27520665702262.52479334297741
45114.1111.7985687748982.3014312251024
46110.3112.397381336531-2.09738133653066
47103.9105.923915192903-2.02391519290335
48101.697.4728298167194.12717018328098
4994.696.9636812240163-2.36368122401633
5095.997.9362553161912-2.0362553161912
51104.7107.163881421242-2.46388142124219
52102.8101.3122965337781.48770346622181
5398.199.793186621661-1.69318662166097
54113.9109.3807096827444.51929031725551
5580.983.9619010482508-3.06190104825082
5695.793.19110909541122.50889090458875
57113.2109.1624937856494.03750621435056
58105.9109.216752863901-3.31675286390117
59108.8104.6492239121094.15077608789145
60102.398.75753990781653.5424600921835

\begin{tabular}{lllllllll}
\hline
Multiple Linear Regression - Actuals, Interpolation, and Residuals \tabularnewline
Time or Index & Actuals & InterpolationForecast & ResidualsPrediction Error \tabularnewline
1 & 98.8 & 95.4461215241126 & 3.35387847588742 \tabularnewline
2 & 100.5 & 96.0102805037512 & 4.4897194962488 \tabularnewline
3 & 110.4 & 106.517607294748 & 3.88239270525169 \tabularnewline
4 & 96.4 & 98.2427594062374 & -1.84275940623736 \tabularnewline
5 & 101.9 & 97.1320646066561 & 4.76793539334386 \tabularnewline
6 & 106.2 & 107.019092083599 & -0.81909208359941 \tabularnewline
7 & 81 & 83.2883992475879 & -2.28839924758789 \tabularnewline
8 & 94.7 & 93.3072098456512 & 1.39279015434875 \tabularnewline
9 & 101 & 105.548403174727 & -4.54840317472728 \tabularnewline
10 & 109.4 & 106.746224568080 & 2.65377543192018 \tabularnewline
11 & 102.3 & 100.490579817805 & 1.80942018219495 \tabularnewline
12 & 90.7 & 95.034538600218 & -4.33453860021807 \tabularnewline
13 & 96.2 & 95.2605372100802 & 0.93946278991982 \tabularnewline
14 & 96.1 & 96.5326157181148 & -0.432615718114795 \tabularnewline
15 & 106 & 107.584495992493 & -1.58449599249326 \tabularnewline
16 & 103.1 & 102.658652026778 & 0.441347973222465 \tabularnewline
17 & 102 & 99.4786539903472 & 2.52134600965277 \tabularnewline
18 & 104.7 & 107.105784511258 & -2.40578451125794 \tabularnewline
19 & 86 & 82.8305381918651 & 3.16946180813492 \tabularnewline
20 & 92.1 & 94.728058307594 & -2.62805830759406 \tabularnewline
21 & 106.9 & 107.813309535911 & -0.913309535911158 \tabularnewline
22 & 112.6 & 109.12004162594 & 3.47995837406003 \tabularnewline
23 & 101.7 & 101.993111302255 & -0.293111302255055 \tabularnewline
24 & 92 & 94.9850926570313 & -2.98509265703126 \tabularnewline
25 & 97.4 & 97.4437605487569 & -0.0437605487568535 \tabularnewline
26 & 97 & 98.116830225072 & -1.11683022507200 \tabularnewline
27 & 105.4 & 108.106831206857 & -2.70683120685685 \tabularnewline
28 & 102.7 & 102.799799802774 & -0.0997998027741924 \tabularnewline
29 & 98.1 & 100.300493620571 & -2.20049362057057 \tabularnewline
30 & 104.5 & 109.751878310809 & -5.25187831080876 \tabularnewline
31 & 87.4 & 85.4494043172468 & 1.95059568275317 \tabularnewline
32 & 89.9 & 93.6984160943208 & -3.79841609432085 \tabularnewline
33 & 109.8 & 110.677224728815 & -0.87722472881452 \tabularnewline
34 & 111.7 & 112.419599605548 & -0.719599605548383 \tabularnewline
35 & 98.6 & 102.243169774928 & -3.643169774928 \tabularnewline
36 & 96.9 & 97.2499990182151 & -0.349999018215143 \tabularnewline
37 & 95.1 & 96.985899493034 & -1.88589949303406 \tabularnewline
38 & 97 & 97.9040182368708 & -0.904018236870802 \tabularnewline
39 & 112.7 & 109.827184084659 & 2.8728159153406 \tabularnewline
40 & 102.9 & 102.886492230433 & 0.0135077695672743 \tabularnewline
41 & 97.4 & 100.795601160765 & -3.39560116076510 \tabularnewline
42 & 111.4 & 107.442535411589 & 3.9574645884106 \tabularnewline
43 & 87.4 & 87.1697571950494 & 0.230242804950623 \tabularnewline
44 & 96.8 & 94.2752066570226 & 2.52479334297741 \tabularnewline
45 & 114.1 & 111.798568774898 & 2.3014312251024 \tabularnewline
46 & 110.3 & 112.397381336531 & -2.09738133653066 \tabularnewline
47 & 103.9 & 105.923915192903 & -2.02391519290335 \tabularnewline
48 & 101.6 & 97.472829816719 & 4.12717018328098 \tabularnewline
49 & 94.6 & 96.9636812240163 & -2.36368122401633 \tabularnewline
50 & 95.9 & 97.9362553161912 & -2.0362553161912 \tabularnewline
51 & 104.7 & 107.163881421242 & -2.46388142124219 \tabularnewline
52 & 102.8 & 101.312296533778 & 1.48770346622181 \tabularnewline
53 & 98.1 & 99.793186621661 & -1.69318662166097 \tabularnewline
54 & 113.9 & 109.380709682744 & 4.51929031725551 \tabularnewline
55 & 80.9 & 83.9619010482508 & -3.06190104825082 \tabularnewline
56 & 95.7 & 93.1911090954112 & 2.50889090458875 \tabularnewline
57 & 113.2 & 109.162493785649 & 4.03750621435056 \tabularnewline
58 & 105.9 & 109.216752863901 & -3.31675286390117 \tabularnewline
59 & 108.8 & 104.649223912109 & 4.15077608789145 \tabularnewline
60 & 102.3 & 98.7575399078165 & 3.5424600921835 \tabularnewline
\hline
\end{tabular}
%Source: https://freestatistics.org/blog/index.php?pk=67285&T=4

[TABLE]
[ROW][C]Multiple Linear Regression - Actuals, Interpolation, and Residuals[/C][/ROW]
[ROW][C]Time or Index[/C][C]Actuals[/C][C]InterpolationForecast[/C][C]ResidualsPrediction Error[/C][/ROW]
[ROW][C]1[/C][C]98.8[/C][C]95.4461215241126[/C][C]3.35387847588742[/C][/ROW]
[ROW][C]2[/C][C]100.5[/C][C]96.0102805037512[/C][C]4.4897194962488[/C][/ROW]
[ROW][C]3[/C][C]110.4[/C][C]106.517607294748[/C][C]3.88239270525169[/C][/ROW]
[ROW][C]4[/C][C]96.4[/C][C]98.2427594062374[/C][C]-1.84275940623736[/C][/ROW]
[ROW][C]5[/C][C]101.9[/C][C]97.1320646066561[/C][C]4.76793539334386[/C][/ROW]
[ROW][C]6[/C][C]106.2[/C][C]107.019092083599[/C][C]-0.81909208359941[/C][/ROW]
[ROW][C]7[/C][C]81[/C][C]83.2883992475879[/C][C]-2.28839924758789[/C][/ROW]
[ROW][C]8[/C][C]94.7[/C][C]93.3072098456512[/C][C]1.39279015434875[/C][/ROW]
[ROW][C]9[/C][C]101[/C][C]105.548403174727[/C][C]-4.54840317472728[/C][/ROW]
[ROW][C]10[/C][C]109.4[/C][C]106.746224568080[/C][C]2.65377543192018[/C][/ROW]
[ROW][C]11[/C][C]102.3[/C][C]100.490579817805[/C][C]1.80942018219495[/C][/ROW]
[ROW][C]12[/C][C]90.7[/C][C]95.034538600218[/C][C]-4.33453860021807[/C][/ROW]
[ROW][C]13[/C][C]96.2[/C][C]95.2605372100802[/C][C]0.93946278991982[/C][/ROW]
[ROW][C]14[/C][C]96.1[/C][C]96.5326157181148[/C][C]-0.432615718114795[/C][/ROW]
[ROW][C]15[/C][C]106[/C][C]107.584495992493[/C][C]-1.58449599249326[/C][/ROW]
[ROW][C]16[/C][C]103.1[/C][C]102.658652026778[/C][C]0.441347973222465[/C][/ROW]
[ROW][C]17[/C][C]102[/C][C]99.4786539903472[/C][C]2.52134600965277[/C][/ROW]
[ROW][C]18[/C][C]104.7[/C][C]107.105784511258[/C][C]-2.40578451125794[/C][/ROW]
[ROW][C]19[/C][C]86[/C][C]82.8305381918651[/C][C]3.16946180813492[/C][/ROW]
[ROW][C]20[/C][C]92.1[/C][C]94.728058307594[/C][C]-2.62805830759406[/C][/ROW]
[ROW][C]21[/C][C]106.9[/C][C]107.813309535911[/C][C]-0.913309535911158[/C][/ROW]
[ROW][C]22[/C][C]112.6[/C][C]109.12004162594[/C][C]3.47995837406003[/C][/ROW]
[ROW][C]23[/C][C]101.7[/C][C]101.993111302255[/C][C]-0.293111302255055[/C][/ROW]
[ROW][C]24[/C][C]92[/C][C]94.9850926570313[/C][C]-2.98509265703126[/C][/ROW]
[ROW][C]25[/C][C]97.4[/C][C]97.4437605487569[/C][C]-0.0437605487568535[/C][/ROW]
[ROW][C]26[/C][C]97[/C][C]98.116830225072[/C][C]-1.11683022507200[/C][/ROW]
[ROW][C]27[/C][C]105.4[/C][C]108.106831206857[/C][C]-2.70683120685685[/C][/ROW]
[ROW][C]28[/C][C]102.7[/C][C]102.799799802774[/C][C]-0.0997998027741924[/C][/ROW]
[ROW][C]29[/C][C]98.1[/C][C]100.300493620571[/C][C]-2.20049362057057[/C][/ROW]
[ROW][C]30[/C][C]104.5[/C][C]109.751878310809[/C][C]-5.25187831080876[/C][/ROW]
[ROW][C]31[/C][C]87.4[/C][C]85.4494043172468[/C][C]1.95059568275317[/C][/ROW]
[ROW][C]32[/C][C]89.9[/C][C]93.6984160943208[/C][C]-3.79841609432085[/C][/ROW]
[ROW][C]33[/C][C]109.8[/C][C]110.677224728815[/C][C]-0.87722472881452[/C][/ROW]
[ROW][C]34[/C][C]111.7[/C][C]112.419599605548[/C][C]-0.719599605548383[/C][/ROW]
[ROW][C]35[/C][C]98.6[/C][C]102.243169774928[/C][C]-3.643169774928[/C][/ROW]
[ROW][C]36[/C][C]96.9[/C][C]97.2499990182151[/C][C]-0.349999018215143[/C][/ROW]
[ROW][C]37[/C][C]95.1[/C][C]96.985899493034[/C][C]-1.88589949303406[/C][/ROW]
[ROW][C]38[/C][C]97[/C][C]97.9040182368708[/C][C]-0.904018236870802[/C][/ROW]
[ROW][C]39[/C][C]112.7[/C][C]109.827184084659[/C][C]2.8728159153406[/C][/ROW]
[ROW][C]40[/C][C]102.9[/C][C]102.886492230433[/C][C]0.0135077695672743[/C][/ROW]
[ROW][C]41[/C][C]97.4[/C][C]100.795601160765[/C][C]-3.39560116076510[/C][/ROW]
[ROW][C]42[/C][C]111.4[/C][C]107.442535411589[/C][C]3.9574645884106[/C][/ROW]
[ROW][C]43[/C][C]87.4[/C][C]87.1697571950494[/C][C]0.230242804950623[/C][/ROW]
[ROW][C]44[/C][C]96.8[/C][C]94.2752066570226[/C][C]2.52479334297741[/C][/ROW]
[ROW][C]45[/C][C]114.1[/C][C]111.798568774898[/C][C]2.3014312251024[/C][/ROW]
[ROW][C]46[/C][C]110.3[/C][C]112.397381336531[/C][C]-2.09738133653066[/C][/ROW]
[ROW][C]47[/C][C]103.9[/C][C]105.923915192903[/C][C]-2.02391519290335[/C][/ROW]
[ROW][C]48[/C][C]101.6[/C][C]97.472829816719[/C][C]4.12717018328098[/C][/ROW]
[ROW][C]49[/C][C]94.6[/C][C]96.9636812240163[/C][C]-2.36368122401633[/C][/ROW]
[ROW][C]50[/C][C]95.9[/C][C]97.9362553161912[/C][C]-2.0362553161912[/C][/ROW]
[ROW][C]51[/C][C]104.7[/C][C]107.163881421242[/C][C]-2.46388142124219[/C][/ROW]
[ROW][C]52[/C][C]102.8[/C][C]101.312296533778[/C][C]1.48770346622181[/C][/ROW]
[ROW][C]53[/C][C]98.1[/C][C]99.793186621661[/C][C]-1.69318662166097[/C][/ROW]
[ROW][C]54[/C][C]113.9[/C][C]109.380709682744[/C][C]4.51929031725551[/C][/ROW]
[ROW][C]55[/C][C]80.9[/C][C]83.9619010482508[/C][C]-3.06190104825082[/C][/ROW]
[ROW][C]56[/C][C]95.7[/C][C]93.1911090954112[/C][C]2.50889090458875[/C][/ROW]
[ROW][C]57[/C][C]113.2[/C][C]109.162493785649[/C][C]4.03750621435056[/C][/ROW]
[ROW][C]58[/C][C]105.9[/C][C]109.216752863901[/C][C]-3.31675286390117[/C][/ROW]
[ROW][C]59[/C][C]108.8[/C][C]104.649223912109[/C][C]4.15077608789145[/C][/ROW]
[ROW][C]60[/C][C]102.3[/C][C]98.7575399078165[/C][C]3.5424600921835[/C][/ROW]
[/TABLE]
Source: https://freestatistics.org/blog/index.php?pk=67285&T=4

Globally Unique Identifier (entire table): ba.freestatistics.org/blog/index.php?pk=67285&T=4

As an alternative you can also use a QR Code:  

The GUIDs for individual cells are displayed in the table below:

Multiple Linear Regression - Actuals, Interpolation, and Residuals
Time or IndexActualsInterpolationForecastResidualsPrediction Error
198.895.44612152411263.35387847588742
2100.596.01028050375124.4897194962488
3110.4106.5176072947483.88239270525169
496.498.2427594062374-1.84275940623736
5101.997.13206460665614.76793539334386
6106.2107.019092083599-0.81909208359941
78183.2883992475879-2.28839924758789
894.793.30720984565121.39279015434875
9101105.548403174727-4.54840317472728
10109.4106.7462245680802.65377543192018
11102.3100.4905798178051.80942018219495
1290.795.034538600218-4.33453860021807
1396.295.26053721008020.93946278991982
1496.196.5326157181148-0.432615718114795
15106107.584495992493-1.58449599249326
16103.1102.6586520267780.441347973222465
1710299.47865399034722.52134600965277
18104.7107.105784511258-2.40578451125794
198682.83053819186513.16946180813492
2092.194.728058307594-2.62805830759406
21106.9107.813309535911-0.913309535911158
22112.6109.120041625943.47995837406003
23101.7101.993111302255-0.293111302255055
249294.9850926570313-2.98509265703126
2597.497.4437605487569-0.0437605487568535
269798.116830225072-1.11683022507200
27105.4108.106831206857-2.70683120685685
28102.7102.799799802774-0.0997998027741924
2998.1100.300493620571-2.20049362057057
30104.5109.751878310809-5.25187831080876
3187.485.44940431724681.95059568275317
3289.993.6984160943208-3.79841609432085
33109.8110.677224728815-0.87722472881452
34111.7112.419599605548-0.719599605548383
3598.6102.243169774928-3.643169774928
3696.997.2499990182151-0.349999018215143
3795.196.985899493034-1.88589949303406
389797.9040182368708-0.904018236870802
39112.7109.8271840846592.8728159153406
40102.9102.8864922304330.0135077695672743
4197.4100.795601160765-3.39560116076510
42111.4107.4425354115893.9574645884106
4387.487.16975719504940.230242804950623
4496.894.27520665702262.52479334297741
45114.1111.7985687748982.3014312251024
46110.3112.397381336531-2.09738133653066
47103.9105.923915192903-2.02391519290335
48101.697.4728298167194.12717018328098
4994.696.9636812240163-2.36368122401633
5095.997.9362553161912-2.0362553161912
51104.7107.163881421242-2.46388142124219
52102.8101.3122965337781.48770346622181
5398.199.793186621661-1.69318662166097
54113.9109.3807096827444.51929031725551
5580.983.9619010482508-3.06190104825082
5695.793.19110909541122.50889090458875
57113.2109.1624937856494.03750621435056
58105.9109.216752863901-3.31675286390117
59108.8104.6492239121094.15077608789145
60102.398.75753990781653.5424600921835


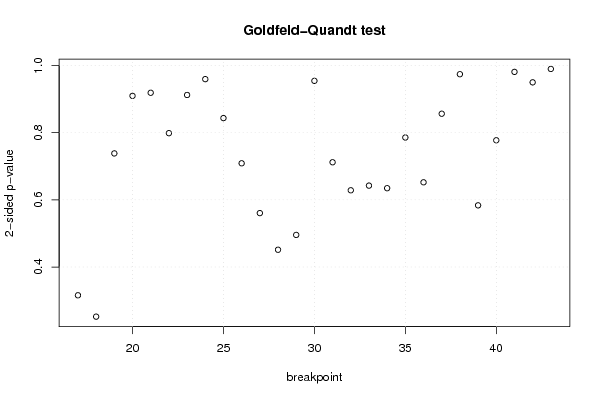
Goldfeld-Quandt test for Heteroskedasticity
p-valuesAlternative Hypothesis
breakpoint indexgreater2-sidedless
170.1579668625561380.3159337251122770.842033137443862
180.1261744607871530.2523489215743070.873825539212847
190.6308979815046230.7382040369907540.369102018495377
200.5452801842789470.9094396314421060.454719815721053
210.5406471475130940.9187057049738110.459352852486906
220.6007877090392010.7984245819215980.399212290960799
230.5439437504331200.912112499133760.45605624956688
240.4796128266930430.9592256533860870.520387173306956
250.4216590045183020.8433180090366030.578340995481698
260.3543926042184040.7087852084368080.645607395781596
270.2802861698541810.5605723397083630.719713830145819
280.2257361453351220.4514722906702440.774263854664878
290.2477925377618540.4955850755237090.752207462238146
300.4770924831652080.9541849663304150.522907516834792
310.6440801740419650.711839651916070.355919825958035
320.6857903496874030.6284193006251930.314209650312597
330.678823800434820.642352399130360.32117619956518
340.6826838547340290.6346322905319420.317316145265971
350.6072250332240680.7855499335518640.392774966775932
360.673893123313390.6522137533732190.326106876686610
370.5718394237250430.8563211525499140.428160576274957
380.4869593384780450.973918676956090.513040661521955
390.708182864671560.583634270656880.29181713532844
400.6113611725580480.7772776548839040.388638827441952
410.5095565463807370.9808869072385250.490443453619263
420.525123945612620.949752108774760.47487605438738
430.5052146812363310.9895706375273380.494785318763669

\begin{tabular}{lllllllll}
\hline
Goldfeld-Quandt test for Heteroskedasticity \tabularnewline
p-values & Alternative Hypothesis \tabularnewline
breakpoint index & greater & 2-sided & less \tabularnewline
17 & 0.157966862556138 & 0.315933725112277 & 0.842033137443862 \tabularnewline
18 & 0.126174460787153 & 0.252348921574307 & 0.873825539212847 \tabularnewline
19 & 0.630897981504623 & 0.738204036990754 & 0.369102018495377 \tabularnewline
20 & 0.545280184278947 & 0.909439631442106 & 0.454719815721053 \tabularnewline
21 & 0.540647147513094 & 0.918705704973811 & 0.459352852486906 \tabularnewline
22 & 0.600787709039201 & 0.798424581921598 & 0.399212290960799 \tabularnewline
23 & 0.543943750433120 & 0.91211249913376 & 0.45605624956688 \tabularnewline
24 & 0.479612826693043 & 0.959225653386087 & 0.520387173306956 \tabularnewline
25 & 0.421659004518302 & 0.843318009036603 & 0.578340995481698 \tabularnewline
26 & 0.354392604218404 & 0.708785208436808 & 0.645607395781596 \tabularnewline
27 & 0.280286169854181 & 0.560572339708363 & 0.719713830145819 \tabularnewline
28 & 0.225736145335122 & 0.451472290670244 & 0.774263854664878 \tabularnewline
29 & 0.247792537761854 & 0.495585075523709 & 0.752207462238146 \tabularnewline
30 & 0.477092483165208 & 0.954184966330415 & 0.522907516834792 \tabularnewline
31 & 0.644080174041965 & 0.71183965191607 & 0.355919825958035 \tabularnewline
32 & 0.685790349687403 & 0.628419300625193 & 0.314209650312597 \tabularnewline
33 & 0.67882380043482 & 0.64235239913036 & 0.32117619956518 \tabularnewline
34 & 0.682683854734029 & 0.634632290531942 & 0.317316145265971 \tabularnewline
35 & 0.607225033224068 & 0.785549933551864 & 0.392774966775932 \tabularnewline
36 & 0.67389312331339 & 0.652213753373219 & 0.326106876686610 \tabularnewline
37 & 0.571839423725043 & 0.856321152549914 & 0.428160576274957 \tabularnewline
38 & 0.486959338478045 & 0.97391867695609 & 0.513040661521955 \tabularnewline
39 & 0.70818286467156 & 0.58363427065688 & 0.29181713532844 \tabularnewline
40 & 0.611361172558048 & 0.777277654883904 & 0.388638827441952 \tabularnewline
41 & 0.509556546380737 & 0.980886907238525 & 0.490443453619263 \tabularnewline
42 & 0.52512394561262 & 0.94975210877476 & 0.47487605438738 \tabularnewline
43 & 0.505214681236331 & 0.989570637527338 & 0.494785318763669 \tabularnewline
\hline
\end{tabular}
%Source: https://freestatistics.org/blog/index.php?pk=67285&T=5

[TABLE]
[ROW][C]Goldfeld-Quandt test for Heteroskedasticity[/C][/ROW]
[ROW][C]p-values[/C][C]Alternative Hypothesis[/C][/ROW]
[ROW][C]breakpoint index[/C][C]greater[/C][C]2-sided[/C][C]less[/C][/ROW]
[ROW][C]17[/C][C]0.157966862556138[/C][C]0.315933725112277[/C][C]0.842033137443862[/C][/ROW]
[ROW][C]18[/C][C]0.126174460787153[/C][C]0.252348921574307[/C][C]0.873825539212847[/C][/ROW]
[ROW][C]19[/C][C]0.630897981504623[/C][C]0.738204036990754[/C][C]0.369102018495377[/C][/ROW]
[ROW][C]20[/C][C]0.545280184278947[/C][C]0.909439631442106[/C][C]0.454719815721053[/C][/ROW]
[ROW][C]21[/C][C]0.540647147513094[/C][C]0.918705704973811[/C][C]0.459352852486906[/C][/ROW]
[ROW][C]22[/C][C]0.600787709039201[/C][C]0.798424581921598[/C][C]0.399212290960799[/C][/ROW]
[ROW][C]23[/C][C]0.543943750433120[/C][C]0.91211249913376[/C][C]0.45605624956688[/C][/ROW]
[ROW][C]24[/C][C]0.479612826693043[/C][C]0.959225653386087[/C][C]0.520387173306956[/C][/ROW]
[ROW][C]25[/C][C]0.421659004518302[/C][C]0.843318009036603[/C][C]0.578340995481698[/C][/ROW]
[ROW][C]26[/C][C]0.354392604218404[/C][C]0.708785208436808[/C][C]0.645607395781596[/C][/ROW]
[ROW][C]27[/C][C]0.280286169854181[/C][C]0.560572339708363[/C][C]0.719713830145819[/C][/ROW]
[ROW][C]28[/C][C]0.225736145335122[/C][C]0.451472290670244[/C][C]0.774263854664878[/C][/ROW]
[ROW][C]29[/C][C]0.247792537761854[/C][C]0.495585075523709[/C][C]0.752207462238146[/C][/ROW]
[ROW][C]30[/C][C]0.477092483165208[/C][C]0.954184966330415[/C][C]0.522907516834792[/C][/ROW]
[ROW][C]31[/C][C]0.644080174041965[/C][C]0.71183965191607[/C][C]0.355919825958035[/C][/ROW]
[ROW][C]32[/C][C]0.685790349687403[/C][C]0.628419300625193[/C][C]0.314209650312597[/C][/ROW]
[ROW][C]33[/C][C]0.67882380043482[/C][C]0.64235239913036[/C][C]0.32117619956518[/C][/ROW]
[ROW][C]34[/C][C]0.682683854734029[/C][C]0.634632290531942[/C][C]0.317316145265971[/C][/ROW]
[ROW][C]35[/C][C]0.607225033224068[/C][C]0.785549933551864[/C][C]0.392774966775932[/C][/ROW]
[ROW][C]36[/C][C]0.67389312331339[/C][C]0.652213753373219[/C][C]0.326106876686610[/C][/ROW]
[ROW][C]37[/C][C]0.571839423725043[/C][C]0.856321152549914[/C][C]0.428160576274957[/C][/ROW]
[ROW][C]38[/C][C]0.486959338478045[/C][C]0.97391867695609[/C][C]0.513040661521955[/C][/ROW]
[ROW][C]39[/C][C]0.70818286467156[/C][C]0.58363427065688[/C][C]0.29181713532844[/C][/ROW]
[ROW][C]40[/C][C]0.611361172558048[/C][C]0.777277654883904[/C][C]0.388638827441952[/C][/ROW]
[ROW][C]41[/C][C]0.509556546380737[/C][C]0.980886907238525[/C][C]0.490443453619263[/C][/ROW]
[ROW][C]42[/C][C]0.52512394561262[/C][C]0.94975210877476[/C][C]0.47487605438738[/C][/ROW]
[ROW][C]43[/C][C]0.505214681236331[/C][C]0.989570637527338[/C][C]0.494785318763669[/C][/ROW]
[/TABLE]
Source: https://freestatistics.org/blog/index.php?pk=67285&T=5

Globally Unique Identifier (entire table): ba.freestatistics.org/blog/index.php?pk=67285&T=5

As an alternative you can also use a QR Code:  

The GUIDs for individual cells are displayed in the table below:

Goldfeld-Quandt test for Heteroskedasticity
p-valuesAlternative Hypothesis
breakpoint indexgreater2-sidedless
170.1579668625561380.3159337251122770.842033137443862
180.1261744607871530.2523489215743070.873825539212847
190.6308979815046230.7382040369907540.369102018495377
200.5452801842789470.9094396314421060.454719815721053
210.5406471475130940.9187057049738110.459352852486906
220.6007877090392010.7984245819215980.399212290960799
230.5439437504331200.912112499133760.45605624956688
240.4796128266930430.9592256533860870.520387173306956
250.4216590045183020.8433180090366030.578340995481698
260.3543926042184040.7087852084368080.645607395781596
270.2802861698541810.5605723397083630.719713830145819
280.2257361453351220.4514722906702440.774263854664878
290.2477925377618540.4955850755237090.752207462238146
300.4770924831652080.9541849663304150.522907516834792
310.6440801740419650.711839651916070.355919825958035
320.6857903496874030.6284193006251930.314209650312597
330.678823800434820.642352399130360.32117619956518
340.6826838547340290.6346322905319420.317316145265971
350.6072250332240680.7855499335518640.392774966775932
360.673893123313390.6522137533732190.326106876686610
370.5718394237250430.8563211525499140.428160576274957
380.4869593384780450.973918676956090.513040661521955
390.708182864671560.583634270656880.29181713532844
400.6113611725580480.7772776548839040.388638827441952
410.5095565463807370.9808869072385250.490443453619263
420.525123945612620.949752108774760.47487605438738
430.5052146812363310.9895706375273380.494785318763669


Meta Analysis of Goldfeld-Quandt test for Heteroskedasticity
Description# significant tests% significant testsOK/NOK
1% type I error level00OK
5% type I error level00OK
10% type I error level00OK

\begin{tabular}{lllllllll}
\hline
Meta Analysis of Goldfeld-Quandt test for Heteroskedasticity \tabularnewline
Description & # significant tests & % significant tests & OK/NOK \tabularnewline
1% type I error level & 0 & 0 & OK \tabularnewline
5% type I error level & 0 & 0 & OK \tabularnewline
10% type I error level & 0 & 0 & OK \tabularnewline
\hline
\end{tabular}
%Source: https://freestatistics.org/blog/index.php?pk=67285&T=6

[TABLE]
[ROW][C]Meta Analysis of Goldfeld-Quandt test for Heteroskedasticity[/C][/ROW]
[ROW][C]Description[/C][C]# significant tests[/C][C]% significant tests[/C][C]OK/NOK[/C][/ROW]
[ROW][C]1% type I error level[/C][C]0[/C][C]0[/C][C]OK[/C][/ROW]
[ROW][C]5% type I error level[/C][C]0[/C][C]0[/C][C]OK[/C][/ROW]
[ROW][C]10% type I error level[/C][C]0[/C][C]0[/C][C]OK[/C][/ROW]
[/TABLE]
Source: https://freestatistics.org/blog/index.php?pk=67285&T=6

Globally Unique Identifier (entire table): ba.freestatistics.org/blog/index.php?pk=67285&T=6

As an alternative you can also use a QR Code:  

The GUIDs for individual cells are displayed in the table below:

Meta Analysis of Goldfeld-Quandt test for Heteroskedasticity
Description# significant tests% significant testsOK/NOK
1% type I error level00OK
5% type I error level00OK
10% type I error level00OK


Parameters (Session):
par1 = 2 ; par2 = Include Monthly Dummies ; par3 = Linear Trend ;
Parameters (R input):
par1 = 2 ; par2 = Include Monthly Dummies ; par3 = Linear Trend ;
R code (references can be found in the software module):
library(lattice)
library(lmtest)
n25 <- 25 #minimum number of obs. for Goldfeld-Quandt test
par1 <- as.numeric(par1)
x <- t(y)
k <- length(x[1,])
n <- length(x[,1])
x1 <- cbind(x[,par1], x[,1:k!=par1])
mycolnames <- c(colnames(x)[par1], colnames(x)[1:k!=par1])
colnames(x1) <- mycolnames #colnames(x)[par1]
x <- x1
if (par3 == 'First Differences'){
x2 <- array(0, dim=c(n-1,k), dimnames=list(1:(n-1), paste('(1-B)',colnames(x),sep='')))
for (i in 1:n-1) {
for (j in 1:k) {
x2[i,j] <- x[i+1,j] - x[i,j]
}
}
x <- x2
}
if (par2 == 'Include Monthly Dummies'){
x2 <- array(0, dim=c(n,11), dimnames=list(1:n, paste('M', seq(1:11), sep ='')))
for (i in 1:11){
x2[seq(i,n,12),i] <- 1
}
x <- cbind(x, x2)
}
if (par2 == 'Include Quarterly Dummies'){
x2 <- array(0, dim=c(n,3), dimnames=list(1:n, paste('Q', seq(1:3), sep ='')))
for (i in 1:3){
x2[seq(i,n,4),i] <- 1
}
x <- cbind(x, x2)
}
k <- length(x[1,])
if (par3 == 'Linear Trend'){
x <- cbind(x, c(1:n))
colnames(x)[k+1] <- 't'
}
x
k <- length(x[1,])
df <- as.data.frame(x)
(mylm <- lm(df))
(mysum <- summary(mylm))
if (n > n25) {
kp3 <- k + 3
nmkm3 <- n - k - 3
gqarr <- array(NA, dim=c(nmkm3-kp3+1,3))
numgqtests <- 0
numsignificant1 <- 0
numsignificant5 <- 0
numsignificant10 <- 0
for (mypoint in kp3:nmkm3) {
j <- 0
numgqtests <- numgqtests + 1
for (myalt in c('greater', 'two.sided', 'less')) {
j <- j + 1
gqarr[mypoint-kp3+1,j] <- gqtest(mylm, point=mypoint, alternative=myalt)$p.value
}
if (gqarr[mypoint-kp3+1,2] < 0.01) numsignificant1 <- numsignificant1 + 1
if (gqarr[mypoint-kp3+1,2] < 0.05) numsignificant5 <- numsignificant5 + 1
if (gqarr[mypoint-kp3+1,2] < 0.10) numsignificant10 <- numsignificant10 + 1
}
gqarr
}
bitmap(file='test0.png')
plot(x[,1], type='l', main='Actuals and Interpolation', ylab='value of Actuals and Interpolation (dots)', xlab='time or index')
points(x[,1]-mysum$resid)
grid()
dev.off()
bitmap(file='test1.png')
plot(mysum$resid, type='b', pch=19, main='Residuals', ylab='value of Residuals', xlab='time or index')
grid()
dev.off()
bitmap(file='test2.png')
hist(mysum$resid, main='Residual Histogram', xlab='values of Residuals')
grid()
dev.off()
bitmap(file='test3.png')
densityplot(~mysum$resid,col='black',main='Residual Density Plot', xlab='values of Residuals')
dev.off()
bitmap(file='test4.png')
qqnorm(mysum$resid, main='Residual Normal Q-Q Plot')
qqline(mysum$resid)
grid()
dev.off()
(myerror <- as.ts(mysum$resid))
bitmap(file='test5.png')
dum <- cbind(lag(myerror,k=1),myerror)
dum
dum1 <- dum[2:length(myerror),]
dum1
z <- as.data.frame(dum1)
z
plot(z,main=paste('Residual Lag plot, lowess, and regression line'), ylab='values of Residuals', xlab='lagged values of Residuals')
lines(lowess(z))
abline(lm(z))
grid()
dev.off()
bitmap(file='test6.png')
acf(mysum$resid, lag.max=length(mysum$resid)/2, main='Residual Autocorrelation Function')
grid()
dev.off()
bitmap(file='test7.png')
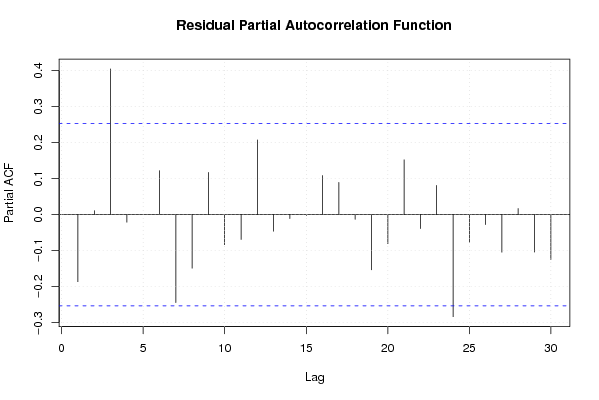
pacf(mysum$resid, lag.max=length(mysum$resid)/2, main='Residual Partial Autocorrelation Function')
grid()
dev.off()
bitmap(file='test8.png')
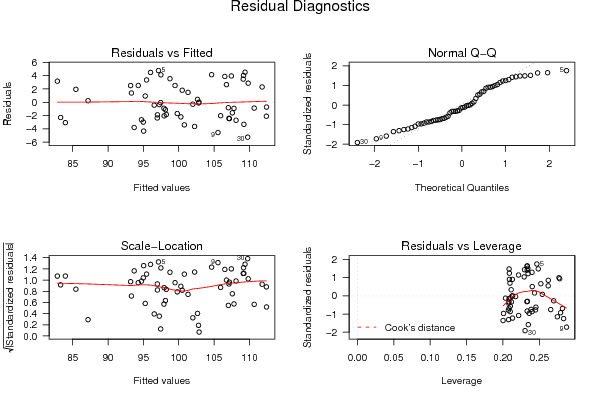
opar <- par(mfrow = c(2,2), oma = c(0, 0, 1.1, 0))
plot(mylm, las = 1, sub='Residual Diagnostics')
par(opar)
dev.off()
if (n > n25) {
bitmap(file='test9.png')
plot(kp3:nmkm3,gqarr[,2], main='Goldfeld-Quandt test',ylab='2-sided p-value',xlab='breakpoint')
grid()
dev.off()
}
load(file='createtable')
a<-table.start()
a<-table.row.start(a)
a<-table.element(a, 'Multiple Linear Regression - Estimated Regression Equation', 1, TRUE)
a<-table.row.end(a)
myeq <- colnames(x)[1]
myeq <- paste(myeq, '[t] = ', sep='')
for (i in 1:k){
if (mysum$coefficients[i,1] > 0) myeq <- paste(myeq, '+', '')
myeq <- paste(myeq, mysum$coefficients[i,1], sep=' ')
if (rownames(mysum$coefficients)[i] != '(Intercept)') {
myeq <- paste(myeq, rownames(mysum$coefficients)[i], sep='')
if (rownames(mysum$coefficients)[i] != 't') myeq <- paste(myeq, '[t]', sep='')
}
}
myeq <- paste(myeq, ' + e[t]')
a<-table.row.start(a)
a<-table.element(a, myeq)
a<-table.row.end(a)
a<-table.end(a)
table.save(a,file='mytable1.tab')
a<-table.start()
a<-table.row.start(a)
a<-table.element(a,hyperlink('ols1.htm','Multiple Linear Regression - Ordinary Least Squares',''), 6, TRUE)
a<-table.row.end(a)
a<-table.row.start(a)
a<-table.element(a,'Variable',header=TRUE)
a<-table.element(a,'Parameter',header=TRUE)
a<-table.element(a,'S.D.',header=TRUE)
a<-table.element(a,'T-STAT
H0: parameter = 0',header=TRUE)
a<-table.element(a,'2-tail p-value',header=TRUE)
a<-table.element(a,'1-tail p-value',header=TRUE)
a<-table.row.end(a)
for (i in 1:k){
a<-table.row.start(a)
a<-table.element(a,rownames(mysum$coefficients)[i],header=TRUE)
a<-table.element(a,mysum$coefficients[i,1])
a<-table.element(a, round(mysum$coefficients[i,2],6))
a<-table.element(a, round(mysum$coefficients[i,3],4))
a<-table.element(a, round(mysum$coefficients[i,4],6))
a<-table.element(a, round(mysum$coefficients[i,4]/2,6))
a<-table.row.end(a)
}
a<-table.end(a)
table.save(a,file='mytable2.tab')
a<-table.start()
a<-table.row.start(a)
a<-table.element(a, 'Multiple Linear Regression - Regression Statistics', 2, TRUE)
a<-table.row.end(a)
a<-table.row.start(a)
a<-table.element(a, 'Multiple R',1,TRUE)
a<-table.element(a, sqrt(mysum$r.squared))
a<-table.row.end(a)
a<-table.row.start(a)
a<-table.element(a, 'R-squared',1,TRUE)
a<-table.element(a, mysum$r.squared)
a<-table.row.end(a)
a<-table.row.start(a)
a<-table.element(a, 'Adjusted R-squared',1,TRUE)
a<-table.element(a, mysum$adj.r.squared)
a<-table.row.end(a)
a<-table.row.start(a)
a<-table.element(a, 'F-TEST (value)',1,TRUE)
a<-table.element(a, mysum$fstatistic[1])
a<-table.row.end(a)
a<-table.row.start(a)
a<-table.element(a, 'F-TEST (DF numerator)',1,TRUE)
a<-table.element(a, mysum$fstatistic[2])
a<-table.row.end(a)
a<-table.row.start(a)
a<-table.element(a, 'F-TEST (DF denominator)',1,TRUE)
a<-table.element(a, mysum$fstatistic[3])
a<-table.row.end(a)
a<-table.row.start(a)
a<-table.element(a, 'p-value',1,TRUE)
a<-table.element(a, 1-pf(mysum$fstatistic[1],mysum$fstatistic[2],mysum$fstatistic[3]))
a<-table.row.end(a)
a<-table.row.start(a)
a<-table.element(a, 'Multiple Linear Regression - Residual Statistics', 2, TRUE)
a<-table.row.end(a)
a<-table.row.start(a)
a<-table.element(a, 'Residual Standard Deviation',1,TRUE)
a<-table.element(a, mysum$sigma)
a<-table.row.end(a)
a<-table.row.start(a)
a<-table.element(a, 'Sum Squared Residuals',1,TRUE)
a<-table.element(a, sum(myerror*myerror))
a<-table.row.end(a)
a<-table.end(a)
table.save(a,file='mytable3.tab')
a<-table.start()
a<-table.row.start(a)
a<-table.element(a, 'Multiple Linear Regression - Actuals, Interpolation, and Residuals', 4, TRUE)
a<-table.row.end(a)
a<-table.row.start(a)
a<-table.element(a, 'Time or Index', 1, TRUE)
a<-table.element(a, 'Actuals', 1, TRUE)
a<-table.element(a, 'Interpolation
Forecast', 1, TRUE)
a<-table.element(a, 'Residuals
Prediction Error', 1, TRUE)
a<-table.row.end(a)
for (i in 1:n) {
a<-table.row.start(a)
a<-table.element(a,i, 1, TRUE)
a<-table.element(a,x[i])
a<-table.element(a,x[i]-mysum$resid[i])
a<-table.element(a,mysum$resid[i])
a<-table.row.end(a)
}
a<-table.end(a)
table.save(a,file='mytable4.tab')
if (n > n25) {
a<-table.start()
a<-table.row.start(a)
a<-table.element(a,'Goldfeld-Quandt test for Heteroskedasticity',4,TRUE)
a<-table.row.end(a)
a<-table.row.start(a)
a<-table.element(a,'p-values',header=TRUE)
a<-table.element(a,'Alternative Hypothesis',3,header=TRUE)
a<-table.row.end(a)
a<-table.row.start(a)
a<-table.element(a,'breakpoint index',header=TRUE)
a<-table.element(a,'greater',header=TRUE)
a<-table.element(a,'2-sided',header=TRUE)
a<-table.element(a,'less',header=TRUE)
a<-table.row.end(a)
for (mypoint in kp3:nmkm3) {
a<-table.row.start(a)
a<-table.element(a,mypoint,header=TRUE)
a<-table.element(a,gqarr[mypoint-kp3+1,1])
a<-table.element(a,gqarr[mypoint-kp3+1,2])
a<-table.element(a,gqarr[mypoint-kp3+1,3])
a<-table.row.end(a)
}
a<-table.end(a)
table.save(a,file='mytable5.tab')
a<-table.start()
a<-table.row.start(a)
a<-table.element(a,'Meta Analysis of Goldfeld-Quandt test for Heteroskedasticity',4,TRUE)
a<-table.row.end(a)
a<-table.row.start(a)
a<-table.element(a,'Description',header=TRUE)
a<-table.element(a,'# significant tests',header=TRUE)
a<-table.element(a,'% significant tests',header=TRUE)
a<-table.element(a,'OK/NOK',header=TRUE)
a<-table.row.end(a)
a<-table.row.start(a)
a<-table.element(a,'1% type I error level',header=TRUE)
a<-table.element(a,numsignificant1)
a<-table.element(a,numsignificant1/numgqtests)
if (numsignificant1/numgqtests < 0.01) dum <- 'OK' else dum <- 'NOK'
a<-table.element(a,dum)
a<-table.row.end(a)
a<-table.row.start(a)
a<-table.element(a,'5% type I error level',header=TRUE)
a<-table.element(a,numsignificant5)
a<-table.element(a,numsignificant5/numgqtests)
if (numsignificant5/numgqtests < 0.05) dum <- 'OK' else dum <- 'NOK'
a<-table.element(a,dum)
a<-table.row.end(a)
a<-table.row.start(a)
a<-table.element(a,'10% type I error level',header=TRUE)
a<-table.element(a,numsignificant10)
a<-table.element(a,numsignificant10/numgqtests)
if (numsignificant10/numgqtests < 0.1) dum <- 'OK' else dum <- 'NOK'
a<-table.element(a,dum)
a<-table.row.end(a)
a<-table.end(a)
table.save(a,file='mytable6.tab')
}