Free Statistics
of Irreproducible Research!
Description of Statistical Computation | |||||||||||||||||||||||||||||||||||||||||||||||||||||||||||||||||||||||||||||||||||||||||||||||||||||||||||||||||||||||||||||||||||||||||||||||||||||||||||||||||||||||||||||||||||||||||||||||||||||||||||||||||||||||||||||||||||||||||||||||||||||||||||||||||||||||||||
|---|---|---|---|---|---|---|---|---|---|---|---|---|---|---|---|---|---|---|---|---|---|---|---|---|---|---|---|---|---|---|---|---|---|---|---|---|---|---|---|---|---|---|---|---|---|---|---|---|---|---|---|---|---|---|---|---|---|---|---|---|---|---|---|---|---|---|---|---|---|---|---|---|---|---|---|---|---|---|---|---|---|---|---|---|---|---|---|---|---|---|---|---|---|---|---|---|---|---|---|---|---|---|---|---|---|---|---|---|---|---|---|---|---|---|---|---|---|---|---|---|---|---|---|---|---|---|---|---|---|---|---|---|---|---|---|---|---|---|---|---|---|---|---|---|---|---|---|---|---|---|---|---|---|---|---|---|---|---|---|---|---|---|---|---|---|---|---|---|---|---|---|---|---|---|---|---|---|---|---|---|---|---|---|---|---|---|---|---|---|---|---|---|---|---|---|---|---|---|---|---|---|---|---|---|---|---|---|---|---|---|---|---|---|---|---|---|---|---|---|---|---|---|---|---|---|---|---|---|---|---|---|---|---|---|---|---|---|---|---|---|---|---|---|---|---|---|---|---|---|---|---|---|---|---|---|---|---|---|---|---|---|---|---|---|---|---|---|
| Author's title | |||||||||||||||||||||||||||||||||||||||||||||||||||||||||||||||||||||||||||||||||||||||||||||||||||||||||||||||||||||||||||||||||||||||||||||||||||||||||||||||||||||||||||||||||||||||||||||||||||||||||||||||||||||||||||||||||||||||||||||||||||||||||||||||||||||||||||
| Author | *The author of this computation has been verified* | ||||||||||||||||||||||||||||||||||||||||||||||||||||||||||||||||||||||||||||||||||||||||||||||||||||||||||||||||||||||||||||||||||||||||||||||||||||||||||||||||||||||||||||||||||||||||||||||||||||||||||||||||||||||||||||||||||||||||||||||||||||||||||||||||||||||||||
| R Software Module | Ian.Hollidayrwasp_Two Factor ANOVA.wasp | ||||||||||||||||||||||||||||||||||||||||||||||||||||||||||||||||||||||||||||||||||||||||||||||||||||||||||||||||||||||||||||||||||||||||||||||||||||||||||||||||||||||||||||||||||||||||||||||||||||||||||||||||||||||||||||||||||||||||||||||||||||||||||||||||||||||||||
| Title produced by software | Analysis of Variance Free Statistics Software (Calculator) | ||||||||||||||||||||||||||||||||||||||||||||||||||||||||||||||||||||||||||||||||||||||||||||||||||||||||||||||||||||||||||||||||||||||||||||||||||||||||||||||||||||||||||||||||||||||||||||||||||||||||||||||||||||||||||||||||||||||||||||||||||||||||||||||||||||||||||
| Date of computation | Sun, 13 Dec 2009 07:34:14 -0700 | ||||||||||||||||||||||||||||||||||||||||||||||||||||||||||||||||||||||||||||||||||||||||||||||||||||||||||||||||||||||||||||||||||||||||||||||||||||||||||||||||||||||||||||||||||||||||||||||||||||||||||||||||||||||||||||||||||||||||||||||||||||||||||||||||||||||||||
| Cite this page as follows | Statistical Computations at FreeStatistics.org, Office for Research Development and Education, URL https://freestatistics.org/blog/index.php?v=date/2009/Dec/13/t1260714914lfcedgtmxhzf0f9.htm/, Retrieved Sun, 28 Apr 2024 12:29:13 +0000 | ||||||||||||||||||||||||||||||||||||||||||||||||||||||||||||||||||||||||||||||||||||||||||||||||||||||||||||||||||||||||||||||||||||||||||||||||||||||||||||||||||||||||||||||||||||||||||||||||||||||||||||||||||||||||||||||||||||||||||||||||||||||||||||||||||||||||||
| Statistical Computations at FreeStatistics.org, Office for Research Development and Education, URL https://freestatistics.org/blog/index.php?pk=67302, Retrieved Sun, 28 Apr 2024 12:29:13 +0000 | |||||||||||||||||||||||||||||||||||||||||||||||||||||||||||||||||||||||||||||||||||||||||||||||||||||||||||||||||||||||||||||||||||||||||||||||||||||||||||||||||||||||||||||||||||||||||||||||||||||||||||||||||||||||||||||||||||||||||||||||||||||||||||||||||||||||||||
| QR Codes: | |||||||||||||||||||||||||||||||||||||||||||||||||||||||||||||||||||||||||||||||||||||||||||||||||||||||||||||||||||||||||||||||||||||||||||||||||||||||||||||||||||||||||||||||||||||||||||||||||||||||||||||||||||||||||||||||||||||||||||||||||||||||||||||||||||||||||||
|
| |||||||||||||||||||||||||||||||||||||||||||||||||||||||||||||||||||||||||||||||||||||||||||||||||||||||||||||||||||||||||||||||||||||||||||||||||||||||||||||||||||||||||||||||||||||||||||||||||||||||||||||||||||||||||||||||||||||||||||||||||||||||||||||||||||||||||||
| Original text written by user: | |||||||||||||||||||||||||||||||||||||||||||||||||||||||||||||||||||||||||||||||||||||||||||||||||||||||||||||||||||||||||||||||||||||||||||||||||||||||||||||||||||||||||||||||||||||||||||||||||||||||||||||||||||||||||||||||||||||||||||||||||||||||||||||||||||||||||||
| IsPrivate? | No (this computation is public) | ||||||||||||||||||||||||||||||||||||||||||||||||||||||||||||||||||||||||||||||||||||||||||||||||||||||||||||||||||||||||||||||||||||||||||||||||||||||||||||||||||||||||||||||||||||||||||||||||||||||||||||||||||||||||||||||||||||||||||||||||||||||||||||||||||||||||||
| User-defined keywords | |||||||||||||||||||||||||||||||||||||||||||||||||||||||||||||||||||||||||||||||||||||||||||||||||||||||||||||||||||||||||||||||||||||||||||||||||||||||||||||||||||||||||||||||||||||||||||||||||||||||||||||||||||||||||||||||||||||||||||||||||||||||||||||||||||||||||||
| Estimated Impact | 202 | ||||||||||||||||||||||||||||||||||||||||||||||||||||||||||||||||||||||||||||||||||||||||||||||||||||||||||||||||||||||||||||||||||||||||||||||||||||||||||||||||||||||||||||||||||||||||||||||||||||||||||||||||||||||||||||||||||||||||||||||||||||||||||||||||||||||||||
Tree of Dependent Computations | |||||||||||||||||||||||||||||||||||||||||||||||||||||||||||||||||||||||||||||||||||||||||||||||||||||||||||||||||||||||||||||||||||||||||||||||||||||||||||||||||||||||||||||||||||||||||||||||||||||||||||||||||||||||||||||||||||||||||||||||||||||||||||||||||||||||||||
| Family? (F = Feedback message, R = changed R code, M = changed R Module, P = changed Parameters, D = changed Data) | |||||||||||||||||||||||||||||||||||||||||||||||||||||||||||||||||||||||||||||||||||||||||||||||||||||||||||||||||||||||||||||||||||||||||||||||||||||||||||||||||||||||||||||||||||||||||||||||||||||||||||||||||||||||||||||||||||||||||||||||||||||||||||||||||||||||||||
| - [Analysis of Variance Free Statistics Software (Calculator)] [TWO WAY ANOVA TES...] [2009-12-13 11:19:27] [98fd0e87c3eb04e0cc2efde01dbafab6] - R PD [Analysis of Variance Free Statistics Software (Calculator)] [TWO WAY ANOVA TES...] [2009-12-13 14:34:14] [a9208f4f8d3b118336aae915785f2bd9] [Current] - PD [Analysis of Variance Free Statistics Software (Calculator)] [Curry Rating ANOVA] [2009-12-15 20:22:07] [3fdd735c61ad38cbc9b3393dc997cdb7] - R [Analysis of Variance Free Statistics Software (Calculator)] [TWO WAY ANOVA Cur...] [2009-12-15 23:51:12] [98fd0e87c3eb04e0cc2efde01dbafab6] - P [Analysis of Variance Free Statistics Software (Calculator)] [] [2009-12-17 08:50:54] [74be16979710d4c4e7c6647856088456] - D [Analysis of Variance Free Statistics Software (Calculator)] [Two-Way ANOVA Cu...] [2009-12-16 14:59:26] [3fdd735c61ad38cbc9b3393dc997cdb7] - D [Analysis of Variance Free Statistics Software (Calculator)] [workshop 11] [2009-12-17 12:27:03] [86674042f568b97a0cb1393bb670625c] - [Analysis of Variance Free Statistics Software (Calculator)] [Wk11Q1a] [2009-12-17 12:33:11] [68b4a0d51ad214b1a79d67393064cb7e] - [Analysis of Variance Free Statistics Software (Calculator)] [workshop 11] [2009-12-17 12:34:17] [86674042f568b97a0cb1393bb670625c] - [Analysis of Variance Free Statistics Software (Calculator)] [] [2009-12-17 12:38:20] [82439cd473f0ddf8a88eb1802dda9b6c] - [Analysis of Variance Free Statistics Software (Calculator)] [smoker/non smoker...] [2009-12-17 12:35:46] [e8203e272d1fe64b4ec8ac05ae2152eb] - [Analysis of Variance Free Statistics Software (Calculator)] [comp] [2010-01-11 16:03:02] [153000c0b3bd367036e4d581452d08df] - [Analysis of Variance Free Statistics Software (Calculator)] [comp] [2010-01-12 14:39:07] [153000c0b3bd367036e4d581452d08df] - [Analysis of Variance Free Statistics Software (Calculator)] [week 11 excercise...] [2009-12-17 12:44:59] [a2ec18f77143ca7c2255feafca790c81] - [Analysis of Variance Free Statistics Software (Calculator)] [2nd blog] [2009-12-17 12:36:35] [5cae40017fc37cfe76436682b5003098] - [Analysis of Variance Free Statistics Software (Calculator)] [w11] [2009-12-17 12:51:20] [66f61a2d5ef80b1eafe31e5651ad0889] - [Analysis of Variance Free Statistics Software (Calculator)] [Ex 2] [2010-01-11 15:56:29] [153000c0b3bd367036e4d581452d08df] - P [Analysis of Variance Free Statistics Software (Calculator)] [] [2009-12-17 13:10:56] [21e0dc66e9338653c0fd8541e5a86956] - [Analysis of Variance Free Statistics Software (Calculator)] [week11 ] [2009-12-17 13:15:55] [ca384074e13d8ac77eea5bf691c887ff] - [Analysis of Variance Free Statistics Software (Calculator)] [] [2009-12-17 13:33:51] [981ccd4f0082ace49a11aa7a2b792a9c] - [Analysis of Variance Free Statistics Software (Calculator)] [] [2009-12-17 13:43:34] [a120050d9c71216a504f7d26958aa6f2] - [Analysis of Variance Free Statistics Software (Calculator)] [two-way ANOVA part A] [2009-12-17 13:43:33] [991f3c16ff1ec6689e9f3866d072593e] - [Analysis of Variance Free Statistics Software (Calculator)] [Two-way ANOVA tes...] [2009-12-17 13:28:28] [cf93fcabe70097db6e8467c3ff511999] - [Analysis of Variance Free Statistics Software (Calculator)] [] [2009-12-20 15:16:20] [a120050d9c71216a504f7d26958aa6f2] - [Analysis of Variance Free Statistics Software (Calculator)] [comp 11] [2010-01-18 20:26:19] [856c65906cd78e3f7881668c6dfea87f] - [Analysis of Variance Free Statistics Software (Calculator)] [] [2009-12-20 15:44:45] [a120050d9c71216a504f7d26958aa6f2] - [Analysis of Variance Free Statistics Software (Calculator)] [comp levine] [2010-01-18 20:28:50] [856c65906cd78e3f7881668c6dfea87f] - [Analysis of Variance Free Statistics Software (Calculator)] [comp other] [2010-01-18 20:32:28] [856c65906cd78e3f7881668c6dfea87f] - [Analysis of Variance Free Statistics Software (Calculator)] [Part A Q2] [2009-12-21 00:48:18] [256a42577f5eb7e9c8a1b74c73a90fa8] - [Analysis of Variance Free Statistics Software (Calculator)] [workshop] [2009-12-21 21:28:40] [7ee8584ae92dbbc2a823887b8397aaa8] - [Analysis of Variance Free Statistics Software (Calculator)] [Workshop 11] [2009-12-23 10:38:40] [c0fd4f9a7f3faddc4844dbb572f0833e] - [Analysis of Variance Free Statistics Software (Calculator)] [week 11 ] [2009-12-25 10:29:18] [106fd92ebdfc37d50078b47c695098c5] - [Analysis of Variance Free Statistics Software (Calculator)] [blog 1] [2010-01-11 15:54:27] [7d07ebb7f3978280240b500f174a2af2] - [Analysis of Variance Free Statistics Software (Calculator)] [week 11] [2010-01-01 19:04:55] [166b3b50b14ad81e946931c96c6ff94f] - R [Analysis of Variance Free Statistics Software (Calculator)] [compendium11 part...] [2010-01-01 21:33:20] [19a2c65e68e6122b331d75519d2b8dfb] - R [Analysis of Variance Free Statistics Software (Calculator)] [compendium11 part...] [2010-01-01 22:20:22] [19a2c65e68e6122b331d75519d2b8dfb] - [Analysis of Variance Free Statistics Software (Calculator)] [Curry data pt 2: ...] [2010-01-03 16:44:08] [226e457c23f16abdaf22fe48e6e411fd] - [Analysis of Variance Free Statistics Software (Calculator)] [status/curry] [2010-01-08 09:57:17] [c7d0e78e2fa8da0e0b2bee0011c20ac0] - R [Analysis of Variance Free Statistics Software (Calculator)] [] [2010-01-09 01:11:51] [36cf82ea4074b55afa05ece289b9dfca] - [Analysis of Variance Free Statistics Software (Calculator)] [comp 11] [2010-01-11 14:50:17] [e8bb49267f0b4e611f4778412d0811f2] - [Analysis of Variance Free Statistics Software (Calculator)] [compendium 11] [2010-01-11 16:01:19] [2185b0545466c0a8649e1b1b76e104e0] - [Analysis of Variance Free Statistics Software (Calculator)] [Effects of Smokin...] [2010-01-11 16:00:02] [814d7f27257f4c09e0e8a930c67f7fe6] - [Analysis of Variance Free Statistics Software (Calculator)] [] [2010-01-11 20:30:32] [c92a6f82e2c829eb84d446c49982f3a5] - R [Analysis of Variance Free Statistics Software (Calculator)] [compendium 11] [2010-01-11 21:19:42] [0dff2a868db4b5bcbf64703b84410784] - R [Analysis of Variance Free Statistics Software (Calculator)] [part 1] [2010-01-11 21:28:36] [e50002609a86c8cc3f92b69a15f3a57a] - [Analysis of Variance Free Statistics Software (Calculator)] [CompendiumWeek1110] [2010-01-11 22:02:17] [175567c9546e50fd2412bc13fece161f] - P [Analysis of Variance Free Statistics Software (Calculator)] [curry-two way ANOVA] [2010-01-11 22:43:43] [2cb75f3785cab2383fe897d8b1eb3abc] - [Analysis of Variance Free Statistics Software (Calculator)] [ANOVA exer a] [2010-01-12 11:36:48] [9dc333cea70095e4d9c08ad15f70f6c6] - [Analysis of Variance Free Statistics Software (Calculator)] [Part A - Curry Ex...] [2010-01-12 12:21:02] [8431b2cca73e677c29fb8bfdfc230859] - [Analysis of Variance Free Statistics Software (Calculator)] [wk 11 ex 1 comp] [2010-01-12 13:19:47] [c519646407a489a26f129bdc22b2e203] [Truncated] | |||||||||||||||||||||||||||||||||||||||||||||||||||||||||||||||||||||||||||||||||||||||||||||||||||||||||||||||||||||||||||||||||||||||||||||||||||||||||||||||||||||||||||||||||||||||||||||||||||||||||||||||||||||||||||||||||||||||||||||||||||||||||||||||||||||||||||
| Feedback Forum | |||||||||||||||||||||||||||||||||||||||||||||||||||||||||||||||||||||||||||||||||||||||||||||||||||||||||||||||||||||||||||||||||||||||||||||||||||||||||||||||||||||||||||||||||||||||||||||||||||||||||||||||||||||||||||||||||||||||||||||||||||||||||||||||||||||||||||
Post a new message | |||||||||||||||||||||||||||||||||||||||||||||||||||||||||||||||||||||||||||||||||||||||||||||||||||||||||||||||||||||||||||||||||||||||||||||||||||||||||||||||||||||||||||||||||||||||||||||||||||||||||||||||||||||||||||||||||||||||||||||||||||||||||||||||||||||||||||
Dataset | |||||||||||||||||||||||||||||||||||||||||||||||||||||||||||||||||||||||||||||||||||||||||||||||||||||||||||||||||||||||||||||||||||||||||||||||||||||||||||||||||||||||||||||||||||||||||||||||||||||||||||||||||||||||||||||||||||||||||||||||||||||||||||||||||||||||||||
| Dataseries X: | |||||||||||||||||||||||||||||||||||||||||||||||||||||||||||||||||||||||||||||||||||||||||||||||||||||||||||||||||||||||||||||||||||||||||||||||||||||||||||||||||||||||||||||||||||||||||||||||||||||||||||||||||||||||||||||||||||||||||||||||||||||||||||||||||||||||||||
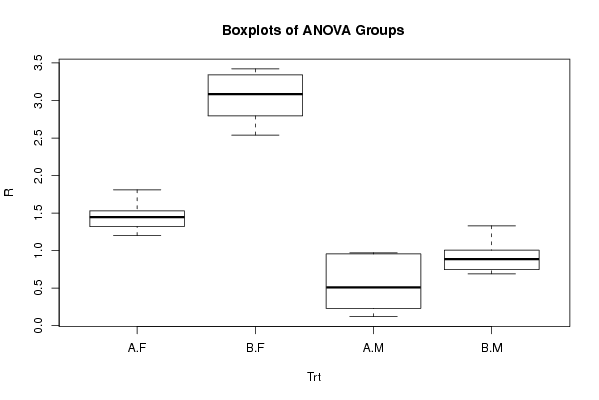
0.28 'A' 'M' 0.95 'A' 'M' 0.96 'A' 'M' 0.97 'A' 'M' 0.40 'A' 'M' 0.18 'A' 'M' 0.12 'A' 'M' 0.62 'A' 'M' 1.81 'A' 'F' 1.51 'A' 'F' 1.41 'A' 'F' 1.39 'A' 'F' 1.20 'A' 'F' 1.55 'A' 'F' 1.48 'A' 'F' 1.25 'A' 'F' 0.95 'B' 'M' 1.33 'B' 'M' 0.92 'B' 'M' 0.85 'B' 'M' 1.06 'B' 'M' 0.69 'B' 'M' 0.70 'B' 'M' 0.79 'B' 'M' 2.93 'B' 'F' 3.24 'B' 'F' 3.42 'B' 'F' 2.79 'B' 'F' 2.54 'B' 'F' 3.28 'B' 'F' 2.80 'B' 'F' 3.40 'B' 'F' | |||||||||||||||||||||||||||||||||||||||||||||||||||||||||||||||||||||||||||||||||||||||||||||||||||||||||||||||||||||||||||||||||||||||||||||||||||||||||||||||||||||||||||||||||||||||||||||||||||||||||||||||||||||||||||||||||||||||||||||||||||||||||||||||||||||||||||
Tables (Output of Computation) | |||||||||||||||||||||||||||||||||||||||||||||||||||||||||||||||||||||||||||||||||||||||||||||||||||||||||||||||||||||||||||||||||||||||||||||||||||||||||||||||||||||||||||||||||||||||||||||||||||||||||||||||||||||||||||||||||||||||||||||||||||||||||||||||||||||||||||
| |||||||||||||||||||||||||||||||||||||||||||||||||||||||||||||||||||||||||||||||||||||||||||||||||||||||||||||||||||||||||||||||||||||||||||||||||||||||||||||||||||||||||||||||||||||||||||||||||||||||||||||||||||||||||||||||||||||||||||||||||||||||||||||||||||||||||||
Figures (Output of Computation) | |||||||||||||||||||||||||||||||||||||||||||||||||||||||||||||||||||||||||||||||||||||||||||||||||||||||||||||||||||||||||||||||||||||||||||||||||||||||||||||||||||||||||||||||||||||||||||||||||||||||||||||||||||||||||||||||||||||||||||||||||||||||||||||||||||||||||||
Input Parameters & R Code | |||||||||||||||||||||||||||||||||||||||||||||||||||||||||||||||||||||||||||||||||||||||||||||||||||||||||||||||||||||||||||||||||||||||||||||||||||||||||||||||||||||||||||||||||||||||||||||||||||||||||||||||||||||||||||||||||||||||||||||||||||||||||||||||||||||||||||
| Parameters (Session): | |||||||||||||||||||||||||||||||||||||||||||||||||||||||||||||||||||||||||||||||||||||||||||||||||||||||||||||||||||||||||||||||||||||||||||||||||||||||||||||||||||||||||||||||||||||||||||||||||||||||||||||||||||||||||||||||||||||||||||||||||||||||||||||||||||||||||||
| Parameters (R input): | |||||||||||||||||||||||||||||||||||||||||||||||||||||||||||||||||||||||||||||||||||||||||||||||||||||||||||||||||||||||||||||||||||||||||||||||||||||||||||||||||||||||||||||||||||||||||||||||||||||||||||||||||||||||||||||||||||||||||||||||||||||||||||||||||||||||||||
| par1 = 1 ; par2 = 2 ; par3 = 3 ; par4 = TRUE ; | |||||||||||||||||||||||||||||||||||||||||||||||||||||||||||||||||||||||||||||||||||||||||||||||||||||||||||||||||||||||||||||||||||||||||||||||||||||||||||||||||||||||||||||||||||||||||||||||||||||||||||||||||||||||||||||||||||||||||||||||||||||||||||||||||||||||||||
| R code (references can be found in the software module): | |||||||||||||||||||||||||||||||||||||||||||||||||||||||||||||||||||||||||||||||||||||||||||||||||||||||||||||||||||||||||||||||||||||||||||||||||||||||||||||||||||||||||||||||||||||||||||||||||||||||||||||||||||||||||||||||||||||||||||||||||||||||||||||||||||||||||||
cat1 <- as.numeric(par1) # | |||||||||||||||||||||||||||||||||||||||||||||||||||||||||||||||||||||||||||||||||||||||||||||||||||||||||||||||||||||||||||||||||||||||||||||||||||||||||||||||||||||||||||||||||||||||||||||||||||||||||||||||||||||||||||||||||||||||||||||||||||||||||||||||||||||||||||