Free Statistics

of Irreproducible Research!

Author's title

Author*The author of this computation has been verified*
R Software Modulerwasp_multipleregression.wasp
Title produced by softwareMultiple Regression
Date of computationSun, 13 Dec 2009 08:36:08 -0700
Cite this page as followsStatistical Computations at FreeStatistics.org, Office for Research Development and Education, URL https://freestatistics.org/blog/index.php?v=date/2009/Dec/13/t1260718816w2ft18fudiy4c3y.htm/, Retrieved Sun, 28 Apr 2024 05:59:51 +0000
Statistical Computations at FreeStatistics.org, Office for Research Development and Education, URL https://freestatistics.org/blog/index.php?pk=67335, Retrieved Sun, 28 Apr 2024 05:59:51 +0000
QR Codes:

Original text written by user:
IsPrivate?No (this computation is public)
User-defined keywords
Estimated Impact142
Family? (F = Feedback message, R = changed R code, M = changed R Module, P = changed Parameters, D = changed Data)
-     [Multiple Regression] [] [2009-11-22 16:56:15] [1eac2882020791f6c49a90a91c34285a]
- R PD  [Multiple Regression] [] [2009-12-12 16:54:21] [1eac2882020791f6c49a90a91c34285a]
-   PD      [Multiple Regression] [] [2009-12-13 15:36:08] [21503129a47c64de7f80e1fde84c3a45] [Current]
Feedback Forum

Post a new message
Dataseries X:
101.9	96.4	110.4	100.5	98.8	93.7
106.2	101.9	96.4	110.4	100.5	106.7
81	106.2	101.9	96.4	110.4	86.7
94.7	81	106.2	101.9	96.4	95.3
101	94.7	81	106.2	101.9	99.3
109.4	101	94.7	81	106.2	101.8
102.3	109.4	101	94.7	81	96
90.7	102.3	109.4	101	94.7	91.7
96.2	90.7	102.3	109.4	101	95.3
96.1	96.2	90.7	102.3	109.4	96.6
106	96.1	96.2	90.7	102.3	107.2
103.1	106	96.1	96.2	90.7	108
102	103.1	106	96.1	96.2	98.4
104.7	102	103.1	106	96.1	103.1
86	104.7	102	103.1	106	81.1
92.1	86	104.7	102	103.1	96.6
106.9	92.1	86	104.7	102	103.7
112.6	106.9	92.1	86	104.7	106.6
101.7	112.6	106.9	92.1	86	97.6
92	101.7	112.6	106.9	92.1	87.6
97.4	92	101.7	112.6	106.9	99.4
97	97.4	92	101.7	112.6	98.5
105.4	97	97.4	92	101.7	105.2
102.7	105.4	97	97.4	92	104.6
98.1	102.7	105.4	97	97.4	97.5
104.5	98.1	102.7	105.4	97	108.9
87.4	104.5	98.1	102.7	105.4	86.8
89.9	87.4	104.5	98.1	102.7	88.9
109.8	89.9	87.4	104.5	98.1	110.3
111.7	109.8	89.9	87.4	104.5	114.8
98.6	111.7	109.8	89.9	87.4	94.6
96.9	98.6	111.7	109.8	89.9	92
95.1	96.9	98.6	111.7	109.8	93.8
97	95.1	96.9	98.6	111.7	93.8
112.7	97	95.1	96.9	98.6	107.6
102.9	112.7	97	95.1	96.9	101
97.4	102.9	112.7	97	95.1	95.4
111.4	97.4	102.9	112.7	97	96.5
87.4	111.4	97.4	102.9	112.7	89.2
96.8	87.4	111.4	97.4	102.9	87.1
114.1	96.8	87.4	111.4	97.4	110.5
110.3	114.1	96.8	87.4	111.4	110.8
103.9	110.3	114.1	96.8	87.4	104.2
101.6	103.9	110.3	114.1	96.8	88.9
94.6	101.6	103.9	110.3	114.1	89.8
95.9	94.6	101.6	103.9	110.3	90
104.7	95.9	94.6	101.6	103.9	93.9
102.8	104.7	95.9	94.6	101.6	91.3
98.1	102.8	104.7	95.9	94.6	87.8
113.9	98.1	102.8	104.7	95.9	99.7
80.9	113.9	98.1	102.8	104.7	73.5
95.7	80.9	113.9	98.1	102.8	79.2
113.2	95.7	80.9	113.9	98.1	96.9
105.9	113.2	95.7	80.9	113.9	95.2
108.8	105.9	113.2	95.7	80.9	95.6
102.3	108.8	105.9	113.2	95.7	89.7


Summary of computational transaction
Raw Inputview raw input (R code)
Raw Outputview raw output of R engine
Computing time3 seconds
R Server'Gwilym Jenkins' @ 72.249.127.135

\begin{tabular}{lllllllll}
\hline
Summary of computational transaction \tabularnewline
Raw Input & view raw input (R code)  \tabularnewline
Raw Output & view raw output of R engine  \tabularnewline
Computing time & 3 seconds \tabularnewline
R Server & 'Gwilym Jenkins' @ 72.249.127.135 \tabularnewline
\hline
\end{tabular}
%Source: https://freestatistics.org/blog/index.php?pk=67335&T=0

[TABLE]
[ROW][C]Summary of computational transaction[/C][/ROW]
[ROW][C]Raw Input[/C][C]view raw input (R code) [/C][/ROW]
[ROW][C]Raw Output[/C][C]view raw output of R engine [/C][/ROW]
[ROW][C]Computing time[/C][C]3 seconds[/C][/ROW]
[ROW][C]R Server[/C][C]'Gwilym Jenkins' @ 72.249.127.135[/C][/ROW]
[/TABLE]
Source: https://freestatistics.org/blog/index.php?pk=67335&T=0

Globally Unique Identifier (entire table): ba.freestatistics.org/blog/index.php?pk=67335&T=0

As an alternative you can also use a QR Code:  

The GUIDs for individual cells are displayed in the table below:

Summary of computational transaction
Raw Inputview raw input (R code)
Raw Outputview raw output of R engine
Computing time3 seconds
R Server'Gwilym Jenkins' @ 72.249.127.135


Multiple Linear Regression - Estimated Regression Equation
Y[t] = + 95.4128864396907 -0.373522045942315`Y(t-1)`[t] -0.0751593337637079`Y(t-2)`[t] + 0.35885170198808`Y(t-3)`[t] -0.0788126508587618`Y(t-4)`[t] + 0.240211501967378X[t] -2.86774271905553M1[t] -1.32952280976387M2[t] -14.2114323871744M3[t] -14.3746263866844M4[t] -4.43378811719101M5[t] + 11.5304356672672M6[t] + 2.77911200658021M7[t] -9.08766106143715M8[t] -13.6044063583265M9[t] -9.75894265732346M10[t] + 0.542826991949121M11[t] + 0.118834153023582t + e[t]

\begin{tabular}{lllllllll}
\hline
Multiple Linear Regression - Estimated Regression Equation \tabularnewline
Y[t] =  +  95.4128864396907 -0.373522045942315`Y(t-1)`[t] -0.0751593337637079`Y(t-2)`[t] +  0.35885170198808`Y(t-3)`[t] -0.0788126508587618`Y(t-4)`[t] +  0.240211501967378X[t] -2.86774271905553M1[t] -1.32952280976387M2[t] -14.2114323871744M3[t] -14.3746263866844M4[t] -4.43378811719101M5[t] +  11.5304356672672M6[t] +  2.77911200658021M7[t] -9.08766106143715M8[t] -13.6044063583265M9[t] -9.75894265732346M10[t] +  0.542826991949121M11[t] +  0.118834153023582t  + e[t] \tabularnewline
\hline
\end{tabular}
%Source: https://freestatistics.org/blog/index.php?pk=67335&T=1

[TABLE]
[ROW][C]Multiple Linear Regression - Estimated Regression Equation[/C][/ROW]
[ROW][C]Y[t] =  +  95.4128864396907 -0.373522045942315`Y(t-1)`[t] -0.0751593337637079`Y(t-2)`[t] +  0.35885170198808`Y(t-3)`[t] -0.0788126508587618`Y(t-4)`[t] +  0.240211501967378X[t] -2.86774271905553M1[t] -1.32952280976387M2[t] -14.2114323871744M3[t] -14.3746263866844M4[t] -4.43378811719101M5[t] +  11.5304356672672M6[t] +  2.77911200658021M7[t] -9.08766106143715M8[t] -13.6044063583265M9[t] -9.75894265732346M10[t] +  0.542826991949121M11[t] +  0.118834153023582t  + e[t][/C][/ROW]
[/TABLE]
Source: https://freestatistics.org/blog/index.php?pk=67335&T=1

Globally Unique Identifier (entire table): ba.freestatistics.org/blog/index.php?pk=67335&T=1

As an alternative you can also use a QR Code:  

The GUIDs for individual cells are displayed in the table below:

Multiple Linear Regression - Estimated Regression Equation
Y[t] = + 95.4128864396907 -0.373522045942315`Y(t-1)`[t] -0.0751593337637079`Y(t-2)`[t] + 0.35885170198808`Y(t-3)`[t] -0.0788126508587618`Y(t-4)`[t] + 0.240211501967378X[t] -2.86774271905553M1[t] -1.32952280976387M2[t] -14.2114323871744M3[t] -14.3746263866844M4[t] -4.43378811719101M5[t] + 11.5304356672672M6[t] + 2.77911200658021M7[t] -9.08766106143715M8[t] -13.6044063583265M9[t] -9.75894265732346M10[t] + 0.542826991949121M11[t] + 0.118834153023582t + e[t]


Multiple Linear Regression - Ordinary Least Squares
VariableParameterS.D.T-STATH0: parameter = 02-tail p-value1-tail p-value
(Intercept)95.412886439690729.5715463.22650.002580.00129
`Y(t-1)`-0.3735220459423150.152926-2.44250.0193470.009674
`Y(t-2)`-0.07515933376370790.143199-0.52490.602730.301365
`Y(t-3)`0.358851701988080.133682.68440.0107060.005353
`Y(t-4)`-0.07881265085876180.140797-0.55980.5789270.289464
X0.2402115019673780.0837252.8690.0066880.003344
M1-2.867742719055532.432236-1.17910.2457060.122853
M2-1.329522809763872.729066-0.48720.6289360.314468
M3-14.21143238717442.997538-4.7413e-051.5e-05
M4-14.37462638668443.897917-3.68780.0007050.000352
M5-4.433788117191013.968807-1.11720.270940.13547
M611.53043566726722.959423.89620.0003840.000192
M72.779112006580213.3376150.83270.4102370.205119
M8-9.087661061437153.568795-2.54640.0150580.007529
M9-13.60440635832654.064238-3.34730.0018490.000924
M10-9.758942657323463.861444-2.52730.0157760.007888
M110.5428269919491212.9137590.18630.8532020.426601
t0.1188341530235820.0321183.69990.000680.00034

\begin{tabular}{lllllllll}
\hline
Multiple Linear Regression - Ordinary Least Squares \tabularnewline
Variable & Parameter & S.D. & T-STATH0: parameter = 0 & 2-tail p-value & 1-tail p-value \tabularnewline
(Intercept) & 95.4128864396907 & 29.571546 & 3.2265 & 0.00258 & 0.00129 \tabularnewline
`Y(t-1)` & -0.373522045942315 & 0.152926 & -2.4425 & 0.019347 & 0.009674 \tabularnewline
`Y(t-2)` & -0.0751593337637079 & 0.143199 & -0.5249 & 0.60273 & 0.301365 \tabularnewline
`Y(t-3)` & 0.35885170198808 & 0.13368 & 2.6844 & 0.010706 & 0.005353 \tabularnewline
`Y(t-4)` & -0.0788126508587618 & 0.140797 & -0.5598 & 0.578927 & 0.289464 \tabularnewline
X & 0.240211501967378 & 0.083725 & 2.869 & 0.006688 & 0.003344 \tabularnewline
M1 & -2.86774271905553 & 2.432236 & -1.1791 & 0.245706 & 0.122853 \tabularnewline
M2 & -1.32952280976387 & 2.729066 & -0.4872 & 0.628936 & 0.314468 \tabularnewline
M3 & -14.2114323871744 & 2.997538 & -4.741 & 3e-05 & 1.5e-05 \tabularnewline
M4 & -14.3746263866844 & 3.897917 & -3.6878 & 0.000705 & 0.000352 \tabularnewline
M5 & -4.43378811719101 & 3.968807 & -1.1172 & 0.27094 & 0.13547 \tabularnewline
M6 & 11.5304356672672 & 2.95942 & 3.8962 & 0.000384 & 0.000192 \tabularnewline
M7 & 2.77911200658021 & 3.337615 & 0.8327 & 0.410237 & 0.205119 \tabularnewline
M8 & -9.08766106143715 & 3.568795 & -2.5464 & 0.015058 & 0.007529 \tabularnewline
M9 & -13.6044063583265 & 4.064238 & -3.3473 & 0.001849 & 0.000924 \tabularnewline
M10 & -9.75894265732346 & 3.861444 & -2.5273 & 0.015776 & 0.007888 \tabularnewline
M11 & 0.542826991949121 & 2.913759 & 0.1863 & 0.853202 & 0.426601 \tabularnewline
t & 0.118834153023582 & 0.032118 & 3.6999 & 0.00068 & 0.00034 \tabularnewline
\hline
\end{tabular}
%Source: https://freestatistics.org/blog/index.php?pk=67335&T=2

[TABLE]
[ROW][C]Multiple Linear Regression - Ordinary Least Squares[/C][/ROW]
[ROW][C]Variable[/C][C]Parameter[/C][C]S.D.[/C][C]T-STATH0: parameter = 0[/C][C]2-tail p-value[/C][C]1-tail p-value[/C][/ROW]
[ROW][C](Intercept)[/C][C]95.4128864396907[/C][C]29.571546[/C][C]3.2265[/C][C]0.00258[/C][C]0.00129[/C][/ROW]
[ROW][C]`Y(t-1)`[/C][C]-0.373522045942315[/C][C]0.152926[/C][C]-2.4425[/C][C]0.019347[/C][C]0.009674[/C][/ROW]
[ROW][C]`Y(t-2)`[/C][C]-0.0751593337637079[/C][C]0.143199[/C][C]-0.5249[/C][C]0.60273[/C][C]0.301365[/C][/ROW]
[ROW][C]`Y(t-3)`[/C][C]0.35885170198808[/C][C]0.13368[/C][C]2.6844[/C][C]0.010706[/C][C]0.005353[/C][/ROW]
[ROW][C]`Y(t-4)`[/C][C]-0.0788126508587618[/C][C]0.140797[/C][C]-0.5598[/C][C]0.578927[/C][C]0.289464[/C][/ROW]
[ROW][C]X[/C][C]0.240211501967378[/C][C]0.083725[/C][C]2.869[/C][C]0.006688[/C][C]0.003344[/C][/ROW]
[ROW][C]M1[/C][C]-2.86774271905553[/C][C]2.432236[/C][C]-1.1791[/C][C]0.245706[/C][C]0.122853[/C][/ROW]
[ROW][C]M2[/C][C]-1.32952280976387[/C][C]2.729066[/C][C]-0.4872[/C][C]0.628936[/C][C]0.314468[/C][/ROW]
[ROW][C]M3[/C][C]-14.2114323871744[/C][C]2.997538[/C][C]-4.741[/C][C]3e-05[/C][C]1.5e-05[/C][/ROW]
[ROW][C]M4[/C][C]-14.3746263866844[/C][C]3.897917[/C][C]-3.6878[/C][C]0.000705[/C][C]0.000352[/C][/ROW]
[ROW][C]M5[/C][C]-4.43378811719101[/C][C]3.968807[/C][C]-1.1172[/C][C]0.27094[/C][C]0.13547[/C][/ROW]
[ROW][C]M6[/C][C]11.5304356672672[/C][C]2.95942[/C][C]3.8962[/C][C]0.000384[/C][C]0.000192[/C][/ROW]
[ROW][C]M7[/C][C]2.77911200658021[/C][C]3.337615[/C][C]0.8327[/C][C]0.410237[/C][C]0.205119[/C][/ROW]
[ROW][C]M8[/C][C]-9.08766106143715[/C][C]3.568795[/C][C]-2.5464[/C][C]0.015058[/C][C]0.007529[/C][/ROW]
[ROW][C]M9[/C][C]-13.6044063583265[/C][C]4.064238[/C][C]-3.3473[/C][C]0.001849[/C][C]0.000924[/C][/ROW]
[ROW][C]M10[/C][C]-9.75894265732346[/C][C]3.861444[/C][C]-2.5273[/C][C]0.015776[/C][C]0.007888[/C][/ROW]
[ROW][C]M11[/C][C]0.542826991949121[/C][C]2.913759[/C][C]0.1863[/C][C]0.853202[/C][C]0.426601[/C][/ROW]
[ROW][C]t[/C][C]0.118834153023582[/C][C]0.032118[/C][C]3.6999[/C][C]0.00068[/C][C]0.00034[/C][/ROW]
[/TABLE]
Source: https://freestatistics.org/blog/index.php?pk=67335&T=2

Globally Unique Identifier (entire table): ba.freestatistics.org/blog/index.php?pk=67335&T=2

As an alternative you can also use a QR Code:  

The GUIDs for individual cells are displayed in the table below:

Multiple Linear Regression - Ordinary Least Squares
VariableParameterS.D.T-STATH0: parameter = 02-tail p-value1-tail p-value
(Intercept)95.412886439690729.5715463.22650.002580.00129
`Y(t-1)`-0.3735220459423150.152926-2.44250.0193470.009674
`Y(t-2)`-0.07515933376370790.143199-0.52490.602730.301365
`Y(t-3)`0.358851701988080.133682.68440.0107060.005353
`Y(t-4)`-0.07881265085876180.140797-0.55980.5789270.289464
X0.2402115019673780.0837252.8690.0066880.003344
M1-2.867742719055532.432236-1.17910.2457060.122853
M2-1.329522809763872.729066-0.48720.6289360.314468
M3-14.21143238717442.997538-4.7413e-051.5e-05
M4-14.37462638668443.897917-3.68780.0007050.000352
M5-4.433788117191013.968807-1.11720.270940.13547
M611.53043566726722.959423.89620.0003840.000192
M72.779112006580213.3376150.83270.4102370.205119
M8-9.087661061437153.568795-2.54640.0150580.007529
M9-13.60440635832654.064238-3.34730.0018490.000924
M10-9.758942657323463.861444-2.52730.0157760.007888
M110.5428269919491212.9137590.18630.8532020.426601
t0.1188341530235820.0321183.69990.000680.00034


Multiple Linear Regression - Regression Statistics
Multiple R0.965222670470673
R-squared0.931654803590538
Adjusted R-squared0.901079320986305
F-TEST (value)30.4706491684797
F-TEST (DF numerator)17
F-TEST (DF denominator)38
p-value0
Multiple Linear Regression - Residual Statistics
Residual Standard Deviation2.53947701998751
Sum Squared Residuals245.059854331697

\begin{tabular}{lllllllll}
\hline
Multiple Linear Regression - Regression Statistics \tabularnewline
Multiple R & 0.965222670470673 \tabularnewline
R-squared & 0.931654803590538 \tabularnewline
Adjusted R-squared & 0.901079320986305 \tabularnewline
F-TEST (value) & 30.4706491684797 \tabularnewline
F-TEST (DF numerator) & 17 \tabularnewline
F-TEST (DF denominator) & 38 \tabularnewline
p-value & 0 \tabularnewline
Multiple Linear Regression - Residual Statistics \tabularnewline
Residual Standard Deviation & 2.53947701998751 \tabularnewline
Sum Squared Residuals & 245.059854331697 \tabularnewline
\hline
\end{tabular}
%Source: https://freestatistics.org/blog/index.php?pk=67335&T=3

[TABLE]
[ROW][C]Multiple Linear Regression - Regression Statistics[/C][/ROW]
[ROW][C]Multiple R[/C][C]0.965222670470673[/C][/ROW]
[ROW][C]R-squared[/C][C]0.931654803590538[/C][/ROW]
[ROW][C]Adjusted R-squared[/C][C]0.901079320986305[/C][/ROW]
[ROW][C]F-TEST (value)[/C][C]30.4706491684797[/C][/ROW]
[ROW][C]F-TEST (DF numerator)[/C][C]17[/C][/ROW]
[ROW][C]F-TEST (DF denominator)[/C][C]38[/C][/ROW]
[ROW][C]p-value[/C][C]0[/C][/ROW]
[ROW][C]Multiple Linear Regression - Residual Statistics[/C][/ROW]
[ROW][C]Residual Standard Deviation[/C][C]2.53947701998751[/C][/ROW]
[ROW][C]Sum Squared Residuals[/C][C]245.059854331697[/C][/ROW]
[/TABLE]
Source: https://freestatistics.org/blog/index.php?pk=67335&T=3

Globally Unique Identifier (entire table): ba.freestatistics.org/blog/index.php?pk=67335&T=3

As an alternative you can also use a QR Code:  

The GUIDs for individual cells are displayed in the table below:

Multiple Linear Regression - Regression Statistics
Multiple R0.965222670470673
R-squared0.931654803590538
Adjusted R-squared0.901079320986305
F-TEST (value)30.4706491684797
F-TEST (DF numerator)17
F-TEST (DF denominator)38
p-value0
Multiple Linear Regression - Residual Statistics
Residual Standard Deviation2.53947701998751
Sum Squared Residuals245.059854331697


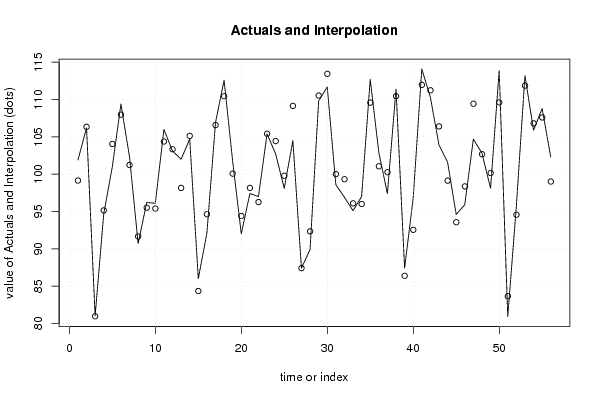
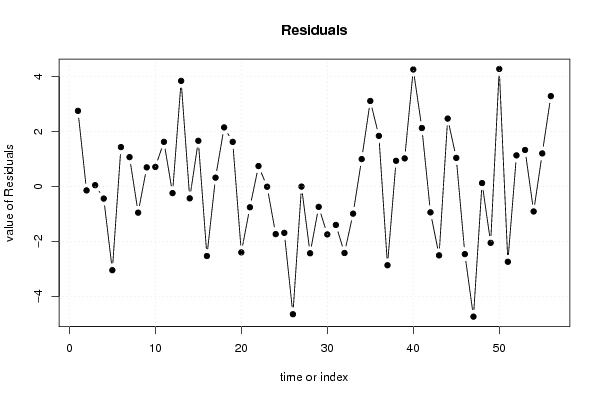
Multiple Linear Regression - Actuals, Interpolation, and Residuals
Time or IndexActualsInterpolationForecastResidualsPrediction Error
1101.999.14458607660642.75541392339363
2106.2106.340899427729-0.140899427728557
38180.94990375940680.0500962405931573
494.795.1379947253594-0.437994725359363
5101104.044869076007-3.04486907600714
6109.4107.9636267176161.43637328238427
7102.3101.2291686287921.07083137120781
890.791.6500207836738-0.950020783673838
996.295.50119264583350.698807354166547
1096.195.3853691200650.714630879934984
11106104.3730807901451.62691920985529
12103.1103.338815942237-0.238815942236608
1310298.15365873636783.84634126363217
14104.7105.129056291149-0.429056291148919
158684.33457838730831.66542161269171
1692.194.629248694579-2.52924869457905
17106.9106.5770113535100.322988646489924
18112.6110.4467634462972.15323655370333
19101.7100.0737285725391.62627142746112
209294.3969047553746-2.39690475537456
2197.498.1549173870111-0.754917387011089
229796.25433571712150.745664282878467
23105.4105.406101383728-0.0061013837281591
24102.7104.432742095278-1.73274209527785
2598.199.786373990274-1.68637399027409
26104.5109.148850144557-4.64885014455749
2787.487.4013665053923-0.00136650539228322
2889.992.3297343907367-2.42973439073671
29109.8110.540541534533-0.740541534533216
30111.7113.442799112715-1.74279911271466
3198.699.997500220777-1.39750022077703
3296.999.3194647107772-2.41946471077723
3395.196.0869555025472-0.986955502547245
349796.00066257399280.99933742600716
35112.7109.5841778497933.11582215020686
36102.9101.0557386853191.84426131468113
3797.4100.265841223737-2.8658412237372
38111.4110.4622883463650.937711653635157
3987.486.37563135215831.02436864784174
4096.892.53780539894544.26219460105456
41114.1111.9685371535272.13146284647340
42110.3111.239411449681-0.939411449681161
43103.9106.405362948800-2.50536294879989
44101.699.12563014235962.47436985764043
4594.693.55693446460821.04306553539179
4695.998.3596325888206-2.45963258882062
47104.7109.436639976334-4.73663997633399
48102.8102.6727032771670.127296722833328
4998.1100.149539973015-2.04953997301452
50113.9109.6189057902004.28109420979980
5180.983.6385199957343-2.73851999573432
5295.794.56521679037941.13478320962056
53113.2111.8690408824231.33095911757704
54105.9106.807399273692-0.907399273691782
55108.8107.5942396290921.20576037090798
56102.399.00797960781483.2920203921852

\begin{tabular}{lllllllll}
\hline
Multiple Linear Regression - Actuals, Interpolation, and Residuals \tabularnewline
Time or Index & Actuals & InterpolationForecast & ResidualsPrediction Error \tabularnewline
1 & 101.9 & 99.1445860766064 & 2.75541392339363 \tabularnewline
2 & 106.2 & 106.340899427729 & -0.140899427728557 \tabularnewline
3 & 81 & 80.9499037594068 & 0.0500962405931573 \tabularnewline
4 & 94.7 & 95.1379947253594 & -0.437994725359363 \tabularnewline
5 & 101 & 104.044869076007 & -3.04486907600714 \tabularnewline
6 & 109.4 & 107.963626717616 & 1.43637328238427 \tabularnewline
7 & 102.3 & 101.229168628792 & 1.07083137120781 \tabularnewline
8 & 90.7 & 91.6500207836738 & -0.950020783673838 \tabularnewline
9 & 96.2 & 95.5011926458335 & 0.698807354166547 \tabularnewline
10 & 96.1 & 95.385369120065 & 0.714630879934984 \tabularnewline
11 & 106 & 104.373080790145 & 1.62691920985529 \tabularnewline
12 & 103.1 & 103.338815942237 & -0.238815942236608 \tabularnewline
13 & 102 & 98.1536587363678 & 3.84634126363217 \tabularnewline
14 & 104.7 & 105.129056291149 & -0.429056291148919 \tabularnewline
15 & 86 & 84.3345783873083 & 1.66542161269171 \tabularnewline
16 & 92.1 & 94.629248694579 & -2.52924869457905 \tabularnewline
17 & 106.9 & 106.577011353510 & 0.322988646489924 \tabularnewline
18 & 112.6 & 110.446763446297 & 2.15323655370333 \tabularnewline
19 & 101.7 & 100.073728572539 & 1.62627142746112 \tabularnewline
20 & 92 & 94.3969047553746 & -2.39690475537456 \tabularnewline
21 & 97.4 & 98.1549173870111 & -0.754917387011089 \tabularnewline
22 & 97 & 96.2543357171215 & 0.745664282878467 \tabularnewline
23 & 105.4 & 105.406101383728 & -0.0061013837281591 \tabularnewline
24 & 102.7 & 104.432742095278 & -1.73274209527785 \tabularnewline
25 & 98.1 & 99.786373990274 & -1.68637399027409 \tabularnewline
26 & 104.5 & 109.148850144557 & -4.64885014455749 \tabularnewline
27 & 87.4 & 87.4013665053923 & -0.00136650539228322 \tabularnewline
28 & 89.9 & 92.3297343907367 & -2.42973439073671 \tabularnewline
29 & 109.8 & 110.540541534533 & -0.740541534533216 \tabularnewline
30 & 111.7 & 113.442799112715 & -1.74279911271466 \tabularnewline
31 & 98.6 & 99.997500220777 & -1.39750022077703 \tabularnewline
32 & 96.9 & 99.3194647107772 & -2.41946471077723 \tabularnewline
33 & 95.1 & 96.0869555025472 & -0.986955502547245 \tabularnewline
34 & 97 & 96.0006625739928 & 0.99933742600716 \tabularnewline
35 & 112.7 & 109.584177849793 & 3.11582215020686 \tabularnewline
36 & 102.9 & 101.055738685319 & 1.84426131468113 \tabularnewline
37 & 97.4 & 100.265841223737 & -2.8658412237372 \tabularnewline
38 & 111.4 & 110.462288346365 & 0.937711653635157 \tabularnewline
39 & 87.4 & 86.3756313521583 & 1.02436864784174 \tabularnewline
40 & 96.8 & 92.5378053989454 & 4.26219460105456 \tabularnewline
41 & 114.1 & 111.968537153527 & 2.13146284647340 \tabularnewline
42 & 110.3 & 111.239411449681 & -0.939411449681161 \tabularnewline
43 & 103.9 & 106.405362948800 & -2.50536294879989 \tabularnewline
44 & 101.6 & 99.1256301423596 & 2.47436985764043 \tabularnewline
45 & 94.6 & 93.5569344646082 & 1.04306553539179 \tabularnewline
46 & 95.9 & 98.3596325888206 & -2.45963258882062 \tabularnewline
47 & 104.7 & 109.436639976334 & -4.73663997633399 \tabularnewline
48 & 102.8 & 102.672703277167 & 0.127296722833328 \tabularnewline
49 & 98.1 & 100.149539973015 & -2.04953997301452 \tabularnewline
50 & 113.9 & 109.618905790200 & 4.28109420979980 \tabularnewline
51 & 80.9 & 83.6385199957343 & -2.73851999573432 \tabularnewline
52 & 95.7 & 94.5652167903794 & 1.13478320962056 \tabularnewline
53 & 113.2 & 111.869040882423 & 1.33095911757704 \tabularnewline
54 & 105.9 & 106.807399273692 & -0.907399273691782 \tabularnewline
55 & 108.8 & 107.594239629092 & 1.20576037090798 \tabularnewline
56 & 102.3 & 99.0079796078148 & 3.2920203921852 \tabularnewline
\hline
\end{tabular}
%Source: https://freestatistics.org/blog/index.php?pk=67335&T=4

[TABLE]
[ROW][C]Multiple Linear Regression - Actuals, Interpolation, and Residuals[/C][/ROW]
[ROW][C]Time or Index[/C][C]Actuals[/C][C]InterpolationForecast[/C][C]ResidualsPrediction Error[/C][/ROW]
[ROW][C]1[/C][C]101.9[/C][C]99.1445860766064[/C][C]2.75541392339363[/C][/ROW]
[ROW][C]2[/C][C]106.2[/C][C]106.340899427729[/C][C]-0.140899427728557[/C][/ROW]
[ROW][C]3[/C][C]81[/C][C]80.9499037594068[/C][C]0.0500962405931573[/C][/ROW]
[ROW][C]4[/C][C]94.7[/C][C]95.1379947253594[/C][C]-0.437994725359363[/C][/ROW]
[ROW][C]5[/C][C]101[/C][C]104.044869076007[/C][C]-3.04486907600714[/C][/ROW]
[ROW][C]6[/C][C]109.4[/C][C]107.963626717616[/C][C]1.43637328238427[/C][/ROW]
[ROW][C]7[/C][C]102.3[/C][C]101.229168628792[/C][C]1.07083137120781[/C][/ROW]
[ROW][C]8[/C][C]90.7[/C][C]91.6500207836738[/C][C]-0.950020783673838[/C][/ROW]
[ROW][C]9[/C][C]96.2[/C][C]95.5011926458335[/C][C]0.698807354166547[/C][/ROW]
[ROW][C]10[/C][C]96.1[/C][C]95.385369120065[/C][C]0.714630879934984[/C][/ROW]
[ROW][C]11[/C][C]106[/C][C]104.373080790145[/C][C]1.62691920985529[/C][/ROW]
[ROW][C]12[/C][C]103.1[/C][C]103.338815942237[/C][C]-0.238815942236608[/C][/ROW]
[ROW][C]13[/C][C]102[/C][C]98.1536587363678[/C][C]3.84634126363217[/C][/ROW]
[ROW][C]14[/C][C]104.7[/C][C]105.129056291149[/C][C]-0.429056291148919[/C][/ROW]
[ROW][C]15[/C][C]86[/C][C]84.3345783873083[/C][C]1.66542161269171[/C][/ROW]
[ROW][C]16[/C][C]92.1[/C][C]94.629248694579[/C][C]-2.52924869457905[/C][/ROW]
[ROW][C]17[/C][C]106.9[/C][C]106.577011353510[/C][C]0.322988646489924[/C][/ROW]
[ROW][C]18[/C][C]112.6[/C][C]110.446763446297[/C][C]2.15323655370333[/C][/ROW]
[ROW][C]19[/C][C]101.7[/C][C]100.073728572539[/C][C]1.62627142746112[/C][/ROW]
[ROW][C]20[/C][C]92[/C][C]94.3969047553746[/C][C]-2.39690475537456[/C][/ROW]
[ROW][C]21[/C][C]97.4[/C][C]98.1549173870111[/C][C]-0.754917387011089[/C][/ROW]
[ROW][C]22[/C][C]97[/C][C]96.2543357171215[/C][C]0.745664282878467[/C][/ROW]
[ROW][C]23[/C][C]105.4[/C][C]105.406101383728[/C][C]-0.0061013837281591[/C][/ROW]
[ROW][C]24[/C][C]102.7[/C][C]104.432742095278[/C][C]-1.73274209527785[/C][/ROW]
[ROW][C]25[/C][C]98.1[/C][C]99.786373990274[/C][C]-1.68637399027409[/C][/ROW]
[ROW][C]26[/C][C]104.5[/C][C]109.148850144557[/C][C]-4.64885014455749[/C][/ROW]
[ROW][C]27[/C][C]87.4[/C][C]87.4013665053923[/C][C]-0.00136650539228322[/C][/ROW]
[ROW][C]28[/C][C]89.9[/C][C]92.3297343907367[/C][C]-2.42973439073671[/C][/ROW]
[ROW][C]29[/C][C]109.8[/C][C]110.540541534533[/C][C]-0.740541534533216[/C][/ROW]
[ROW][C]30[/C][C]111.7[/C][C]113.442799112715[/C][C]-1.74279911271466[/C][/ROW]
[ROW][C]31[/C][C]98.6[/C][C]99.997500220777[/C][C]-1.39750022077703[/C][/ROW]
[ROW][C]32[/C][C]96.9[/C][C]99.3194647107772[/C][C]-2.41946471077723[/C][/ROW]
[ROW][C]33[/C][C]95.1[/C][C]96.0869555025472[/C][C]-0.986955502547245[/C][/ROW]
[ROW][C]34[/C][C]97[/C][C]96.0006625739928[/C][C]0.99933742600716[/C][/ROW]
[ROW][C]35[/C][C]112.7[/C][C]109.584177849793[/C][C]3.11582215020686[/C][/ROW]
[ROW][C]36[/C][C]102.9[/C][C]101.055738685319[/C][C]1.84426131468113[/C][/ROW]
[ROW][C]37[/C][C]97.4[/C][C]100.265841223737[/C][C]-2.8658412237372[/C][/ROW]
[ROW][C]38[/C][C]111.4[/C][C]110.462288346365[/C][C]0.937711653635157[/C][/ROW]
[ROW][C]39[/C][C]87.4[/C][C]86.3756313521583[/C][C]1.02436864784174[/C][/ROW]
[ROW][C]40[/C][C]96.8[/C][C]92.5378053989454[/C][C]4.26219460105456[/C][/ROW]
[ROW][C]41[/C][C]114.1[/C][C]111.968537153527[/C][C]2.13146284647340[/C][/ROW]
[ROW][C]42[/C][C]110.3[/C][C]111.239411449681[/C][C]-0.939411449681161[/C][/ROW]
[ROW][C]43[/C][C]103.9[/C][C]106.405362948800[/C][C]-2.50536294879989[/C][/ROW]
[ROW][C]44[/C][C]101.6[/C][C]99.1256301423596[/C][C]2.47436985764043[/C][/ROW]
[ROW][C]45[/C][C]94.6[/C][C]93.5569344646082[/C][C]1.04306553539179[/C][/ROW]
[ROW][C]46[/C][C]95.9[/C][C]98.3596325888206[/C][C]-2.45963258882062[/C][/ROW]
[ROW][C]47[/C][C]104.7[/C][C]109.436639976334[/C][C]-4.73663997633399[/C][/ROW]
[ROW][C]48[/C][C]102.8[/C][C]102.672703277167[/C][C]0.127296722833328[/C][/ROW]
[ROW][C]49[/C][C]98.1[/C][C]100.149539973015[/C][C]-2.04953997301452[/C][/ROW]
[ROW][C]50[/C][C]113.9[/C][C]109.618905790200[/C][C]4.28109420979980[/C][/ROW]
[ROW][C]51[/C][C]80.9[/C][C]83.6385199957343[/C][C]-2.73851999573432[/C][/ROW]
[ROW][C]52[/C][C]95.7[/C][C]94.5652167903794[/C][C]1.13478320962056[/C][/ROW]
[ROW][C]53[/C][C]113.2[/C][C]111.869040882423[/C][C]1.33095911757704[/C][/ROW]
[ROW][C]54[/C][C]105.9[/C][C]106.807399273692[/C][C]-0.907399273691782[/C][/ROW]
[ROW][C]55[/C][C]108.8[/C][C]107.594239629092[/C][C]1.20576037090798[/C][/ROW]
[ROW][C]56[/C][C]102.3[/C][C]99.0079796078148[/C][C]3.2920203921852[/C][/ROW]
[/TABLE]
Source: https://freestatistics.org/blog/index.php?pk=67335&T=4

Globally Unique Identifier (entire table): ba.freestatistics.org/blog/index.php?pk=67335&T=4

As an alternative you can also use a QR Code:  

The GUIDs for individual cells are displayed in the table below:

Multiple Linear Regression - Actuals, Interpolation, and Residuals
Time or IndexActualsInterpolationForecastResidualsPrediction Error
1101.999.14458607660642.75541392339363
2106.2106.340899427729-0.140899427728557
38180.94990375940680.0500962405931573
494.795.1379947253594-0.437994725359363
5101104.044869076007-3.04486907600714
6109.4107.9636267176161.43637328238427
7102.3101.2291686287921.07083137120781
890.791.6500207836738-0.950020783673838
996.295.50119264583350.698807354166547
1096.195.3853691200650.714630879934984
11106104.3730807901451.62691920985529
12103.1103.338815942237-0.238815942236608
1310298.15365873636783.84634126363217
14104.7105.129056291149-0.429056291148919
158684.33457838730831.66542161269171
1692.194.629248694579-2.52924869457905
17106.9106.5770113535100.322988646489924
18112.6110.4467634462972.15323655370333
19101.7100.0737285725391.62627142746112
209294.3969047553746-2.39690475537456
2197.498.1549173870111-0.754917387011089
229796.25433571712150.745664282878467
23105.4105.406101383728-0.0061013837281591
24102.7104.432742095278-1.73274209527785
2598.199.786373990274-1.68637399027409
26104.5109.148850144557-4.64885014455749
2787.487.4013665053923-0.00136650539228322
2889.992.3297343907367-2.42973439073671
29109.8110.540541534533-0.740541534533216
30111.7113.442799112715-1.74279911271466
3198.699.997500220777-1.39750022077703
3296.999.3194647107772-2.41946471077723
3395.196.0869555025472-0.986955502547245
349796.00066257399280.99933742600716
35112.7109.5841778497933.11582215020686
36102.9101.0557386853191.84426131468113
3797.4100.265841223737-2.8658412237372
38111.4110.4622883463650.937711653635157
3987.486.37563135215831.02436864784174
4096.892.53780539894544.26219460105456
41114.1111.9685371535272.13146284647340
42110.3111.239411449681-0.939411449681161
43103.9106.405362948800-2.50536294879989
44101.699.12563014235962.47436985764043
4594.693.55693446460821.04306553539179
4695.998.3596325888206-2.45963258882062
47104.7109.436639976334-4.73663997633399
48102.8102.6727032771670.127296722833328
4998.1100.149539973015-2.04953997301452
50113.9109.6189057902004.28109420979980
5180.983.6385199957343-2.73851999573432
5295.794.56521679037941.13478320962056
53113.2111.8690408824231.33095911757704
54105.9106.807399273692-0.907399273691782
55108.8107.5942396290921.20576037090798
56102.399.00797960781483.2920203921852


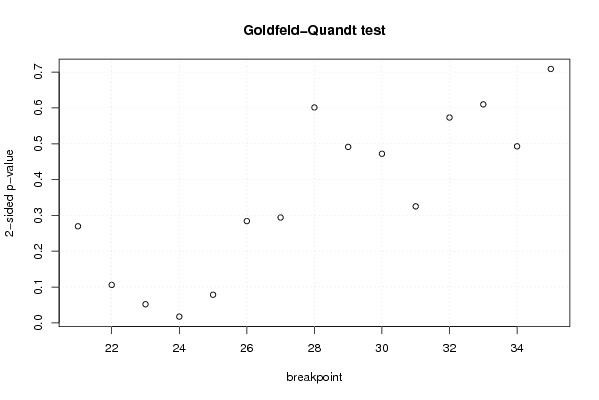
Goldfeld-Quandt test for Heteroskedasticity
p-valuesAlternative Hypothesis
breakpoint indexgreater2-sidedless
210.1348117668977390.2696235337954780.865188233102261
220.05301137407859810.1060227481571960.946988625921402
230.02599602793990080.05199205587980160.9740039720601
240.008691642706765870.01738328541353170.991308357293234
250.03927435553871860.07854871107743720.960725644461281
260.1420772641773000.2841545283546000.8579227358227
270.1470397879794510.2940795759589020.85296021202055
280.3006379840657270.6012759681314540.699362015934273
290.2456069926466740.4912139852933470.754393007353326
300.2360467785148180.4720935570296360.763953221485182
310.1626396014231310.3252792028462620.83736039857687
320.2866084291853010.5732168583706020.713391570814699
330.6950661131108580.6098677737782840.304933886889142
340.7535687505244160.4928624989511670.246431249475584
350.6455971823735990.7088056352528020.354402817626401

\begin{tabular}{lllllllll}
\hline
Goldfeld-Quandt test for Heteroskedasticity \tabularnewline
p-values & Alternative Hypothesis \tabularnewline
breakpoint index & greater & 2-sided & less \tabularnewline
21 & 0.134811766897739 & 0.269623533795478 & 0.865188233102261 \tabularnewline
22 & 0.0530113740785981 & 0.106022748157196 & 0.946988625921402 \tabularnewline
23 & 0.0259960279399008 & 0.0519920558798016 & 0.9740039720601 \tabularnewline
24 & 0.00869164270676587 & 0.0173832854135317 & 0.991308357293234 \tabularnewline
25 & 0.0392743555387186 & 0.0785487110774372 & 0.960725644461281 \tabularnewline
26 & 0.142077264177300 & 0.284154528354600 & 0.8579227358227 \tabularnewline
27 & 0.147039787979451 & 0.294079575958902 & 0.85296021202055 \tabularnewline
28 & 0.300637984065727 & 0.601275968131454 & 0.699362015934273 \tabularnewline
29 & 0.245606992646674 & 0.491213985293347 & 0.754393007353326 \tabularnewline
30 & 0.236046778514818 & 0.472093557029636 & 0.763953221485182 \tabularnewline
31 & 0.162639601423131 & 0.325279202846262 & 0.83736039857687 \tabularnewline
32 & 0.286608429185301 & 0.573216858370602 & 0.713391570814699 \tabularnewline
33 & 0.695066113110858 & 0.609867773778284 & 0.304933886889142 \tabularnewline
34 & 0.753568750524416 & 0.492862498951167 & 0.246431249475584 \tabularnewline
35 & 0.645597182373599 & 0.708805635252802 & 0.354402817626401 \tabularnewline
\hline
\end{tabular}
%Source: https://freestatistics.org/blog/index.php?pk=67335&T=5

[TABLE]
[ROW][C]Goldfeld-Quandt test for Heteroskedasticity[/C][/ROW]
[ROW][C]p-values[/C][C]Alternative Hypothesis[/C][/ROW]
[ROW][C]breakpoint index[/C][C]greater[/C][C]2-sided[/C][C]less[/C][/ROW]
[ROW][C]21[/C][C]0.134811766897739[/C][C]0.269623533795478[/C][C]0.865188233102261[/C][/ROW]
[ROW][C]22[/C][C]0.0530113740785981[/C][C]0.106022748157196[/C][C]0.946988625921402[/C][/ROW]
[ROW][C]23[/C][C]0.0259960279399008[/C][C]0.0519920558798016[/C][C]0.9740039720601[/C][/ROW]
[ROW][C]24[/C][C]0.00869164270676587[/C][C]0.0173832854135317[/C][C]0.991308357293234[/C][/ROW]
[ROW][C]25[/C][C]0.0392743555387186[/C][C]0.0785487110774372[/C][C]0.960725644461281[/C][/ROW]
[ROW][C]26[/C][C]0.142077264177300[/C][C]0.284154528354600[/C][C]0.8579227358227[/C][/ROW]
[ROW][C]27[/C][C]0.147039787979451[/C][C]0.294079575958902[/C][C]0.85296021202055[/C][/ROW]
[ROW][C]28[/C][C]0.300637984065727[/C][C]0.601275968131454[/C][C]0.699362015934273[/C][/ROW]
[ROW][C]29[/C][C]0.245606992646674[/C][C]0.491213985293347[/C][C]0.754393007353326[/C][/ROW]
[ROW][C]30[/C][C]0.236046778514818[/C][C]0.472093557029636[/C][C]0.763953221485182[/C][/ROW]
[ROW][C]31[/C][C]0.162639601423131[/C][C]0.325279202846262[/C][C]0.83736039857687[/C][/ROW]
[ROW][C]32[/C][C]0.286608429185301[/C][C]0.573216858370602[/C][C]0.713391570814699[/C][/ROW]
[ROW][C]33[/C][C]0.695066113110858[/C][C]0.609867773778284[/C][C]0.304933886889142[/C][/ROW]
[ROW][C]34[/C][C]0.753568750524416[/C][C]0.492862498951167[/C][C]0.246431249475584[/C][/ROW]
[ROW][C]35[/C][C]0.645597182373599[/C][C]0.708805635252802[/C][C]0.354402817626401[/C][/ROW]
[/TABLE]
Source: https://freestatistics.org/blog/index.php?pk=67335&T=5

Globally Unique Identifier (entire table): ba.freestatistics.org/blog/index.php?pk=67335&T=5

As an alternative you can also use a QR Code:  

The GUIDs for individual cells are displayed in the table below:

Goldfeld-Quandt test for Heteroskedasticity
p-valuesAlternative Hypothesis
breakpoint indexgreater2-sidedless
210.1348117668977390.2696235337954780.865188233102261
220.05301137407859810.1060227481571960.946988625921402
230.02599602793990080.05199205587980160.9740039720601
240.008691642706765870.01738328541353170.991308357293234
250.03927435553871860.07854871107743720.960725644461281
260.1420772641773000.2841545283546000.8579227358227
270.1470397879794510.2940795759589020.85296021202055
280.3006379840657270.6012759681314540.699362015934273
290.2456069926466740.4912139852933470.754393007353326
300.2360467785148180.4720935570296360.763953221485182
310.1626396014231310.3252792028462620.83736039857687
320.2866084291853010.5732168583706020.713391570814699
330.6950661131108580.6098677737782840.304933886889142
340.7535687505244160.4928624989511670.246431249475584
350.6455971823735990.7088056352528020.354402817626401


Meta Analysis of Goldfeld-Quandt test for Heteroskedasticity
Description# significant tests% significant testsOK/NOK
1% type I error level00OK
5% type I error level10.0666666666666667NOK
10% type I error level30.2NOK

\begin{tabular}{lllllllll}
\hline
Meta Analysis of Goldfeld-Quandt test for Heteroskedasticity \tabularnewline
Description & # significant tests & % significant tests & OK/NOK \tabularnewline
1% type I error level & 0 & 0 & OK \tabularnewline
5% type I error level & 1 & 0.0666666666666667 & NOK \tabularnewline
10% type I error level & 3 & 0.2 & NOK \tabularnewline
\hline
\end{tabular}
%Source: https://freestatistics.org/blog/index.php?pk=67335&T=6

[TABLE]
[ROW][C]Meta Analysis of Goldfeld-Quandt test for Heteroskedasticity[/C][/ROW]
[ROW][C]Description[/C][C]# significant tests[/C][C]% significant tests[/C][C]OK/NOK[/C][/ROW]
[ROW][C]1% type I error level[/C][C]0[/C][C]0[/C][C]OK[/C][/ROW]
[ROW][C]5% type I error level[/C][C]1[/C][C]0.0666666666666667[/C][C]NOK[/C][/ROW]
[ROW][C]10% type I error level[/C][C]3[/C][C]0.2[/C][C]NOK[/C][/ROW]
[/TABLE]
Source: https://freestatistics.org/blog/index.php?pk=67335&T=6

Globally Unique Identifier (entire table): ba.freestatistics.org/blog/index.php?pk=67335&T=6

As an alternative you can also use a QR Code:  

The GUIDs for individual cells are displayed in the table below:

Meta Analysis of Goldfeld-Quandt test for Heteroskedasticity
Description# significant tests% significant testsOK/NOK
1% type I error level00OK
5% type I error level10.0666666666666667NOK
10% type I error level30.2NOK


Parameters (Session):
par1 = 1 ; par2 = Include Monthly Dummies ; par3 = Linear Trend ;
Parameters (R input):
par1 = 1 ; par2 = Include Monthly Dummies ; par3 = Linear Trend ;
R code (references can be found in the software module):
library(lattice)
library(lmtest)
n25 <- 25 #minimum number of obs. for Goldfeld-Quandt test
par1 <- as.numeric(par1)
x <- t(y)
k <- length(x[1,])
n <- length(x[,1])
x1 <- cbind(x[,par1], x[,1:k!=par1])
mycolnames <- c(colnames(x)[par1], colnames(x)[1:k!=par1])
colnames(x1) <- mycolnames #colnames(x)[par1]
x <- x1
if (par3 == 'First Differences'){
x2 <- array(0, dim=c(n-1,k), dimnames=list(1:(n-1), paste('(1-B)',colnames(x),sep='')))
for (i in 1:n-1) {
for (j in 1:k) {
x2[i,j] <- x[i+1,j] - x[i,j]
}
}
x <- x2
}
if (par2 == 'Include Monthly Dummies'){
x2 <- array(0, dim=c(n,11), dimnames=list(1:n, paste('M', seq(1:11), sep ='')))
for (i in 1:11){
x2[seq(i,n,12),i] <- 1
}
x <- cbind(x, x2)
}
if (par2 == 'Include Quarterly Dummies'){
x2 <- array(0, dim=c(n,3), dimnames=list(1:n, paste('Q', seq(1:3), sep ='')))
for (i in 1:3){
x2[seq(i,n,4),i] <- 1
}
x <- cbind(x, x2)
}
k <- length(x[1,])
if (par3 == 'Linear Trend'){
x <- cbind(x, c(1:n))
colnames(x)[k+1] <- 't'
}
x
k <- length(x[1,])
df <- as.data.frame(x)
(mylm <- lm(df))
(mysum <- summary(mylm))
if (n > n25) {
kp3 <- k + 3
nmkm3 <- n - k - 3
gqarr <- array(NA, dim=c(nmkm3-kp3+1,3))
numgqtests <- 0
numsignificant1 <- 0
numsignificant5 <- 0
numsignificant10 <- 0
for (mypoint in kp3:nmkm3) {
j <- 0
numgqtests <- numgqtests + 1
for (myalt in c('greater', 'two.sided', 'less')) {
j <- j + 1
gqarr[mypoint-kp3+1,j] <- gqtest(mylm, point=mypoint, alternative=myalt)$p.value
}
if (gqarr[mypoint-kp3+1,2] < 0.01) numsignificant1 <- numsignificant1 + 1
if (gqarr[mypoint-kp3+1,2] < 0.05) numsignificant5 <- numsignificant5 + 1
if (gqarr[mypoint-kp3+1,2] < 0.10) numsignificant10 <- numsignificant10 + 1
}
gqarr
}
bitmap(file='test0.png')
plot(x[,1], type='l', main='Actuals and Interpolation', ylab='value of Actuals and Interpolation (dots)', xlab='time or index')
points(x[,1]-mysum$resid)
grid()
dev.off()
bitmap(file='test1.png')
plot(mysum$resid, type='b', pch=19, main='Residuals', ylab='value of Residuals', xlab='time or index')
grid()
dev.off()
bitmap(file='test2.png')
hist(mysum$resid, main='Residual Histogram', xlab='values of Residuals')
grid()
dev.off()
bitmap(file='test3.png')
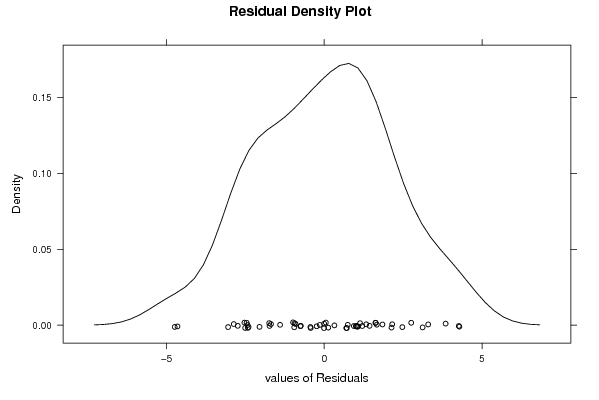
densityplot(~mysum$resid,col='black',main='Residual Density Plot', xlab='values of Residuals')
dev.off()
bitmap(file='test4.png')
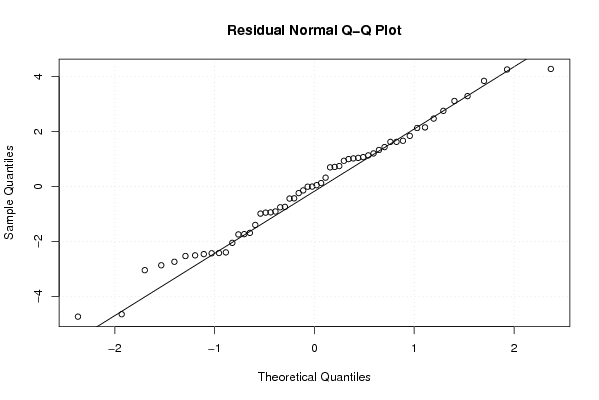
qqnorm(mysum$resid, main='Residual Normal Q-Q Plot')
qqline(mysum$resid)
grid()
dev.off()
(myerror <- as.ts(mysum$resid))
bitmap(file='test5.png')
dum <- cbind(lag(myerror,k=1),myerror)
dum
dum1 <- dum[2:length(myerror),]
dum1
z <- as.data.frame(dum1)
z
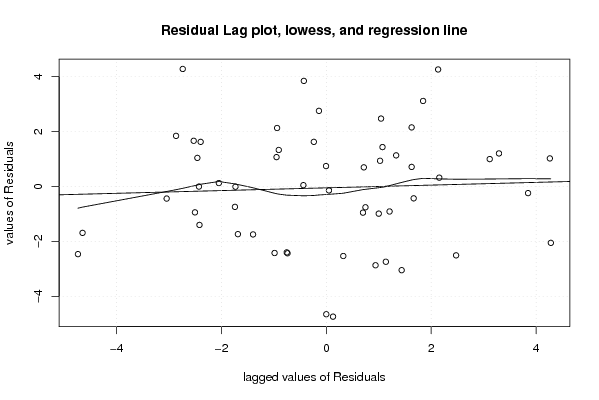
plot(z,main=paste('Residual Lag plot, lowess, and regression line'), ylab='values of Residuals', xlab='lagged values of Residuals')
lines(lowess(z))
abline(lm(z))
grid()
dev.off()
bitmap(file='test6.png')
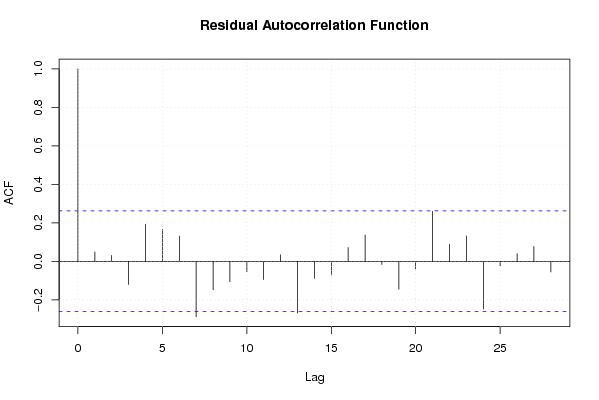
acf(mysum$resid, lag.max=length(mysum$resid)/2, main='Residual Autocorrelation Function')
grid()
dev.off()
bitmap(file='test7.png')
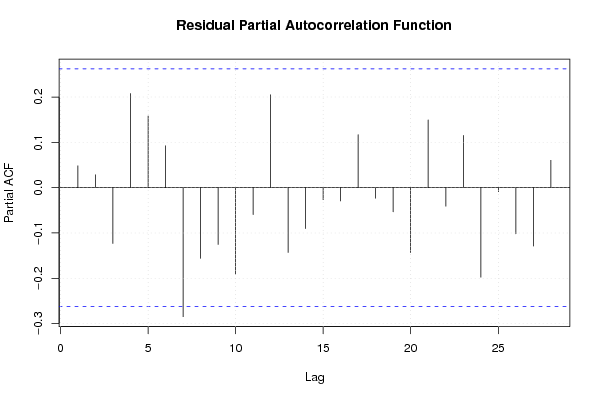
pacf(mysum$resid, lag.max=length(mysum$resid)/2, main='Residual Partial Autocorrelation Function')
grid()
dev.off()
bitmap(file='test8.png')
opar <- par(mfrow = c(2,2), oma = c(0, 0, 1.1, 0))
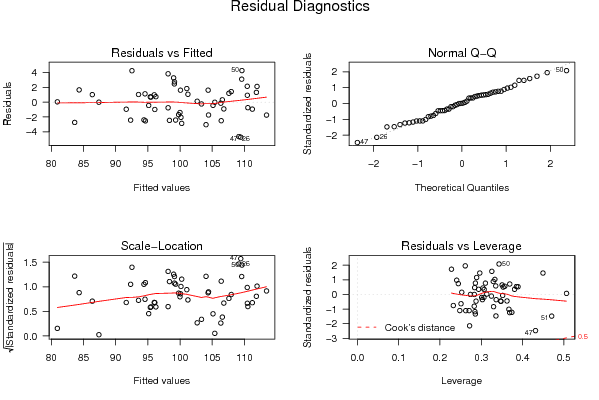
plot(mylm, las = 1, sub='Residual Diagnostics')
par(opar)
dev.off()
if (n > n25) {
bitmap(file='test9.png')
plot(kp3:nmkm3,gqarr[,2], main='Goldfeld-Quandt test',ylab='2-sided p-value',xlab='breakpoint')
grid()
dev.off()
}
load(file='createtable')
a<-table.start()
a<-table.row.start(a)
a<-table.element(a, 'Multiple Linear Regression - Estimated Regression Equation', 1, TRUE)
a<-table.row.end(a)
myeq <- colnames(x)[1]
myeq <- paste(myeq, '[t] = ', sep='')
for (i in 1:k){
if (mysum$coefficients[i,1] > 0) myeq <- paste(myeq, '+', '')
myeq <- paste(myeq, mysum$coefficients[i,1], sep=' ')
if (rownames(mysum$coefficients)[i] != '(Intercept)') {
myeq <- paste(myeq, rownames(mysum$coefficients)[i], sep='')
if (rownames(mysum$coefficients)[i] != 't') myeq <- paste(myeq, '[t]', sep='')
}
}
myeq <- paste(myeq, ' + e[t]')
a<-table.row.start(a)
a<-table.element(a, myeq)
a<-table.row.end(a)
a<-table.end(a)
table.save(a,file='mytable1.tab')
a<-table.start()
a<-table.row.start(a)
a<-table.element(a,hyperlink('ols1.htm','Multiple Linear Regression - Ordinary Least Squares',''), 6, TRUE)
a<-table.row.end(a)
a<-table.row.start(a)
a<-table.element(a,'Variable',header=TRUE)
a<-table.element(a,'Parameter',header=TRUE)
a<-table.element(a,'S.D.',header=TRUE)
a<-table.element(a,'T-STAT
H0: parameter = 0',header=TRUE)
a<-table.element(a,'2-tail p-value',header=TRUE)
a<-table.element(a,'1-tail p-value',header=TRUE)
a<-table.row.end(a)
for (i in 1:k){
a<-table.row.start(a)
a<-table.element(a,rownames(mysum$coefficients)[i],header=TRUE)
a<-table.element(a,mysum$coefficients[i,1])
a<-table.element(a, round(mysum$coefficients[i,2],6))
a<-table.element(a, round(mysum$coefficients[i,3],4))
a<-table.element(a, round(mysum$coefficients[i,4],6))
a<-table.element(a, round(mysum$coefficients[i,4]/2,6))
a<-table.row.end(a)
}
a<-table.end(a)
table.save(a,file='mytable2.tab')
a<-table.start()
a<-table.row.start(a)
a<-table.element(a, 'Multiple Linear Regression - Regression Statistics', 2, TRUE)
a<-table.row.end(a)
a<-table.row.start(a)
a<-table.element(a, 'Multiple R',1,TRUE)
a<-table.element(a, sqrt(mysum$r.squared))
a<-table.row.end(a)
a<-table.row.start(a)
a<-table.element(a, 'R-squared',1,TRUE)
a<-table.element(a, mysum$r.squared)
a<-table.row.end(a)
a<-table.row.start(a)
a<-table.element(a, 'Adjusted R-squared',1,TRUE)
a<-table.element(a, mysum$adj.r.squared)
a<-table.row.end(a)
a<-table.row.start(a)
a<-table.element(a, 'F-TEST (value)',1,TRUE)
a<-table.element(a, mysum$fstatistic[1])
a<-table.row.end(a)
a<-table.row.start(a)
a<-table.element(a, 'F-TEST (DF numerator)',1,TRUE)
a<-table.element(a, mysum$fstatistic[2])
a<-table.row.end(a)
a<-table.row.start(a)
a<-table.element(a, 'F-TEST (DF denominator)',1,TRUE)
a<-table.element(a, mysum$fstatistic[3])
a<-table.row.end(a)
a<-table.row.start(a)
a<-table.element(a, 'p-value',1,TRUE)
a<-table.element(a, 1-pf(mysum$fstatistic[1],mysum$fstatistic[2],mysum$fstatistic[3]))
a<-table.row.end(a)
a<-table.row.start(a)
a<-table.element(a, 'Multiple Linear Regression - Residual Statistics', 2, TRUE)
a<-table.row.end(a)
a<-table.row.start(a)
a<-table.element(a, 'Residual Standard Deviation',1,TRUE)
a<-table.element(a, mysum$sigma)
a<-table.row.end(a)
a<-table.row.start(a)
a<-table.element(a, 'Sum Squared Residuals',1,TRUE)
a<-table.element(a, sum(myerror*myerror))
a<-table.row.end(a)
a<-table.end(a)
table.save(a,file='mytable3.tab')
a<-table.start()
a<-table.row.start(a)
a<-table.element(a, 'Multiple Linear Regression - Actuals, Interpolation, and Residuals', 4, TRUE)
a<-table.row.end(a)
a<-table.row.start(a)
a<-table.element(a, 'Time or Index', 1, TRUE)
a<-table.element(a, 'Actuals', 1, TRUE)
a<-table.element(a, 'Interpolation
Forecast', 1, TRUE)
a<-table.element(a, 'Residuals
Prediction Error', 1, TRUE)
a<-table.row.end(a)
for (i in 1:n) {
a<-table.row.start(a)
a<-table.element(a,i, 1, TRUE)
a<-table.element(a,x[i])
a<-table.element(a,x[i]-mysum$resid[i])
a<-table.element(a,mysum$resid[i])
a<-table.row.end(a)
}
a<-table.end(a)
table.save(a,file='mytable4.tab')
if (n > n25) {
a<-table.start()
a<-table.row.start(a)
a<-table.element(a,'Goldfeld-Quandt test for Heteroskedasticity',4,TRUE)
a<-table.row.end(a)
a<-table.row.start(a)
a<-table.element(a,'p-values',header=TRUE)
a<-table.element(a,'Alternative Hypothesis',3,header=TRUE)
a<-table.row.end(a)
a<-table.row.start(a)
a<-table.element(a,'breakpoint index',header=TRUE)
a<-table.element(a,'greater',header=TRUE)
a<-table.element(a,'2-sided',header=TRUE)
a<-table.element(a,'less',header=TRUE)
a<-table.row.end(a)
for (mypoint in kp3:nmkm3) {
a<-table.row.start(a)
a<-table.element(a,mypoint,header=TRUE)
a<-table.element(a,gqarr[mypoint-kp3+1,1])
a<-table.element(a,gqarr[mypoint-kp3+1,2])
a<-table.element(a,gqarr[mypoint-kp3+1,3])
a<-table.row.end(a)
}
a<-table.end(a)
table.save(a,file='mytable5.tab')
a<-table.start()
a<-table.row.start(a)
a<-table.element(a,'Meta Analysis of Goldfeld-Quandt test for Heteroskedasticity',4,TRUE)
a<-table.row.end(a)
a<-table.row.start(a)
a<-table.element(a,'Description',header=TRUE)
a<-table.element(a,'# significant tests',header=TRUE)
a<-table.element(a,'% significant tests',header=TRUE)
a<-table.element(a,'OK/NOK',header=TRUE)
a<-table.row.end(a)
a<-table.row.start(a)
a<-table.element(a,'1% type I error level',header=TRUE)
a<-table.element(a,numsignificant1)
a<-table.element(a,numsignificant1/numgqtests)
if (numsignificant1/numgqtests < 0.01) dum <- 'OK' else dum <- 'NOK'
a<-table.element(a,dum)
a<-table.row.end(a)
a<-table.row.start(a)
a<-table.element(a,'5% type I error level',header=TRUE)
a<-table.element(a,numsignificant5)
a<-table.element(a,numsignificant5/numgqtests)
if (numsignificant5/numgqtests < 0.05) dum <- 'OK' else dum <- 'NOK'
a<-table.element(a,dum)
a<-table.row.end(a)
a<-table.row.start(a)
a<-table.element(a,'10% type I error level',header=TRUE)
a<-table.element(a,numsignificant10)
a<-table.element(a,numsignificant10/numgqtests)
if (numsignificant10/numgqtests < 0.1) dum <- 'OK' else dum <- 'NOK'
a<-table.element(a,dum)
a<-table.row.end(a)
a<-table.end(a)
table.save(a,file='mytable6.tab')
}