Free Statistics

of Irreproducible Research!

Author's title

Author*The author of this computation has been verified*
R Software Modulerwasp_autocorrelation.wasp
Title produced by software(Partial) Autocorrelation Function
Date of computationSun, 13 Dec 2009 08:49:55 -0700
Cite this page as followsStatistical Computations at FreeStatistics.org, Office for Research Development and Education, URL https://freestatistics.org/blog/index.php?v=date/2009/Dec/13/t12607195563cgsnz39sv935q2.htm/, Retrieved Sat, 27 Apr 2024 16:46:49 +0000
Statistical Computations at FreeStatistics.org, Office for Research Development and Education, URL https://freestatistics.org/blog/index.php?pk=67343, Retrieved Sat, 27 Apr 2024 16:46:49 +0000
QR Codes:

Original text written by user:
IsPrivate?No (this computation is public)
User-defined keywords
Estimated Impact109
Family? (F = Feedback message, R = changed R code, M = changed R Module, P = changed Parameters, D = changed Data)
-       [(Partial) Autocorrelation Function] [Bruto Industriële...] [2009-12-13 15:49:55] [efdfe680cd785c4af09f858b30f777ec] [Current]
Feedback Forum

Post a new message
Dataseries X:
98.8
100.5
110.4
96.4
101.9
106.2
81
94.7
101
109.4
102.3
90.7
96.2
96.1
106
103.1
102
104.7
86
92.1
106.9
112.6
101.7
92
97.4
97
105.4
102.7
98.1
104.5
87.4
89.9
109.8
111.7
98.6
96.9
95.1
97
112.7
102.9
97.4
111.4
87.4
96.8
114.1
110.3
103.9
101.6
94.6
95.9
104.7
102.8
98.1
113.9
80.9
95.7
113.2
105.9
108.8
102.3
99
100.7
115.5
100.7
109.9
114.6
85.4
100.5
114.8
116.5
112.9
102
106
105.3
118.8
106.1
109.3
117.2
92.5
104.2
112.5
122.4
113.3
100
110.7
112.8
109.8
117.3
109.1
115.9
96
99.8
116.8
115.7
99.4
94.3
91
93.2
103.1
94.1
91.8
102.7
82.6
89.1
104.5


Summary of computational transaction
Raw Inputview raw input (R code)
Raw Outputview raw output of R engine
Computing time10 seconds
R Server'Gwilym Jenkins' @ 72.249.127.135

\begin{tabular}{lllllllll}
\hline
Summary of computational transaction \tabularnewline
Raw Input & view raw input (R code)  \tabularnewline
Raw Output & view raw output of R engine  \tabularnewline
Computing time & 10 seconds \tabularnewline
R Server & 'Gwilym Jenkins' @ 72.249.127.135 \tabularnewline
\hline
\end{tabular}
%Source: https://freestatistics.org/blog/index.php?pk=67343&T=0

[TABLE]
[ROW][C]Summary of computational transaction[/C][/ROW]
[ROW][C]Raw Input[/C][C]view raw input (R code) [/C][/ROW]
[ROW][C]Raw Output[/C][C]view raw output of R engine [/C][/ROW]
[ROW][C]Computing time[/C][C]10 seconds[/C][/ROW]
[ROW][C]R Server[/C][C]'Gwilym Jenkins' @ 72.249.127.135[/C][/ROW]
[/TABLE]
Source: https://freestatistics.org/blog/index.php?pk=67343&T=0

Globally Unique Identifier (entire table): ba.freestatistics.org/blog/index.php?pk=67343&T=0

As an alternative you can also use a QR Code:  

The GUIDs for individual cells are displayed in the table below:

Summary of computational transaction
Raw Inputview raw input (R code)
Raw Outputview raw output of R engine
Computing time10 seconds
R Server'Gwilym Jenkins' @ 72.249.127.135


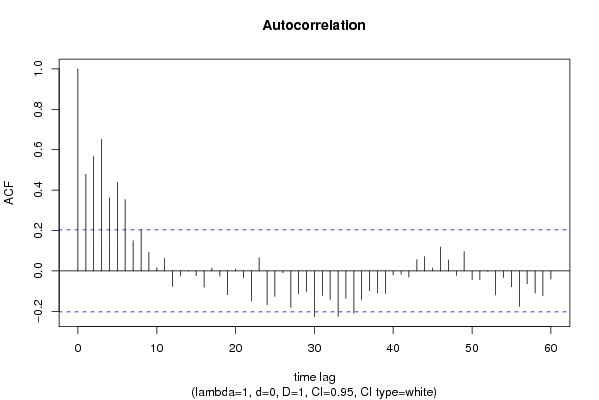
Autocorrelation Function
Time lag kACF(k)T-STATP-value
10.478154.61116e-06
20.567075.46860
30.6515716.28350
40.3618113.48920.000371
50.4368614.21292.9e-05
60.353063.40480.000489
70.149871.44530.075869
80.2047691.97470.025633
90.0923760.89080.187655
100.0165580.15970.43674
110.0619170.59710.275945
12-0.076947-0.74210.229963
13-0.025339-0.24440.403744
14-0.001136-0.0110.495642
15-0.023591-0.22750.410266
16-0.080718-0.77840.219151
170.0133370.12860.44897
18-0.025236-0.24340.404128
19-0.117489-1.1330.130059
200.0095580.09220.463378
21-0.033382-0.32190.374117
22-0.148727-1.43430.077425
230.0651060.62790.265817
24-0.167716-1.61740.05459
25-0.125614-1.21140.11441
26-0.009594-0.09250.463242
27-0.18144-1.74970.041731
28-0.113434-1.09390.138408
29-0.102241-0.9860.16335
30-0.226376-2.18310.015773
31-0.121069-1.16750.122987
32-0.140998-1.35970.088601
33-0.22446-2.16460.016489
34-0.135841-1.310.096711
35-0.209799-2.02320.02296
36-0.143728-1.38610.084521
37-0.097944-0.94450.17367
38-0.108659-1.04790.148707
39-0.111289-1.07320.142973
40-0.019913-0.1920.424069
41-0.015867-0.1530.43936
42-0.030214-0.29140.385708
430.0555620.53580.296681
440.0707550.68230.24836
450.014420.13910.444852
460.118781.14550.127477
470.054320.52380.300818
48-0.022482-0.21680.414416
490.0955240.92120.179666
50-0.043679-0.42120.337281
51-0.042921-0.41390.339945
52-0.002262-0.02180.491321
53-0.118688-1.14460.12766
54-0.032839-0.31670.376094
55-0.078841-0.76030.224496
56-0.175212-1.68970.04722
57-0.063788-0.61520.269978
58-0.109382-1.05480.147115
59-0.123209-1.18820.118892
60-0.040013-0.38590.350238

\begin{tabular}{lllllllll}
\hline
Autocorrelation Function \tabularnewline
Time lag k & ACF(k) & T-STAT & P-value \tabularnewline
1 & 0.47815 & 4.6111 & 6e-06 \tabularnewline
2 & 0.56707 & 5.4686 & 0 \tabularnewline
3 & 0.651571 & 6.2835 & 0 \tabularnewline
4 & 0.361811 & 3.4892 & 0.000371 \tabularnewline
5 & 0.436861 & 4.2129 & 2.9e-05 \tabularnewline
6 & 0.35306 & 3.4048 & 0.000489 \tabularnewline
7 & 0.14987 & 1.4453 & 0.075869 \tabularnewline
8 & 0.204769 & 1.9747 & 0.025633 \tabularnewline
9 & 0.092376 & 0.8908 & 0.187655 \tabularnewline
10 & 0.016558 & 0.1597 & 0.43674 \tabularnewline
11 & 0.061917 & 0.5971 & 0.275945 \tabularnewline
12 & -0.076947 & -0.7421 & 0.229963 \tabularnewline
13 & -0.025339 & -0.2444 & 0.403744 \tabularnewline
14 & -0.001136 & -0.011 & 0.495642 \tabularnewline
15 & -0.023591 & -0.2275 & 0.410266 \tabularnewline
16 & -0.080718 & -0.7784 & 0.219151 \tabularnewline
17 & 0.013337 & 0.1286 & 0.44897 \tabularnewline
18 & -0.025236 & -0.2434 & 0.404128 \tabularnewline
19 & -0.117489 & -1.133 & 0.130059 \tabularnewline
20 & 0.009558 & 0.0922 & 0.463378 \tabularnewline
21 & -0.033382 & -0.3219 & 0.374117 \tabularnewline
22 & -0.148727 & -1.4343 & 0.077425 \tabularnewline
23 & 0.065106 & 0.6279 & 0.265817 \tabularnewline
24 & -0.167716 & -1.6174 & 0.05459 \tabularnewline
25 & -0.125614 & -1.2114 & 0.11441 \tabularnewline
26 & -0.009594 & -0.0925 & 0.463242 \tabularnewline
27 & -0.18144 & -1.7497 & 0.041731 \tabularnewline
28 & -0.113434 & -1.0939 & 0.138408 \tabularnewline
29 & -0.102241 & -0.986 & 0.16335 \tabularnewline
30 & -0.226376 & -2.1831 & 0.015773 \tabularnewline
31 & -0.121069 & -1.1675 & 0.122987 \tabularnewline
32 & -0.140998 & -1.3597 & 0.088601 \tabularnewline
33 & -0.22446 & -2.1646 & 0.016489 \tabularnewline
34 & -0.135841 & -1.31 & 0.096711 \tabularnewline
35 & -0.209799 & -2.0232 & 0.02296 \tabularnewline
36 & -0.143728 & -1.3861 & 0.084521 \tabularnewline
37 & -0.097944 & -0.9445 & 0.17367 \tabularnewline
38 & -0.108659 & -1.0479 & 0.148707 \tabularnewline
39 & -0.111289 & -1.0732 & 0.142973 \tabularnewline
40 & -0.019913 & -0.192 & 0.424069 \tabularnewline
41 & -0.015867 & -0.153 & 0.43936 \tabularnewline
42 & -0.030214 & -0.2914 & 0.385708 \tabularnewline
43 & 0.055562 & 0.5358 & 0.296681 \tabularnewline
44 & 0.070755 & 0.6823 & 0.24836 \tabularnewline
45 & 0.01442 & 0.1391 & 0.444852 \tabularnewline
46 & 0.11878 & 1.1455 & 0.127477 \tabularnewline
47 & 0.05432 & 0.5238 & 0.300818 \tabularnewline
48 & -0.022482 & -0.2168 & 0.414416 \tabularnewline
49 & 0.095524 & 0.9212 & 0.179666 \tabularnewline
50 & -0.043679 & -0.4212 & 0.337281 \tabularnewline
51 & -0.042921 & -0.4139 & 0.339945 \tabularnewline
52 & -0.002262 & -0.0218 & 0.491321 \tabularnewline
53 & -0.118688 & -1.1446 & 0.12766 \tabularnewline
54 & -0.032839 & -0.3167 & 0.376094 \tabularnewline
55 & -0.078841 & -0.7603 & 0.224496 \tabularnewline
56 & -0.175212 & -1.6897 & 0.04722 \tabularnewline
57 & -0.063788 & -0.6152 & 0.269978 \tabularnewline
58 & -0.109382 & -1.0548 & 0.147115 \tabularnewline
59 & -0.123209 & -1.1882 & 0.118892 \tabularnewline
60 & -0.040013 & -0.3859 & 0.350238 \tabularnewline
\hline
\end{tabular}
%Source: https://freestatistics.org/blog/index.php?pk=67343&T=1

[TABLE]
[ROW][C]Autocorrelation Function[/C][/ROW]
[ROW][C]Time lag k[/C][C]ACF(k)[/C][C]T-STAT[/C][C]P-value[/C][/ROW]
[ROW][C]1[/C][C]0.47815[/C][C]4.6111[/C][C]6e-06[/C][/ROW]
[ROW][C]2[/C][C]0.56707[/C][C]5.4686[/C][C]0[/C][/ROW]
[ROW][C]3[/C][C]0.651571[/C][C]6.2835[/C][C]0[/C][/ROW]
[ROW][C]4[/C][C]0.361811[/C][C]3.4892[/C][C]0.000371[/C][/ROW]
[ROW][C]5[/C][C]0.436861[/C][C]4.2129[/C][C]2.9e-05[/C][/ROW]
[ROW][C]6[/C][C]0.35306[/C][C]3.4048[/C][C]0.000489[/C][/ROW]
[ROW][C]7[/C][C]0.14987[/C][C]1.4453[/C][C]0.075869[/C][/ROW]
[ROW][C]8[/C][C]0.204769[/C][C]1.9747[/C][C]0.025633[/C][/ROW]
[ROW][C]9[/C][C]0.092376[/C][C]0.8908[/C][C]0.187655[/C][/ROW]
[ROW][C]10[/C][C]0.016558[/C][C]0.1597[/C][C]0.43674[/C][/ROW]
[ROW][C]11[/C][C]0.061917[/C][C]0.5971[/C][C]0.275945[/C][/ROW]
[ROW][C]12[/C][C]-0.076947[/C][C]-0.7421[/C][C]0.229963[/C][/ROW]
[ROW][C]13[/C][C]-0.025339[/C][C]-0.2444[/C][C]0.403744[/C][/ROW]
[ROW][C]14[/C][C]-0.001136[/C][C]-0.011[/C][C]0.495642[/C][/ROW]
[ROW][C]15[/C][C]-0.023591[/C][C]-0.2275[/C][C]0.410266[/C][/ROW]
[ROW][C]16[/C][C]-0.080718[/C][C]-0.7784[/C][C]0.219151[/C][/ROW]
[ROW][C]17[/C][C]0.013337[/C][C]0.1286[/C][C]0.44897[/C][/ROW]
[ROW][C]18[/C][C]-0.025236[/C][C]-0.2434[/C][C]0.404128[/C][/ROW]
[ROW][C]19[/C][C]-0.117489[/C][C]-1.133[/C][C]0.130059[/C][/ROW]
[ROW][C]20[/C][C]0.009558[/C][C]0.0922[/C][C]0.463378[/C][/ROW]
[ROW][C]21[/C][C]-0.033382[/C][C]-0.3219[/C][C]0.374117[/C][/ROW]
[ROW][C]22[/C][C]-0.148727[/C][C]-1.4343[/C][C]0.077425[/C][/ROW]
[ROW][C]23[/C][C]0.065106[/C][C]0.6279[/C][C]0.265817[/C][/ROW]
[ROW][C]24[/C][C]-0.167716[/C][C]-1.6174[/C][C]0.05459[/C][/ROW]
[ROW][C]25[/C][C]-0.125614[/C][C]-1.2114[/C][C]0.11441[/C][/ROW]
[ROW][C]26[/C][C]-0.009594[/C][C]-0.0925[/C][C]0.463242[/C][/ROW]
[ROW][C]27[/C][C]-0.18144[/C][C]-1.7497[/C][C]0.041731[/C][/ROW]
[ROW][C]28[/C][C]-0.113434[/C][C]-1.0939[/C][C]0.138408[/C][/ROW]
[ROW][C]29[/C][C]-0.102241[/C][C]-0.986[/C][C]0.16335[/C][/ROW]
[ROW][C]30[/C][C]-0.226376[/C][C]-2.1831[/C][C]0.015773[/C][/ROW]
[ROW][C]31[/C][C]-0.121069[/C][C]-1.1675[/C][C]0.122987[/C][/ROW]
[ROW][C]32[/C][C]-0.140998[/C][C]-1.3597[/C][C]0.088601[/C][/ROW]
[ROW][C]33[/C][C]-0.22446[/C][C]-2.1646[/C][C]0.016489[/C][/ROW]
[ROW][C]34[/C][C]-0.135841[/C][C]-1.31[/C][C]0.096711[/C][/ROW]
[ROW][C]35[/C][C]-0.209799[/C][C]-2.0232[/C][C]0.02296[/C][/ROW]
[ROW][C]36[/C][C]-0.143728[/C][C]-1.3861[/C][C]0.084521[/C][/ROW]
[ROW][C]37[/C][C]-0.097944[/C][C]-0.9445[/C][C]0.17367[/C][/ROW]
[ROW][C]38[/C][C]-0.108659[/C][C]-1.0479[/C][C]0.148707[/C][/ROW]
[ROW][C]39[/C][C]-0.111289[/C][C]-1.0732[/C][C]0.142973[/C][/ROW]
[ROW][C]40[/C][C]-0.019913[/C][C]-0.192[/C][C]0.424069[/C][/ROW]
[ROW][C]41[/C][C]-0.015867[/C][C]-0.153[/C][C]0.43936[/C][/ROW]
[ROW][C]42[/C][C]-0.030214[/C][C]-0.2914[/C][C]0.385708[/C][/ROW]
[ROW][C]43[/C][C]0.055562[/C][C]0.5358[/C][C]0.296681[/C][/ROW]
[ROW][C]44[/C][C]0.070755[/C][C]0.6823[/C][C]0.24836[/C][/ROW]
[ROW][C]45[/C][C]0.01442[/C][C]0.1391[/C][C]0.444852[/C][/ROW]
[ROW][C]46[/C][C]0.11878[/C][C]1.1455[/C][C]0.127477[/C][/ROW]
[ROW][C]47[/C][C]0.05432[/C][C]0.5238[/C][C]0.300818[/C][/ROW]
[ROW][C]48[/C][C]-0.022482[/C][C]-0.2168[/C][C]0.414416[/C][/ROW]
[ROW][C]49[/C][C]0.095524[/C][C]0.9212[/C][C]0.179666[/C][/ROW]
[ROW][C]50[/C][C]-0.043679[/C][C]-0.4212[/C][C]0.337281[/C][/ROW]
[ROW][C]51[/C][C]-0.042921[/C][C]-0.4139[/C][C]0.339945[/C][/ROW]
[ROW][C]52[/C][C]-0.002262[/C][C]-0.0218[/C][C]0.491321[/C][/ROW]
[ROW][C]53[/C][C]-0.118688[/C][C]-1.1446[/C][C]0.12766[/C][/ROW]
[ROW][C]54[/C][C]-0.032839[/C][C]-0.3167[/C][C]0.376094[/C][/ROW]
[ROW][C]55[/C][C]-0.078841[/C][C]-0.7603[/C][C]0.224496[/C][/ROW]
[ROW][C]56[/C][C]-0.175212[/C][C]-1.6897[/C][C]0.04722[/C][/ROW]
[ROW][C]57[/C][C]-0.063788[/C][C]-0.6152[/C][C]0.269978[/C][/ROW]
[ROW][C]58[/C][C]-0.109382[/C][C]-1.0548[/C][C]0.147115[/C][/ROW]
[ROW][C]59[/C][C]-0.123209[/C][C]-1.1882[/C][C]0.118892[/C][/ROW]
[ROW][C]60[/C][C]-0.040013[/C][C]-0.3859[/C][C]0.350238[/C][/ROW]
[/TABLE]
Source: https://freestatistics.org/blog/index.php?pk=67343&T=1

Globally Unique Identifier (entire table): ba.freestatistics.org/blog/index.php?pk=67343&T=1

As an alternative you can also use a QR Code:  

The GUIDs for individual cells are displayed in the table below:

Autocorrelation Function
Time lag kACF(k)T-STATP-value
10.478154.61116e-06
20.567075.46860
30.6515716.28350
40.3618113.48920.000371
50.4368614.21292.9e-05
60.353063.40480.000489
70.149871.44530.075869
80.2047691.97470.025633
90.0923760.89080.187655
100.0165580.15970.43674
110.0619170.59710.275945
12-0.076947-0.74210.229963
13-0.025339-0.24440.403744
14-0.001136-0.0110.495642
15-0.023591-0.22750.410266
16-0.080718-0.77840.219151
170.0133370.12860.44897
18-0.025236-0.24340.404128
19-0.117489-1.1330.130059
200.0095580.09220.463378
21-0.033382-0.32190.374117
22-0.148727-1.43430.077425
230.0651060.62790.265817
24-0.167716-1.61740.05459
25-0.125614-1.21140.11441
26-0.009594-0.09250.463242
27-0.18144-1.74970.041731
28-0.113434-1.09390.138408
29-0.102241-0.9860.16335
30-0.226376-2.18310.015773
31-0.121069-1.16750.122987
32-0.140998-1.35970.088601
33-0.22446-2.16460.016489
34-0.135841-1.310.096711
35-0.209799-2.02320.02296
36-0.143728-1.38610.084521
37-0.097944-0.94450.17367
38-0.108659-1.04790.148707
39-0.111289-1.07320.142973
40-0.019913-0.1920.424069
41-0.015867-0.1530.43936
42-0.030214-0.29140.385708
430.0555620.53580.296681
440.0707550.68230.24836
450.014420.13910.444852
460.118781.14550.127477
470.054320.52380.300818
48-0.022482-0.21680.414416
490.0955240.92120.179666
50-0.043679-0.42120.337281
51-0.042921-0.41390.339945
52-0.002262-0.02180.491321
53-0.118688-1.14460.12766
54-0.032839-0.31670.376094
55-0.078841-0.76030.224496
56-0.175212-1.68970.04722
57-0.063788-0.61520.269978
58-0.109382-1.05480.147115
59-0.123209-1.18820.118892
60-0.040013-0.38590.350238


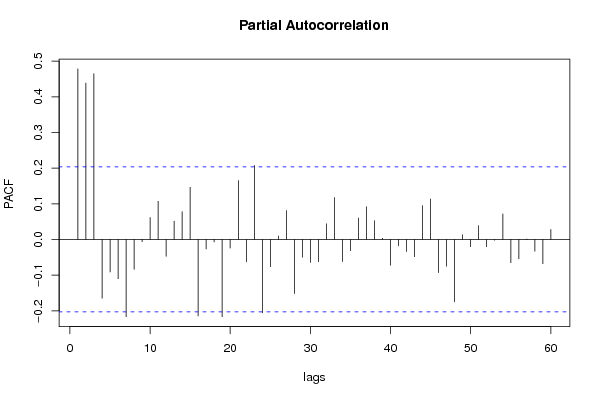
Partial Autocorrelation Function
Time lag kPACF(k)T-STATP-value
10.478154.61116e-06
20.4387544.23122.7e-05
30.464944.48371e-05
4-0.164858-1.58980.057633
5-0.091193-0.87940.190718
6-0.109949-1.06030.145874
7-0.216423-2.08710.019807
8-0.083807-0.80820.210516
9-0.006079-0.05860.476689
100.061340.59150.277796
110.1068081.030.152837
12-0.04712-0.45440.325298
130.0510740.49250.31175
140.0778550.75080.227332
150.1460581.40850.081153
16-0.214364-2.06730.020744
17-0.026612-0.25660.399014
18-0.006862-0.06620.47369
19-0.21647-2.08760.019786
20-0.024017-0.23160.408672
210.1653261.59430.057126
22-0.062847-0.60610.27297
230.2074332.00040.024186
24-0.205662-1.98330.02514
25-0.076439-0.73720.231442
260.0095890.09250.463262
270.0811830.78290.217836
28-0.151701-1.4630.073425
29-0.049748-0.47970.316266
30-0.064284-0.61990.26841
31-0.062523-0.6030.274003
320.0437650.4220.336981
330.1173791.1320.13028
34-0.062044-0.59830.275538
35-0.03145-0.30330.381171
360.0600070.57870.282099
370.0916310.88370.189579
380.0525570.50680.306734
390.0033340.03210.487212
40-0.071989-0.69420.244633
41-0.017992-0.17350.431313
42-0.03394-0.32730.372087
43-0.048448-0.46720.320718
440.0948180.91440.181439
450.1134811.09440.13831
46-0.092939-0.89630.186212
47-0.075133-0.72460.235271
48-0.174899-1.68670.04751
490.0133290.12850.449
50-0.020285-0.19560.422668
510.0384640.37090.355764
52-0.020511-0.19780.421814
53-0.001963-0.01890.492467
540.0714710.68920.246195
55-0.065127-0.62810.265751
56-0.05438-0.52440.300616
570.0009970.00960.496174
58-0.032788-0.31620.37628
59-0.067842-0.65420.257283
600.0281320.27130.393383

\begin{tabular}{lllllllll}
\hline
Partial Autocorrelation Function \tabularnewline
Time lag k & PACF(k) & T-STAT & P-value \tabularnewline
1 & 0.47815 & 4.6111 & 6e-06 \tabularnewline
2 & 0.438754 & 4.2312 & 2.7e-05 \tabularnewline
3 & 0.46494 & 4.4837 & 1e-05 \tabularnewline
4 & -0.164858 & -1.5898 & 0.057633 \tabularnewline
5 & -0.091193 & -0.8794 & 0.190718 \tabularnewline
6 & -0.109949 & -1.0603 & 0.145874 \tabularnewline
7 & -0.216423 & -2.0871 & 0.019807 \tabularnewline
8 & -0.083807 & -0.8082 & 0.210516 \tabularnewline
9 & -0.006079 & -0.0586 & 0.476689 \tabularnewline
10 & 0.06134 & 0.5915 & 0.277796 \tabularnewline
11 & 0.106808 & 1.03 & 0.152837 \tabularnewline
12 & -0.04712 & -0.4544 & 0.325298 \tabularnewline
13 & 0.051074 & 0.4925 & 0.31175 \tabularnewline
14 & 0.077855 & 0.7508 & 0.227332 \tabularnewline
15 & 0.146058 & 1.4085 & 0.081153 \tabularnewline
16 & -0.214364 & -2.0673 & 0.020744 \tabularnewline
17 & -0.026612 & -0.2566 & 0.399014 \tabularnewline
18 & -0.006862 & -0.0662 & 0.47369 \tabularnewline
19 & -0.21647 & -2.0876 & 0.019786 \tabularnewline
20 & -0.024017 & -0.2316 & 0.408672 \tabularnewline
21 & 0.165326 & 1.5943 & 0.057126 \tabularnewline
22 & -0.062847 & -0.6061 & 0.27297 \tabularnewline
23 & 0.207433 & 2.0004 & 0.024186 \tabularnewline
24 & -0.205662 & -1.9833 & 0.02514 \tabularnewline
25 & -0.076439 & -0.7372 & 0.231442 \tabularnewline
26 & 0.009589 & 0.0925 & 0.463262 \tabularnewline
27 & 0.081183 & 0.7829 & 0.217836 \tabularnewline
28 & -0.151701 & -1.463 & 0.073425 \tabularnewline
29 & -0.049748 & -0.4797 & 0.316266 \tabularnewline
30 & -0.064284 & -0.6199 & 0.26841 \tabularnewline
31 & -0.062523 & -0.603 & 0.274003 \tabularnewline
32 & 0.043765 & 0.422 & 0.336981 \tabularnewline
33 & 0.117379 & 1.132 & 0.13028 \tabularnewline
34 & -0.062044 & -0.5983 & 0.275538 \tabularnewline
35 & -0.03145 & -0.3033 & 0.381171 \tabularnewline
36 & 0.060007 & 0.5787 & 0.282099 \tabularnewline
37 & 0.091631 & 0.8837 & 0.189579 \tabularnewline
38 & 0.052557 & 0.5068 & 0.306734 \tabularnewline
39 & 0.003334 & 0.0321 & 0.487212 \tabularnewline
40 & -0.071989 & -0.6942 & 0.244633 \tabularnewline
41 & -0.017992 & -0.1735 & 0.431313 \tabularnewline
42 & -0.03394 & -0.3273 & 0.372087 \tabularnewline
43 & -0.048448 & -0.4672 & 0.320718 \tabularnewline
44 & 0.094818 & 0.9144 & 0.181439 \tabularnewline
45 & 0.113481 & 1.0944 & 0.13831 \tabularnewline
46 & -0.092939 & -0.8963 & 0.186212 \tabularnewline
47 & -0.075133 & -0.7246 & 0.235271 \tabularnewline
48 & -0.174899 & -1.6867 & 0.04751 \tabularnewline
49 & 0.013329 & 0.1285 & 0.449 \tabularnewline
50 & -0.020285 & -0.1956 & 0.422668 \tabularnewline
51 & 0.038464 & 0.3709 & 0.355764 \tabularnewline
52 & -0.020511 & -0.1978 & 0.421814 \tabularnewline
53 & -0.001963 & -0.0189 & 0.492467 \tabularnewline
54 & 0.071471 & 0.6892 & 0.246195 \tabularnewline
55 & -0.065127 & -0.6281 & 0.265751 \tabularnewline
56 & -0.05438 & -0.5244 & 0.300616 \tabularnewline
57 & 0.000997 & 0.0096 & 0.496174 \tabularnewline
58 & -0.032788 & -0.3162 & 0.37628 \tabularnewline
59 & -0.067842 & -0.6542 & 0.257283 \tabularnewline
60 & 0.028132 & 0.2713 & 0.393383 \tabularnewline
\hline
\end{tabular}
%Source: https://freestatistics.org/blog/index.php?pk=67343&T=2

[TABLE]
[ROW][C]Partial Autocorrelation Function[/C][/ROW]
[ROW][C]Time lag k[/C][C]PACF(k)[/C][C]T-STAT[/C][C]P-value[/C][/ROW]
[ROW][C]1[/C][C]0.47815[/C][C]4.6111[/C][C]6e-06[/C][/ROW]
[ROW][C]2[/C][C]0.438754[/C][C]4.2312[/C][C]2.7e-05[/C][/ROW]
[ROW][C]3[/C][C]0.46494[/C][C]4.4837[/C][C]1e-05[/C][/ROW]
[ROW][C]4[/C][C]-0.164858[/C][C]-1.5898[/C][C]0.057633[/C][/ROW]
[ROW][C]5[/C][C]-0.091193[/C][C]-0.8794[/C][C]0.190718[/C][/ROW]
[ROW][C]6[/C][C]-0.109949[/C][C]-1.0603[/C][C]0.145874[/C][/ROW]
[ROW][C]7[/C][C]-0.216423[/C][C]-2.0871[/C][C]0.019807[/C][/ROW]
[ROW][C]8[/C][C]-0.083807[/C][C]-0.8082[/C][C]0.210516[/C][/ROW]
[ROW][C]9[/C][C]-0.006079[/C][C]-0.0586[/C][C]0.476689[/C][/ROW]
[ROW][C]10[/C][C]0.06134[/C][C]0.5915[/C][C]0.277796[/C][/ROW]
[ROW][C]11[/C][C]0.106808[/C][C]1.03[/C][C]0.152837[/C][/ROW]
[ROW][C]12[/C][C]-0.04712[/C][C]-0.4544[/C][C]0.325298[/C][/ROW]
[ROW][C]13[/C][C]0.051074[/C][C]0.4925[/C][C]0.31175[/C][/ROW]
[ROW][C]14[/C][C]0.077855[/C][C]0.7508[/C][C]0.227332[/C][/ROW]
[ROW][C]15[/C][C]0.146058[/C][C]1.4085[/C][C]0.081153[/C][/ROW]
[ROW][C]16[/C][C]-0.214364[/C][C]-2.0673[/C][C]0.020744[/C][/ROW]
[ROW][C]17[/C][C]-0.026612[/C][C]-0.2566[/C][C]0.399014[/C][/ROW]
[ROW][C]18[/C][C]-0.006862[/C][C]-0.0662[/C][C]0.47369[/C][/ROW]
[ROW][C]19[/C][C]-0.21647[/C][C]-2.0876[/C][C]0.019786[/C][/ROW]
[ROW][C]20[/C][C]-0.024017[/C][C]-0.2316[/C][C]0.408672[/C][/ROW]
[ROW][C]21[/C][C]0.165326[/C][C]1.5943[/C][C]0.057126[/C][/ROW]
[ROW][C]22[/C][C]-0.062847[/C][C]-0.6061[/C][C]0.27297[/C][/ROW]
[ROW][C]23[/C][C]0.207433[/C][C]2.0004[/C][C]0.024186[/C][/ROW]
[ROW][C]24[/C][C]-0.205662[/C][C]-1.9833[/C][C]0.02514[/C][/ROW]
[ROW][C]25[/C][C]-0.076439[/C][C]-0.7372[/C][C]0.231442[/C][/ROW]
[ROW][C]26[/C][C]0.009589[/C][C]0.0925[/C][C]0.463262[/C][/ROW]
[ROW][C]27[/C][C]0.081183[/C][C]0.7829[/C][C]0.217836[/C][/ROW]
[ROW][C]28[/C][C]-0.151701[/C][C]-1.463[/C][C]0.073425[/C][/ROW]
[ROW][C]29[/C][C]-0.049748[/C][C]-0.4797[/C][C]0.316266[/C][/ROW]
[ROW][C]30[/C][C]-0.064284[/C][C]-0.6199[/C][C]0.26841[/C][/ROW]
[ROW][C]31[/C][C]-0.062523[/C][C]-0.603[/C][C]0.274003[/C][/ROW]
[ROW][C]32[/C][C]0.043765[/C][C]0.422[/C][C]0.336981[/C][/ROW]
[ROW][C]33[/C][C]0.117379[/C][C]1.132[/C][C]0.13028[/C][/ROW]
[ROW][C]34[/C][C]-0.062044[/C][C]-0.5983[/C][C]0.275538[/C][/ROW]
[ROW][C]35[/C][C]-0.03145[/C][C]-0.3033[/C][C]0.381171[/C][/ROW]
[ROW][C]36[/C][C]0.060007[/C][C]0.5787[/C][C]0.282099[/C][/ROW]
[ROW][C]37[/C][C]0.091631[/C][C]0.8837[/C][C]0.189579[/C][/ROW]
[ROW][C]38[/C][C]0.052557[/C][C]0.5068[/C][C]0.306734[/C][/ROW]
[ROW][C]39[/C][C]0.003334[/C][C]0.0321[/C][C]0.487212[/C][/ROW]
[ROW][C]40[/C][C]-0.071989[/C][C]-0.6942[/C][C]0.244633[/C][/ROW]
[ROW][C]41[/C][C]-0.017992[/C][C]-0.1735[/C][C]0.431313[/C][/ROW]
[ROW][C]42[/C][C]-0.03394[/C][C]-0.3273[/C][C]0.372087[/C][/ROW]
[ROW][C]43[/C][C]-0.048448[/C][C]-0.4672[/C][C]0.320718[/C][/ROW]
[ROW][C]44[/C][C]0.094818[/C][C]0.9144[/C][C]0.181439[/C][/ROW]
[ROW][C]45[/C][C]0.113481[/C][C]1.0944[/C][C]0.13831[/C][/ROW]
[ROW][C]46[/C][C]-0.092939[/C][C]-0.8963[/C][C]0.186212[/C][/ROW]
[ROW][C]47[/C][C]-0.075133[/C][C]-0.7246[/C][C]0.235271[/C][/ROW]
[ROW][C]48[/C][C]-0.174899[/C][C]-1.6867[/C][C]0.04751[/C][/ROW]
[ROW][C]49[/C][C]0.013329[/C][C]0.1285[/C][C]0.449[/C][/ROW]
[ROW][C]50[/C][C]-0.020285[/C][C]-0.1956[/C][C]0.422668[/C][/ROW]
[ROW][C]51[/C][C]0.038464[/C][C]0.3709[/C][C]0.355764[/C][/ROW]
[ROW][C]52[/C][C]-0.020511[/C][C]-0.1978[/C][C]0.421814[/C][/ROW]
[ROW][C]53[/C][C]-0.001963[/C][C]-0.0189[/C][C]0.492467[/C][/ROW]
[ROW][C]54[/C][C]0.071471[/C][C]0.6892[/C][C]0.246195[/C][/ROW]
[ROW][C]55[/C][C]-0.065127[/C][C]-0.6281[/C][C]0.265751[/C][/ROW]
[ROW][C]56[/C][C]-0.05438[/C][C]-0.5244[/C][C]0.300616[/C][/ROW]
[ROW][C]57[/C][C]0.000997[/C][C]0.0096[/C][C]0.496174[/C][/ROW]
[ROW][C]58[/C][C]-0.032788[/C][C]-0.3162[/C][C]0.37628[/C][/ROW]
[ROW][C]59[/C][C]-0.067842[/C][C]-0.6542[/C][C]0.257283[/C][/ROW]
[ROW][C]60[/C][C]0.028132[/C][C]0.2713[/C][C]0.393383[/C][/ROW]
[/TABLE]
Source: https://freestatistics.org/blog/index.php?pk=67343&T=2

Globally Unique Identifier (entire table): ba.freestatistics.org/blog/index.php?pk=67343&T=2

As an alternative you can also use a QR Code:  

The GUIDs for individual cells are displayed in the table below:

Partial Autocorrelation Function
Time lag kPACF(k)T-STATP-value
10.478154.61116e-06
20.4387544.23122.7e-05
30.464944.48371e-05
4-0.164858-1.58980.057633
5-0.091193-0.87940.190718
6-0.109949-1.06030.145874
7-0.216423-2.08710.019807
8-0.083807-0.80820.210516
9-0.006079-0.05860.476689
100.061340.59150.277796
110.1068081.030.152837
12-0.04712-0.45440.325298
130.0510740.49250.31175
140.0778550.75080.227332
150.1460581.40850.081153
16-0.214364-2.06730.020744
17-0.026612-0.25660.399014
18-0.006862-0.06620.47369
19-0.21647-2.08760.019786
20-0.024017-0.23160.408672
210.1653261.59430.057126
22-0.062847-0.60610.27297
230.2074332.00040.024186
24-0.205662-1.98330.02514
25-0.076439-0.73720.231442
260.0095890.09250.463262
270.0811830.78290.217836
28-0.151701-1.4630.073425
29-0.049748-0.47970.316266
30-0.064284-0.61990.26841
31-0.062523-0.6030.274003
320.0437650.4220.336981
330.1173791.1320.13028
34-0.062044-0.59830.275538
35-0.03145-0.30330.381171
360.0600070.57870.282099
370.0916310.88370.189579
380.0525570.50680.306734
390.0033340.03210.487212
40-0.071989-0.69420.244633
41-0.017992-0.17350.431313
42-0.03394-0.32730.372087
43-0.048448-0.46720.320718
440.0948180.91440.181439
450.1134811.09440.13831
46-0.092939-0.89630.186212
47-0.075133-0.72460.235271
48-0.174899-1.68670.04751
490.0133290.12850.449
50-0.020285-0.19560.422668
510.0384640.37090.355764
52-0.020511-0.19780.421814
53-0.001963-0.01890.492467
540.0714710.68920.246195
55-0.065127-0.62810.265751
56-0.05438-0.52440.300616
570.0009970.00960.496174
58-0.032788-0.31620.37628
59-0.067842-0.65420.257283
600.0281320.27130.393383


Parameters (Session):
par1 = 60 ; par2 = 1 ; par3 = 0 ; par4 = 1 ; par5 = 12 ; par6 = White Noise ; par7 = 0.95 ;
Parameters (R input):
par1 = 60 ; par2 = 1 ; par3 = 0 ; par4 = 1 ; par5 = 12 ; par6 = White Noise ; par7 = 0.95 ;
R code (references can be found in the software module):
if (par1 == 'Default') {
par1 = 10*log10(length(x))
} else {
par1 <- as.numeric(par1)
}
par2 <- as.numeric(par2)
par3 <- as.numeric(par3)
par4 <- as.numeric(par4)
par5 <- as.numeric(par5)
if (par6 == 'White Noise') par6 <- 'white' else par6 <- 'ma'
par7 <- as.numeric(par7)
if (par2 == 0) {
x <- log(x)
} else {
x <- (x ^ par2 - 1) / par2
}
if (par3 > 0) x <- diff(x,lag=1,difference=par3)
if (par4 > 0) x <- diff(x,lag=par5,difference=par4)
bitmap(file='pic1.png')
racf <- acf(x, par1, main='Autocorrelation', xlab='time lag', ylab='ACF', ci.type=par6, ci=par7, sub=paste('(lambda=',par2,', d=',par3,', D=',par4,', CI=', par7, ', CI type=',par6,')',sep=''))
dev.off()
bitmap(file='pic2.png')
rpacf <- pacf(x,par1,main='Partial Autocorrelation',xlab='lags',ylab='PACF')
dev.off()
(myacf <- c(racf$acf))
(mypacf <- c(rpacf$acf))
lengthx <- length(x)
sqrtn <- sqrt(lengthx)
load(file='createtable')
a<-table.start()
a<-table.row.start(a)
a<-table.element(a,'Autocorrelation Function',4,TRUE)
a<-table.row.end(a)
a<-table.row.start(a)
a<-table.element(a,'Time lag k',header=TRUE)
a<-table.element(a,hyperlink('basics.htm','ACF(k)','click here for more information about the Autocorrelation Function'),header=TRUE)
a<-table.element(a,'T-STAT',header=TRUE)
a<-table.element(a,'P-value',header=TRUE)
a<-table.row.end(a)
for (i in 2:(par1+1)) {
a<-table.row.start(a)
a<-table.element(a,i-1,header=TRUE)
a<-table.element(a,round(myacf[i],6))
mytstat <- myacf[i]*sqrtn
a<-table.element(a,round(mytstat,4))
a<-table.element(a,round(1-pt(abs(mytstat),lengthx),6))
a<-table.row.end(a)
}
a<-table.end(a)
table.save(a,file='mytable.tab')
a<-table.start()
a<-table.row.start(a)
a<-table.element(a,'Partial Autocorrelation Function',4,TRUE)
a<-table.row.end(a)
a<-table.row.start(a)
a<-table.element(a,'Time lag k',header=TRUE)
a<-table.element(a,hyperlink('basics.htm','PACF(k)','click here for more information about the Partial Autocorrelation Function'),header=TRUE)
a<-table.element(a,'T-STAT',header=TRUE)
a<-table.element(a,'P-value',header=TRUE)
a<-table.row.end(a)
for (i in 1:par1) {
a<-table.row.start(a)
a<-table.element(a,i,header=TRUE)
a<-table.element(a,round(mypacf[i],6))
mytstat <- mypacf[i]*sqrtn
a<-table.element(a,round(mytstat,4))
a<-table.element(a,round(1-pt(abs(mytstat),lengthx),6))
a<-table.row.end(a)
}
a<-table.end(a)
table.save(a,file='mytable1.tab')