Free Statistics

of Irreproducible Research!

Author's title

Author*The author of this computation has been verified*
R Software Modulerwasp_autocorrelation.wasp
Title produced by software(Partial) Autocorrelation Function
Date of computationSun, 13 Dec 2009 08:58:37 -0700
Cite this page as followsStatistical Computations at FreeStatistics.org, Office for Research Development and Education, URL https://freestatistics.org/blog/index.php?v=date/2009/Dec/13/t1260719956mefy82jnqzu32o2.htm/, Retrieved Sun, 28 Apr 2024 06:51:29 +0000
Statistical Computations at FreeStatistics.org, Office for Research Development and Education, URL https://freestatistics.org/blog/index.php?pk=67346, Retrieved Sun, 28 Apr 2024 06:51:29 +0000
QR Codes:

Original text written by user:
IsPrivate?No (this computation is public)
User-defined keywords
Estimated Impact113
Family? (F = Feedback message, R = changed R code, M = changed R Module, P = changed Parameters, D = changed Data)
-       [(Partial) Autocorrelation Function] [Bruto Industriële...] [2009-12-13 15:58:37] [efdfe680cd785c4af09f858b30f777ec] [Current]
-   P     [(Partial) Autocorrelation Function] [Bruto Industriële...] [2009-12-13 16:18:08] [5482608004c1d7bbf873930172393a2d]
Feedback Forum

Post a new message
Dataseries X:
98.8
100.5
110.4
96.4
101.9
106.2
81
94.7
101
109.4
102.3
90.7
96.2
96.1
106
103.1
102
104.7
86
92.1
106.9
112.6
101.7
92
97.4
97
105.4
102.7
98.1
104.5
87.4
89.9
109.8
111.7
98.6
96.9
95.1
97
112.7
102.9
97.4
111.4
87.4
96.8
114.1
110.3
103.9
101.6
94.6
95.9
104.7
102.8
98.1
113.9
80.9
95.7
113.2
105.9
108.8
102.3
99
100.7
115.5
100.7
109.9
114.6
85.4
100.5
114.8
116.5
112.9
102
106
105.3
118.8
106.1
109.3
117.2
92.5
104.2
112.5
122.4
113.3
100
110.7
112.8
109.8
117.3
109.1
115.9
96
99.8
116.8
115.7
99.4
94.3
91
93.2
103.1
94.1
91.8
102.7
82.6
89.1
104.5


Summary of computational transaction
Raw Inputview raw input (R code)
Raw Outputview raw output of R engine
Computing time1 seconds
R Server'Gwilym Jenkins' @ 72.249.127.135

\begin{tabular}{lllllllll}
\hline
Summary of computational transaction \tabularnewline
Raw Input & view raw input (R code)  \tabularnewline
Raw Output & view raw output of R engine  \tabularnewline
Computing time & 1 seconds \tabularnewline
R Server & 'Gwilym Jenkins' @ 72.249.127.135 \tabularnewline
\hline
\end{tabular}
%Source: https://freestatistics.org/blog/index.php?pk=67346&T=0

[TABLE]
[ROW][C]Summary of computational transaction[/C][/ROW]
[ROW][C]Raw Input[/C][C]view raw input (R code) [/C][/ROW]
[ROW][C]Raw Output[/C][C]view raw output of R engine [/C][/ROW]
[ROW][C]Computing time[/C][C]1 seconds[/C][/ROW]
[ROW][C]R Server[/C][C]'Gwilym Jenkins' @ 72.249.127.135[/C][/ROW]
[/TABLE]
Source: https://freestatistics.org/blog/index.php?pk=67346&T=0

Globally Unique Identifier (entire table): ba.freestatistics.org/blog/index.php?pk=67346&T=0

As an alternative you can also use a QR Code:  

The GUIDs for individual cells are displayed in the table below:

Summary of computational transaction
Raw Inputview raw input (R code)
Raw Outputview raw output of R engine
Computing time1 seconds
R Server'Gwilym Jenkins' @ 72.249.127.135


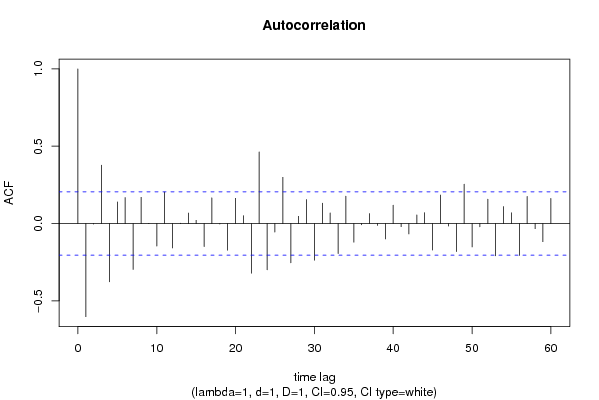
Autocorrelation Function
Time lag kACF(k)T-STATP-value
1-0.60241-5.77810
2-0.003473-0.03330.48675
30.3772033.6180.000242
4-0.377393-3.61980.000241
50.1394881.33790.09211
60.1681871.61320.055064
7-0.296928-2.8480.002713
80.1695271.6260.053681
90.0015830.01520.493959
10-0.14574-1.39790.082754
110.203851.95530.026794
12-0.157861-1.51410.066708
130.0022810.02190.491296
140.067860.65090.258371
150.0208770.20020.420867
16-0.148663-1.42590.078637
170.1659651.59190.057421
18-0.003268-0.03130.487529
19-0.172639-1.65590.050575
200.163411.56740.06023
210.0507820.48710.313678
22-0.32087-3.07770.001374
230.4627954.4391.3e-05
24-0.299757-2.87520.002508
25-0.055116-0.52870.299159
260.2989522.86740.002565
27-0.254413-2.44020.008297
280.0467610.44850.327416
290.1551171.48780.070108
30-0.237187-2.2750.012614
310.1314321.26070.105311
320.0683940.6560.256726
33-0.194405-1.86470.032708
340.1771411.69910.046342
35-0.120796-1.15860.124802
36-0.008116-0.07780.469059
370.0648090.62160.267863
38-0.012336-0.11830.453034
39-0.099844-0.95770.170369
400.1185731.13730.12918
41-0.020282-0.19450.423092
42-0.067351-0.6460.259941
430.0559750.53690.296319
440.0699420.67090.251997
45-0.1717-1.64690.051496
460.1841521.76630.040329
47-0.016519-0.15840.437228
48-0.181623-1.74210.042419
490.2544922.4410.00828
50-0.151439-1.45260.074875
51-0.021055-0.20190.420202
520.1577251.51280.066873
53-0.208971-2.00440.023985
540.1100381.05540.146993
550.069320.66490.253892
56-0.206318-1.97890.025407
570.1749341.67790.048379
58-0.033403-0.32040.374699
59-0.117691-1.12890.130947
600.1626731.56030.061061

\begin{tabular}{lllllllll}
\hline
Autocorrelation Function \tabularnewline
Time lag k & ACF(k) & T-STAT & P-value \tabularnewline
1 & -0.60241 & -5.7781 & 0 \tabularnewline
2 & -0.003473 & -0.0333 & 0.48675 \tabularnewline
3 & 0.377203 & 3.618 & 0.000242 \tabularnewline
4 & -0.377393 & -3.6198 & 0.000241 \tabularnewline
5 & 0.139488 & 1.3379 & 0.09211 \tabularnewline
6 & 0.168187 & 1.6132 & 0.055064 \tabularnewline
7 & -0.296928 & -2.848 & 0.002713 \tabularnewline
8 & 0.169527 & 1.626 & 0.053681 \tabularnewline
9 & 0.001583 & 0.0152 & 0.493959 \tabularnewline
10 & -0.14574 & -1.3979 & 0.082754 \tabularnewline
11 & 0.20385 & 1.9553 & 0.026794 \tabularnewline
12 & -0.157861 & -1.5141 & 0.066708 \tabularnewline
13 & 0.002281 & 0.0219 & 0.491296 \tabularnewline
14 & 0.06786 & 0.6509 & 0.258371 \tabularnewline
15 & 0.020877 & 0.2002 & 0.420867 \tabularnewline
16 & -0.148663 & -1.4259 & 0.078637 \tabularnewline
17 & 0.165965 & 1.5919 & 0.057421 \tabularnewline
18 & -0.003268 & -0.0313 & 0.487529 \tabularnewline
19 & -0.172639 & -1.6559 & 0.050575 \tabularnewline
20 & 0.16341 & 1.5674 & 0.06023 \tabularnewline
21 & 0.050782 & 0.4871 & 0.313678 \tabularnewline
22 & -0.32087 & -3.0777 & 0.001374 \tabularnewline
23 & 0.462795 & 4.439 & 1.3e-05 \tabularnewline
24 & -0.299757 & -2.8752 & 0.002508 \tabularnewline
25 & -0.055116 & -0.5287 & 0.299159 \tabularnewline
26 & 0.298952 & 2.8674 & 0.002565 \tabularnewline
27 & -0.254413 & -2.4402 & 0.008297 \tabularnewline
28 & 0.046761 & 0.4485 & 0.327416 \tabularnewline
29 & 0.155117 & 1.4878 & 0.070108 \tabularnewline
30 & -0.237187 & -2.275 & 0.012614 \tabularnewline
31 & 0.131432 & 1.2607 & 0.105311 \tabularnewline
32 & 0.068394 & 0.656 & 0.256726 \tabularnewline
33 & -0.194405 & -1.8647 & 0.032708 \tabularnewline
34 & 0.177141 & 1.6991 & 0.046342 \tabularnewline
35 & -0.120796 & -1.1586 & 0.124802 \tabularnewline
36 & -0.008116 & -0.0778 & 0.469059 \tabularnewline
37 & 0.064809 & 0.6216 & 0.267863 \tabularnewline
38 & -0.012336 & -0.1183 & 0.453034 \tabularnewline
39 & -0.099844 & -0.9577 & 0.170369 \tabularnewline
40 & 0.118573 & 1.1373 & 0.12918 \tabularnewline
41 & -0.020282 & -0.1945 & 0.423092 \tabularnewline
42 & -0.067351 & -0.646 & 0.259941 \tabularnewline
43 & 0.055975 & 0.5369 & 0.296319 \tabularnewline
44 & 0.069942 & 0.6709 & 0.251997 \tabularnewline
45 & -0.1717 & -1.6469 & 0.051496 \tabularnewline
46 & 0.184152 & 1.7663 & 0.040329 \tabularnewline
47 & -0.016519 & -0.1584 & 0.437228 \tabularnewline
48 & -0.181623 & -1.7421 & 0.042419 \tabularnewline
49 & 0.254492 & 2.441 & 0.00828 \tabularnewline
50 & -0.151439 & -1.4526 & 0.074875 \tabularnewline
51 & -0.021055 & -0.2019 & 0.420202 \tabularnewline
52 & 0.157725 & 1.5128 & 0.066873 \tabularnewline
53 & -0.208971 & -2.0044 & 0.023985 \tabularnewline
54 & 0.110038 & 1.0554 & 0.146993 \tabularnewline
55 & 0.06932 & 0.6649 & 0.253892 \tabularnewline
56 & -0.206318 & -1.9789 & 0.025407 \tabularnewline
57 & 0.174934 & 1.6779 & 0.048379 \tabularnewline
58 & -0.033403 & -0.3204 & 0.374699 \tabularnewline
59 & -0.117691 & -1.1289 & 0.130947 \tabularnewline
60 & 0.162673 & 1.5603 & 0.061061 \tabularnewline
\hline
\end{tabular}
%Source: https://freestatistics.org/blog/index.php?pk=67346&T=1

[TABLE]
[ROW][C]Autocorrelation Function[/C][/ROW]
[ROW][C]Time lag k[/C][C]ACF(k)[/C][C]T-STAT[/C][C]P-value[/C][/ROW]
[ROW][C]1[/C][C]-0.60241[/C][C]-5.7781[/C][C]0[/C][/ROW]
[ROW][C]2[/C][C]-0.003473[/C][C]-0.0333[/C][C]0.48675[/C][/ROW]
[ROW][C]3[/C][C]0.377203[/C][C]3.618[/C][C]0.000242[/C][/ROW]
[ROW][C]4[/C][C]-0.377393[/C][C]-3.6198[/C][C]0.000241[/C][/ROW]
[ROW][C]5[/C][C]0.139488[/C][C]1.3379[/C][C]0.09211[/C][/ROW]
[ROW][C]6[/C][C]0.168187[/C][C]1.6132[/C][C]0.055064[/C][/ROW]
[ROW][C]7[/C][C]-0.296928[/C][C]-2.848[/C][C]0.002713[/C][/ROW]
[ROW][C]8[/C][C]0.169527[/C][C]1.626[/C][C]0.053681[/C][/ROW]
[ROW][C]9[/C][C]0.001583[/C][C]0.0152[/C][C]0.493959[/C][/ROW]
[ROW][C]10[/C][C]-0.14574[/C][C]-1.3979[/C][C]0.082754[/C][/ROW]
[ROW][C]11[/C][C]0.20385[/C][C]1.9553[/C][C]0.026794[/C][/ROW]
[ROW][C]12[/C][C]-0.157861[/C][C]-1.5141[/C][C]0.066708[/C][/ROW]
[ROW][C]13[/C][C]0.002281[/C][C]0.0219[/C][C]0.491296[/C][/ROW]
[ROW][C]14[/C][C]0.06786[/C][C]0.6509[/C][C]0.258371[/C][/ROW]
[ROW][C]15[/C][C]0.020877[/C][C]0.2002[/C][C]0.420867[/C][/ROW]
[ROW][C]16[/C][C]-0.148663[/C][C]-1.4259[/C][C]0.078637[/C][/ROW]
[ROW][C]17[/C][C]0.165965[/C][C]1.5919[/C][C]0.057421[/C][/ROW]
[ROW][C]18[/C][C]-0.003268[/C][C]-0.0313[/C][C]0.487529[/C][/ROW]
[ROW][C]19[/C][C]-0.172639[/C][C]-1.6559[/C][C]0.050575[/C][/ROW]
[ROW][C]20[/C][C]0.16341[/C][C]1.5674[/C][C]0.06023[/C][/ROW]
[ROW][C]21[/C][C]0.050782[/C][C]0.4871[/C][C]0.313678[/C][/ROW]
[ROW][C]22[/C][C]-0.32087[/C][C]-3.0777[/C][C]0.001374[/C][/ROW]
[ROW][C]23[/C][C]0.462795[/C][C]4.439[/C][C]1.3e-05[/C][/ROW]
[ROW][C]24[/C][C]-0.299757[/C][C]-2.8752[/C][C]0.002508[/C][/ROW]
[ROW][C]25[/C][C]-0.055116[/C][C]-0.5287[/C][C]0.299159[/C][/ROW]
[ROW][C]26[/C][C]0.298952[/C][C]2.8674[/C][C]0.002565[/C][/ROW]
[ROW][C]27[/C][C]-0.254413[/C][C]-2.4402[/C][C]0.008297[/C][/ROW]
[ROW][C]28[/C][C]0.046761[/C][C]0.4485[/C][C]0.327416[/C][/ROW]
[ROW][C]29[/C][C]0.155117[/C][C]1.4878[/C][C]0.070108[/C][/ROW]
[ROW][C]30[/C][C]-0.237187[/C][C]-2.275[/C][C]0.012614[/C][/ROW]
[ROW][C]31[/C][C]0.131432[/C][C]1.2607[/C][C]0.105311[/C][/ROW]
[ROW][C]32[/C][C]0.068394[/C][C]0.656[/C][C]0.256726[/C][/ROW]
[ROW][C]33[/C][C]-0.194405[/C][C]-1.8647[/C][C]0.032708[/C][/ROW]
[ROW][C]34[/C][C]0.177141[/C][C]1.6991[/C][C]0.046342[/C][/ROW]
[ROW][C]35[/C][C]-0.120796[/C][C]-1.1586[/C][C]0.124802[/C][/ROW]
[ROW][C]36[/C][C]-0.008116[/C][C]-0.0778[/C][C]0.469059[/C][/ROW]
[ROW][C]37[/C][C]0.064809[/C][C]0.6216[/C][C]0.267863[/C][/ROW]
[ROW][C]38[/C][C]-0.012336[/C][C]-0.1183[/C][C]0.453034[/C][/ROW]
[ROW][C]39[/C][C]-0.099844[/C][C]-0.9577[/C][C]0.170369[/C][/ROW]
[ROW][C]40[/C][C]0.118573[/C][C]1.1373[/C][C]0.12918[/C][/ROW]
[ROW][C]41[/C][C]-0.020282[/C][C]-0.1945[/C][C]0.423092[/C][/ROW]
[ROW][C]42[/C][C]-0.067351[/C][C]-0.646[/C][C]0.259941[/C][/ROW]
[ROW][C]43[/C][C]0.055975[/C][C]0.5369[/C][C]0.296319[/C][/ROW]
[ROW][C]44[/C][C]0.069942[/C][C]0.6709[/C][C]0.251997[/C][/ROW]
[ROW][C]45[/C][C]-0.1717[/C][C]-1.6469[/C][C]0.051496[/C][/ROW]
[ROW][C]46[/C][C]0.184152[/C][C]1.7663[/C][C]0.040329[/C][/ROW]
[ROW][C]47[/C][C]-0.016519[/C][C]-0.1584[/C][C]0.437228[/C][/ROW]
[ROW][C]48[/C][C]-0.181623[/C][C]-1.7421[/C][C]0.042419[/C][/ROW]
[ROW][C]49[/C][C]0.254492[/C][C]2.441[/C][C]0.00828[/C][/ROW]
[ROW][C]50[/C][C]-0.151439[/C][C]-1.4526[/C][C]0.074875[/C][/ROW]
[ROW][C]51[/C][C]-0.021055[/C][C]-0.2019[/C][C]0.420202[/C][/ROW]
[ROW][C]52[/C][C]0.157725[/C][C]1.5128[/C][C]0.066873[/C][/ROW]
[ROW][C]53[/C][C]-0.208971[/C][C]-2.0044[/C][C]0.023985[/C][/ROW]
[ROW][C]54[/C][C]0.110038[/C][C]1.0554[/C][C]0.146993[/C][/ROW]
[ROW][C]55[/C][C]0.06932[/C][C]0.6649[/C][C]0.253892[/C][/ROW]
[ROW][C]56[/C][C]-0.206318[/C][C]-1.9789[/C][C]0.025407[/C][/ROW]
[ROW][C]57[/C][C]0.174934[/C][C]1.6779[/C][C]0.048379[/C][/ROW]
[ROW][C]58[/C][C]-0.033403[/C][C]-0.3204[/C][C]0.374699[/C][/ROW]
[ROW][C]59[/C][C]-0.117691[/C][C]-1.1289[/C][C]0.130947[/C][/ROW]
[ROW][C]60[/C][C]0.162673[/C][C]1.5603[/C][C]0.061061[/C][/ROW]
[/TABLE]
Source: https://freestatistics.org/blog/index.php?pk=67346&T=1

Globally Unique Identifier (entire table): ba.freestatistics.org/blog/index.php?pk=67346&T=1

As an alternative you can also use a QR Code:  

The GUIDs for individual cells are displayed in the table below:

Autocorrelation Function
Time lag kACF(k)T-STATP-value
1-0.60241-5.77810
2-0.003473-0.03330.48675
30.3772033.6180.000242
4-0.377393-3.61980.000241
50.1394881.33790.09211
60.1681871.61320.055064
7-0.296928-2.8480.002713
80.1695271.6260.053681
90.0015830.01520.493959
10-0.14574-1.39790.082754
110.203851.95530.026794
12-0.157861-1.51410.066708
130.0022810.02190.491296
140.067860.65090.258371
150.0208770.20020.420867
16-0.148663-1.42590.078637
170.1659651.59190.057421
18-0.003268-0.03130.487529
19-0.172639-1.65590.050575
200.163411.56740.06023
210.0507820.48710.313678
22-0.32087-3.07770.001374
230.4627954.4391.3e-05
24-0.299757-2.87520.002508
25-0.055116-0.52870.299159
260.2989522.86740.002565
27-0.254413-2.44020.008297
280.0467610.44850.327416
290.1551171.48780.070108
30-0.237187-2.2750.012614
310.1314321.26070.105311
320.0683940.6560.256726
33-0.194405-1.86470.032708
340.1771411.69910.046342
35-0.120796-1.15860.124802
36-0.008116-0.07780.469059
370.0648090.62160.267863
38-0.012336-0.11830.453034
39-0.099844-0.95770.170369
400.1185731.13730.12918
41-0.020282-0.19450.423092
42-0.067351-0.6460.259941
430.0559750.53690.296319
440.0699420.67090.251997
45-0.1717-1.64690.051496
460.1841521.76630.040329
47-0.016519-0.15840.437228
48-0.181623-1.74210.042419
490.2544922.4410.00828
50-0.151439-1.45260.074875
51-0.021055-0.20190.420202
520.1577251.51280.066873
53-0.208971-2.00440.023985
540.1100381.05540.146993
550.069320.66490.253892
56-0.206318-1.97890.025407
570.1749341.67790.048379
58-0.033403-0.32040.374699
59-0.117691-1.12890.130947
600.1626731.56030.061061


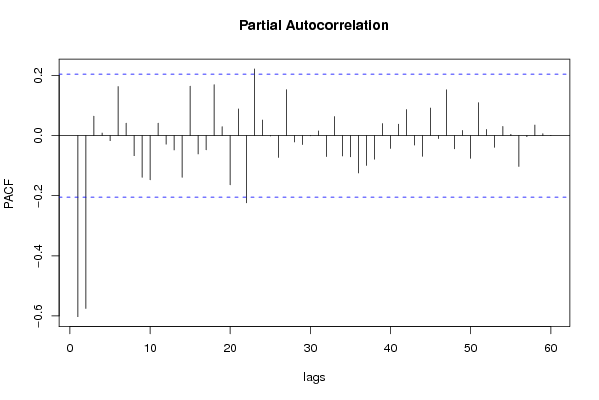
Partial Autocorrelation Function
Time lag kPACF(k)T-STATP-value
1-0.60241-5.77810
2-0.575058-5.51580
30.0644620.61830.268953
40.0084190.08080.467908
5-0.017135-0.16440.434905
60.1632941.56630.060361
70.0411840.3950.346869
8-0.0668-0.64070.261646
9-0.139047-1.33370.092799
10-0.147293-1.41280.080546
110.0413310.39640.346353
12-0.028561-0.27390.392369
13-0.047769-0.45820.32395
14-0.138969-1.33290.092922
150.16451.57780.059018
16-0.061225-0.58720.279237
17-0.047384-0.45450.325274
180.1693691.62450.053842
190.0295220.28320.388844
20-0.16386-1.57170.059728
210.0887290.85110.198473
22-0.223721-2.14590.017259
230.2216712.12620.018082
240.051540.49440.311116
25-0.001243-0.01190.495256
26-0.072579-0.69610.244045
270.1527451.46510.073154
28-0.021334-0.20460.419158
29-0.029815-0.2860.387771
30-0.00077-0.00740.497063
310.015270.14650.441937
32-0.069877-0.67020.252191
330.0633080.60720.272599
34-0.067557-0.6480.259305
35-0.070721-0.67830.249633
36-0.124157-1.19090.118385
37-0.099343-0.95290.171578
38-0.078643-0.75430.226292
390.0398940.38260.351431
40-0.042813-0.41070.341141
410.0380230.36470.358084
420.0863840.82860.204747
43-0.031687-0.30390.380935
44-0.068852-0.66040.255323
450.0917560.88010.190551
46-0.009934-0.09530.462148
470.1521071.4590.073991
48-0.044184-0.42380.336352
490.0172890.16580.434326
50-0.07557-0.72480.235194
510.1094821.05010.148208
520.0205020.19670.422267
53-0.03911-0.37510.354215
540.0302330.290.386239
550.0043870.04210.483263
56-0.102833-0.98630.163277
57-0.00364-0.03490.486111
580.0350880.33660.36861
590.0061560.0590.476521
600.0007240.00690.497238

\begin{tabular}{lllllllll}
\hline
Partial Autocorrelation Function \tabularnewline
Time lag k & PACF(k) & T-STAT & P-value \tabularnewline
1 & -0.60241 & -5.7781 & 0 \tabularnewline
2 & -0.575058 & -5.5158 & 0 \tabularnewline
3 & 0.064462 & 0.6183 & 0.268953 \tabularnewline
4 & 0.008419 & 0.0808 & 0.467908 \tabularnewline
5 & -0.017135 & -0.1644 & 0.434905 \tabularnewline
6 & 0.163294 & 1.5663 & 0.060361 \tabularnewline
7 & 0.041184 & 0.395 & 0.346869 \tabularnewline
8 & -0.0668 & -0.6407 & 0.261646 \tabularnewline
9 & -0.139047 & -1.3337 & 0.092799 \tabularnewline
10 & -0.147293 & -1.4128 & 0.080546 \tabularnewline
11 & 0.041331 & 0.3964 & 0.346353 \tabularnewline
12 & -0.028561 & -0.2739 & 0.392369 \tabularnewline
13 & -0.047769 & -0.4582 & 0.32395 \tabularnewline
14 & -0.138969 & -1.3329 & 0.092922 \tabularnewline
15 & 0.1645 & 1.5778 & 0.059018 \tabularnewline
16 & -0.061225 & -0.5872 & 0.279237 \tabularnewline
17 & -0.047384 & -0.4545 & 0.325274 \tabularnewline
18 & 0.169369 & 1.6245 & 0.053842 \tabularnewline
19 & 0.029522 & 0.2832 & 0.388844 \tabularnewline
20 & -0.16386 & -1.5717 & 0.059728 \tabularnewline
21 & 0.088729 & 0.8511 & 0.198473 \tabularnewline
22 & -0.223721 & -2.1459 & 0.017259 \tabularnewline
23 & 0.221671 & 2.1262 & 0.018082 \tabularnewline
24 & 0.05154 & 0.4944 & 0.311116 \tabularnewline
25 & -0.001243 & -0.0119 & 0.495256 \tabularnewline
26 & -0.072579 & -0.6961 & 0.244045 \tabularnewline
27 & 0.152745 & 1.4651 & 0.073154 \tabularnewline
28 & -0.021334 & -0.2046 & 0.419158 \tabularnewline
29 & -0.029815 & -0.286 & 0.387771 \tabularnewline
30 & -0.00077 & -0.0074 & 0.497063 \tabularnewline
31 & 0.01527 & 0.1465 & 0.441937 \tabularnewline
32 & -0.069877 & -0.6702 & 0.252191 \tabularnewline
33 & 0.063308 & 0.6072 & 0.272599 \tabularnewline
34 & -0.067557 & -0.648 & 0.259305 \tabularnewline
35 & -0.070721 & -0.6783 & 0.249633 \tabularnewline
36 & -0.124157 & -1.1909 & 0.118385 \tabularnewline
37 & -0.099343 & -0.9529 & 0.171578 \tabularnewline
38 & -0.078643 & -0.7543 & 0.226292 \tabularnewline
39 & 0.039894 & 0.3826 & 0.351431 \tabularnewline
40 & -0.042813 & -0.4107 & 0.341141 \tabularnewline
41 & 0.038023 & 0.3647 & 0.358084 \tabularnewline
42 & 0.086384 & 0.8286 & 0.204747 \tabularnewline
43 & -0.031687 & -0.3039 & 0.380935 \tabularnewline
44 & -0.068852 & -0.6604 & 0.255323 \tabularnewline
45 & 0.091756 & 0.8801 & 0.190551 \tabularnewline
46 & -0.009934 & -0.0953 & 0.462148 \tabularnewline
47 & 0.152107 & 1.459 & 0.073991 \tabularnewline
48 & -0.044184 & -0.4238 & 0.336352 \tabularnewline
49 & 0.017289 & 0.1658 & 0.434326 \tabularnewline
50 & -0.07557 & -0.7248 & 0.235194 \tabularnewline
51 & 0.109482 & 1.0501 & 0.148208 \tabularnewline
52 & 0.020502 & 0.1967 & 0.422267 \tabularnewline
53 & -0.03911 & -0.3751 & 0.354215 \tabularnewline
54 & 0.030233 & 0.29 & 0.386239 \tabularnewline
55 & 0.004387 & 0.0421 & 0.483263 \tabularnewline
56 & -0.102833 & -0.9863 & 0.163277 \tabularnewline
57 & -0.00364 & -0.0349 & 0.486111 \tabularnewline
58 & 0.035088 & 0.3366 & 0.36861 \tabularnewline
59 & 0.006156 & 0.059 & 0.476521 \tabularnewline
60 & 0.000724 & 0.0069 & 0.497238 \tabularnewline
\hline
\end{tabular}
%Source: https://freestatistics.org/blog/index.php?pk=67346&T=2

[TABLE]
[ROW][C]Partial Autocorrelation Function[/C][/ROW]
[ROW][C]Time lag k[/C][C]PACF(k)[/C][C]T-STAT[/C][C]P-value[/C][/ROW]
[ROW][C]1[/C][C]-0.60241[/C][C]-5.7781[/C][C]0[/C][/ROW]
[ROW][C]2[/C][C]-0.575058[/C][C]-5.5158[/C][C]0[/C][/ROW]
[ROW][C]3[/C][C]0.064462[/C][C]0.6183[/C][C]0.268953[/C][/ROW]
[ROW][C]4[/C][C]0.008419[/C][C]0.0808[/C][C]0.467908[/C][/ROW]
[ROW][C]5[/C][C]-0.017135[/C][C]-0.1644[/C][C]0.434905[/C][/ROW]
[ROW][C]6[/C][C]0.163294[/C][C]1.5663[/C][C]0.060361[/C][/ROW]
[ROW][C]7[/C][C]0.041184[/C][C]0.395[/C][C]0.346869[/C][/ROW]
[ROW][C]8[/C][C]-0.0668[/C][C]-0.6407[/C][C]0.261646[/C][/ROW]
[ROW][C]9[/C][C]-0.139047[/C][C]-1.3337[/C][C]0.092799[/C][/ROW]
[ROW][C]10[/C][C]-0.147293[/C][C]-1.4128[/C][C]0.080546[/C][/ROW]
[ROW][C]11[/C][C]0.041331[/C][C]0.3964[/C][C]0.346353[/C][/ROW]
[ROW][C]12[/C][C]-0.028561[/C][C]-0.2739[/C][C]0.392369[/C][/ROW]
[ROW][C]13[/C][C]-0.047769[/C][C]-0.4582[/C][C]0.32395[/C][/ROW]
[ROW][C]14[/C][C]-0.138969[/C][C]-1.3329[/C][C]0.092922[/C][/ROW]
[ROW][C]15[/C][C]0.1645[/C][C]1.5778[/C][C]0.059018[/C][/ROW]
[ROW][C]16[/C][C]-0.061225[/C][C]-0.5872[/C][C]0.279237[/C][/ROW]
[ROW][C]17[/C][C]-0.047384[/C][C]-0.4545[/C][C]0.325274[/C][/ROW]
[ROW][C]18[/C][C]0.169369[/C][C]1.6245[/C][C]0.053842[/C][/ROW]
[ROW][C]19[/C][C]0.029522[/C][C]0.2832[/C][C]0.388844[/C][/ROW]
[ROW][C]20[/C][C]-0.16386[/C][C]-1.5717[/C][C]0.059728[/C][/ROW]
[ROW][C]21[/C][C]0.088729[/C][C]0.8511[/C][C]0.198473[/C][/ROW]
[ROW][C]22[/C][C]-0.223721[/C][C]-2.1459[/C][C]0.017259[/C][/ROW]
[ROW][C]23[/C][C]0.221671[/C][C]2.1262[/C][C]0.018082[/C][/ROW]
[ROW][C]24[/C][C]0.05154[/C][C]0.4944[/C][C]0.311116[/C][/ROW]
[ROW][C]25[/C][C]-0.001243[/C][C]-0.0119[/C][C]0.495256[/C][/ROW]
[ROW][C]26[/C][C]-0.072579[/C][C]-0.6961[/C][C]0.244045[/C][/ROW]
[ROW][C]27[/C][C]0.152745[/C][C]1.4651[/C][C]0.073154[/C][/ROW]
[ROW][C]28[/C][C]-0.021334[/C][C]-0.2046[/C][C]0.419158[/C][/ROW]
[ROW][C]29[/C][C]-0.029815[/C][C]-0.286[/C][C]0.387771[/C][/ROW]
[ROW][C]30[/C][C]-0.00077[/C][C]-0.0074[/C][C]0.497063[/C][/ROW]
[ROW][C]31[/C][C]0.01527[/C][C]0.1465[/C][C]0.441937[/C][/ROW]
[ROW][C]32[/C][C]-0.069877[/C][C]-0.6702[/C][C]0.252191[/C][/ROW]
[ROW][C]33[/C][C]0.063308[/C][C]0.6072[/C][C]0.272599[/C][/ROW]
[ROW][C]34[/C][C]-0.067557[/C][C]-0.648[/C][C]0.259305[/C][/ROW]
[ROW][C]35[/C][C]-0.070721[/C][C]-0.6783[/C][C]0.249633[/C][/ROW]
[ROW][C]36[/C][C]-0.124157[/C][C]-1.1909[/C][C]0.118385[/C][/ROW]
[ROW][C]37[/C][C]-0.099343[/C][C]-0.9529[/C][C]0.171578[/C][/ROW]
[ROW][C]38[/C][C]-0.078643[/C][C]-0.7543[/C][C]0.226292[/C][/ROW]
[ROW][C]39[/C][C]0.039894[/C][C]0.3826[/C][C]0.351431[/C][/ROW]
[ROW][C]40[/C][C]-0.042813[/C][C]-0.4107[/C][C]0.341141[/C][/ROW]
[ROW][C]41[/C][C]0.038023[/C][C]0.3647[/C][C]0.358084[/C][/ROW]
[ROW][C]42[/C][C]0.086384[/C][C]0.8286[/C][C]0.204747[/C][/ROW]
[ROW][C]43[/C][C]-0.031687[/C][C]-0.3039[/C][C]0.380935[/C][/ROW]
[ROW][C]44[/C][C]-0.068852[/C][C]-0.6604[/C][C]0.255323[/C][/ROW]
[ROW][C]45[/C][C]0.091756[/C][C]0.8801[/C][C]0.190551[/C][/ROW]
[ROW][C]46[/C][C]-0.009934[/C][C]-0.0953[/C][C]0.462148[/C][/ROW]
[ROW][C]47[/C][C]0.152107[/C][C]1.459[/C][C]0.073991[/C][/ROW]
[ROW][C]48[/C][C]-0.044184[/C][C]-0.4238[/C][C]0.336352[/C][/ROW]
[ROW][C]49[/C][C]0.017289[/C][C]0.1658[/C][C]0.434326[/C][/ROW]
[ROW][C]50[/C][C]-0.07557[/C][C]-0.7248[/C][C]0.235194[/C][/ROW]
[ROW][C]51[/C][C]0.109482[/C][C]1.0501[/C][C]0.148208[/C][/ROW]
[ROW][C]52[/C][C]0.020502[/C][C]0.1967[/C][C]0.422267[/C][/ROW]
[ROW][C]53[/C][C]-0.03911[/C][C]-0.3751[/C][C]0.354215[/C][/ROW]
[ROW][C]54[/C][C]0.030233[/C][C]0.29[/C][C]0.386239[/C][/ROW]
[ROW][C]55[/C][C]0.004387[/C][C]0.0421[/C][C]0.483263[/C][/ROW]
[ROW][C]56[/C][C]-0.102833[/C][C]-0.9863[/C][C]0.163277[/C][/ROW]
[ROW][C]57[/C][C]-0.00364[/C][C]-0.0349[/C][C]0.486111[/C][/ROW]
[ROW][C]58[/C][C]0.035088[/C][C]0.3366[/C][C]0.36861[/C][/ROW]
[ROW][C]59[/C][C]0.006156[/C][C]0.059[/C][C]0.476521[/C][/ROW]
[ROW][C]60[/C][C]0.000724[/C][C]0.0069[/C][C]0.497238[/C][/ROW]
[/TABLE]
Source: https://freestatistics.org/blog/index.php?pk=67346&T=2

Globally Unique Identifier (entire table): ba.freestatistics.org/blog/index.php?pk=67346&T=2

As an alternative you can also use a QR Code:  

The GUIDs for individual cells are displayed in the table below:

Partial Autocorrelation Function
Time lag kPACF(k)T-STATP-value
1-0.60241-5.77810
2-0.575058-5.51580
30.0644620.61830.268953
40.0084190.08080.467908
5-0.017135-0.16440.434905
60.1632941.56630.060361
70.0411840.3950.346869
8-0.0668-0.64070.261646
9-0.139047-1.33370.092799
10-0.147293-1.41280.080546
110.0413310.39640.346353
12-0.028561-0.27390.392369
13-0.047769-0.45820.32395
14-0.138969-1.33290.092922
150.16451.57780.059018
16-0.061225-0.58720.279237
17-0.047384-0.45450.325274
180.1693691.62450.053842
190.0295220.28320.388844
20-0.16386-1.57170.059728
210.0887290.85110.198473
22-0.223721-2.14590.017259
230.2216712.12620.018082
240.051540.49440.311116
25-0.001243-0.01190.495256
26-0.072579-0.69610.244045
270.1527451.46510.073154
28-0.021334-0.20460.419158
29-0.029815-0.2860.387771
30-0.00077-0.00740.497063
310.015270.14650.441937
32-0.069877-0.67020.252191
330.0633080.60720.272599
34-0.067557-0.6480.259305
35-0.070721-0.67830.249633
36-0.124157-1.19090.118385
37-0.099343-0.95290.171578
38-0.078643-0.75430.226292
390.0398940.38260.351431
40-0.042813-0.41070.341141
410.0380230.36470.358084
420.0863840.82860.204747
43-0.031687-0.30390.380935
44-0.068852-0.66040.255323
450.0917560.88010.190551
46-0.009934-0.09530.462148
470.1521071.4590.073991
48-0.044184-0.42380.336352
490.0172890.16580.434326
50-0.07557-0.72480.235194
510.1094821.05010.148208
520.0205020.19670.422267
53-0.03911-0.37510.354215
540.0302330.290.386239
550.0043870.04210.483263
56-0.102833-0.98630.163277
57-0.00364-0.03490.486111
580.0350880.33660.36861
590.0061560.0590.476521
600.0007240.00690.497238


Parameters (Session):
par1 = 60 ; par2 = 1 ; par3 = 1 ; par4 = 1 ; par5 = 12 ; par6 = White Noise ; par7 = 0.95 ;
Parameters (R input):
par1 = 60 ; par2 = 1 ; par3 = 1 ; par4 = 1 ; par5 = 12 ; par6 = White Noise ; par7 = 0.95 ;
R code (references can be found in the software module):
if (par1 == 'Default') {
par1 = 10*log10(length(x))
} else {
par1 <- as.numeric(par1)
}
par2 <- as.numeric(par2)
par3 <- as.numeric(par3)
par4 <- as.numeric(par4)
par5 <- as.numeric(par5)
if (par6 == 'White Noise') par6 <- 'white' else par6 <- 'ma'
par7 <- as.numeric(par7)
if (par2 == 0) {
x <- log(x)
} else {
x <- (x ^ par2 - 1) / par2
}
if (par3 > 0) x <- diff(x,lag=1,difference=par3)
if (par4 > 0) x <- diff(x,lag=par5,difference=par4)
bitmap(file='pic1.png')
racf <- acf(x, par1, main='Autocorrelation', xlab='time lag', ylab='ACF', ci.type=par6, ci=par7, sub=paste('(lambda=',par2,', d=',par3,', D=',par4,', CI=', par7, ', CI type=',par6,')',sep=''))
dev.off()
bitmap(file='pic2.png')
rpacf <- pacf(x,par1,main='Partial Autocorrelation',xlab='lags',ylab='PACF')
dev.off()
(myacf <- c(racf$acf))
(mypacf <- c(rpacf$acf))
lengthx <- length(x)
sqrtn <- sqrt(lengthx)
load(file='createtable')
a<-table.start()
a<-table.row.start(a)
a<-table.element(a,'Autocorrelation Function',4,TRUE)
a<-table.row.end(a)
a<-table.row.start(a)
a<-table.element(a,'Time lag k',header=TRUE)
a<-table.element(a,hyperlink('basics.htm','ACF(k)','click here for more information about the Autocorrelation Function'),header=TRUE)
a<-table.element(a,'T-STAT',header=TRUE)
a<-table.element(a,'P-value',header=TRUE)
a<-table.row.end(a)
for (i in 2:(par1+1)) {
a<-table.row.start(a)
a<-table.element(a,i-1,header=TRUE)
a<-table.element(a,round(myacf[i],6))
mytstat <- myacf[i]*sqrtn
a<-table.element(a,round(mytstat,4))
a<-table.element(a,round(1-pt(abs(mytstat),lengthx),6))
a<-table.row.end(a)
}
a<-table.end(a)
table.save(a,file='mytable.tab')
a<-table.start()
a<-table.row.start(a)
a<-table.element(a,'Partial Autocorrelation Function',4,TRUE)
a<-table.row.end(a)
a<-table.row.start(a)
a<-table.element(a,'Time lag k',header=TRUE)
a<-table.element(a,hyperlink('basics.htm','PACF(k)','click here for more information about the Partial Autocorrelation Function'),header=TRUE)
a<-table.element(a,'T-STAT',header=TRUE)
a<-table.element(a,'P-value',header=TRUE)
a<-table.row.end(a)
for (i in 1:par1) {
a<-table.row.start(a)
a<-table.element(a,i,header=TRUE)
a<-table.element(a,round(mypacf[i],6))
mytstat <- mypacf[i]*sqrtn
a<-table.element(a,round(mytstat,4))
a<-table.element(a,round(1-pt(abs(mytstat),lengthx),6))
a<-table.row.end(a)
}
a<-table.end(a)
table.save(a,file='mytable1.tab')