Free Statistics

of Irreproducible Research!

Author's title

Author*The author of this computation has been verified*
R Software Modulerwasp_autocorrelation.wasp
Title produced by software(Partial) Autocorrelation Function
Date of computationSun, 13 Dec 2009 09:18:08 -0700
Cite this page as followsStatistical Computations at FreeStatistics.org, Office for Research Development and Education, URL https://freestatistics.org/blog/index.php?v=date/2009/Dec/13/t1260721157n1w98xuw931bxvu.htm/, Retrieved Sun, 28 Apr 2024 14:03:44 +0000
Statistical Computations at FreeStatistics.org, Office for Research Development and Education, URL https://freestatistics.org/blog/index.php?pk=67356, Retrieved Sun, 28 Apr 2024 14:03:44 +0000
QR Codes:

Original text written by user:
IsPrivate?No (this computation is public)
User-defined keywords
Estimated Impact100
Family? (F = Feedback message, R = changed R code, M = changed R Module, P = changed Parameters, D = changed Data)
-     [(Partial) Autocorrelation Function] [Bruto Industriële...] [2009-12-13 15:58:37] [5482608004c1d7bbf873930172393a2d]
-   P     [(Partial) Autocorrelation Function] [Bruto Industriële...] [2009-12-13 16:18:08] [efdfe680cd785c4af09f858b30f777ec] [Current]
Feedback Forum

Post a new message
Dataseries X:
98.8
100.5
110.4
96.4
101.9
106.2
81
94.7
101
109.4
102.3
90.7
96.2
96.1
106
103.1
102
104.7
86
92.1
106.9
112.6
101.7
92
97.4
97
105.4
102.7
98.1
104.5
87.4
89.9
109.8
111.7
98.6
96.9
95.1
97
112.7
102.9
97.4
111.4
87.4
96.8
114.1
110.3
103.9
101.6
94.6
95.9
104.7
102.8
98.1
113.9
80.9
95.7
113.2
105.9
108.8
102.3
99
100.7
115.5
100.7
109.9
114.6
85.4
100.5
114.8
116.5
112.9
102
106
105.3
118.8
106.1
109.3
117.2
92.5
104.2
112.5
122.4
113.3
100
110.7
112.8
109.8
117.3
109.1
115.9
96
99.8
116.8
115.7
99.4
94.3
91
93.2
103.1
94.1
91.8
102.7
82.6
89.1
104.5


Summary of computational transaction
Raw Inputview raw input (R code)
Raw Outputview raw output of R engine
Computing time1 seconds
R Server'Gwilym Jenkins' @ 72.249.127.135

\begin{tabular}{lllllllll}
\hline
Summary of computational transaction \tabularnewline
Raw Input & view raw input (R code)  \tabularnewline
Raw Output & view raw output of R engine  \tabularnewline
Computing time & 1 seconds \tabularnewline
R Server & 'Gwilym Jenkins' @ 72.249.127.135 \tabularnewline
\hline
\end{tabular}
%Source: https://freestatistics.org/blog/index.php?pk=67356&T=0

[TABLE]
[ROW][C]Summary of computational transaction[/C][/ROW]
[ROW][C]Raw Input[/C][C]view raw input (R code) [/C][/ROW]
[ROW][C]Raw Output[/C][C]view raw output of R engine [/C][/ROW]
[ROW][C]Computing time[/C][C]1 seconds[/C][/ROW]
[ROW][C]R Server[/C][C]'Gwilym Jenkins' @ 72.249.127.135[/C][/ROW]
[/TABLE]
Source: https://freestatistics.org/blog/index.php?pk=67356&T=0

Globally Unique Identifier (entire table): ba.freestatistics.org/blog/index.php?pk=67356&T=0

As an alternative you can also use a QR Code:  

The GUIDs for individual cells are displayed in the table below:

Summary of computational transaction
Raw Inputview raw input (R code)
Raw Outputview raw output of R engine
Computing time1 seconds
R Server'Gwilym Jenkins' @ 72.249.127.135


Autocorrelation Function
Time lag kACF(k)T-STATP-value
1-0.465846-4.61166e-06
2-0.172681-1.70950.045266
30.0576780.5710.284659
40.1062941.05230.147634
50.419634.15413.5e-05
6-0.829296-8.20960
70.344223.40760.000476
80.1986351.96640.026041
9-0.035629-0.35270.362531
10-0.147422-1.45940.073827
11-0.33493-3.31560.000641
120.7325177.25150
13-0.321195-3.17970.000987
14-0.177427-1.75640.041068
150.0427080.42280.336687
160.1154621.1430.127908
170.309283.06170.00142
18-0.655582-6.48990
190.2727872.70050.004079
200.1735551.71810.044467
21-0.037424-0.37050.355914
22-0.131087-1.29770.09872
23-0.231072-2.28750.012158
240.560525.54890
25-0.262327-2.59690.005427
26-0.108946-1.07850.141727
270.0017540.01740.49309
280.0977440.96760.167808
290.2749952.72230.003837
30-0.566931-5.61230
310.2532492.5070.00691
320.1345181.33170.093031
33-0.063016-0.62380.267097
34-0.042794-0.42360.336378
35-0.256401-2.53820.006358
360.4934234.88462e-06
37-0.207542-2.05460.021291
38-0.138748-1.37350.08636
390.0570460.56470.286776
400.05720.56630.286258
410.2097092.0760.020255
42-0.452797-4.48251e-05
430.1915881.89660.030411
440.1392541.37850.085586
45-0.069512-0.68810.246498
46-0.038912-0.38520.35046
47-0.188852-1.86950.032267
480.3939663.90018.8e-05
49-0.145819-1.44350.076029
50-0.136596-1.35220.089708
510.0423180.41890.338095
520.0829790.82140.206692
530.1413021.39880.082512
54-0.367152-3.63460.000223
550.1716241.6990.046247
560.0890860.88190.189994
57-0.022824-0.22590.410856
58-0.072002-0.71280.238836
59-0.158564-1.56970.059853
600.3609443.57320.000275

\begin{tabular}{lllllllll}
\hline
Autocorrelation Function \tabularnewline
Time lag k & ACF(k) & T-STAT & P-value \tabularnewline
1 & -0.465846 & -4.6116 & 6e-06 \tabularnewline
2 & -0.172681 & -1.7095 & 0.045266 \tabularnewline
3 & 0.057678 & 0.571 & 0.284659 \tabularnewline
4 & 0.106294 & 1.0523 & 0.147634 \tabularnewline
5 & 0.41963 & 4.1541 & 3.5e-05 \tabularnewline
6 & -0.829296 & -8.2096 & 0 \tabularnewline
7 & 0.34422 & 3.4076 & 0.000476 \tabularnewline
8 & 0.198635 & 1.9664 & 0.026041 \tabularnewline
9 & -0.035629 & -0.3527 & 0.362531 \tabularnewline
10 & -0.147422 & -1.4594 & 0.073827 \tabularnewline
11 & -0.33493 & -3.3156 & 0.000641 \tabularnewline
12 & 0.732517 & 7.2515 & 0 \tabularnewline
13 & -0.321195 & -3.1797 & 0.000987 \tabularnewline
14 & -0.177427 & -1.7564 & 0.041068 \tabularnewline
15 & 0.042708 & 0.4228 & 0.336687 \tabularnewline
16 & 0.115462 & 1.143 & 0.127908 \tabularnewline
17 & 0.30928 & 3.0617 & 0.00142 \tabularnewline
18 & -0.655582 & -6.4899 & 0 \tabularnewline
19 & 0.272787 & 2.7005 & 0.004079 \tabularnewline
20 & 0.173555 & 1.7181 & 0.044467 \tabularnewline
21 & -0.037424 & -0.3705 & 0.355914 \tabularnewline
22 & -0.131087 & -1.2977 & 0.09872 \tabularnewline
23 & -0.231072 & -2.2875 & 0.012158 \tabularnewline
24 & 0.56052 & 5.5489 & 0 \tabularnewline
25 & -0.262327 & -2.5969 & 0.005427 \tabularnewline
26 & -0.108946 & -1.0785 & 0.141727 \tabularnewline
27 & 0.001754 & 0.0174 & 0.49309 \tabularnewline
28 & 0.097744 & 0.9676 & 0.167808 \tabularnewline
29 & 0.274995 & 2.7223 & 0.003837 \tabularnewline
30 & -0.566931 & -5.6123 & 0 \tabularnewline
31 & 0.253249 & 2.507 & 0.00691 \tabularnewline
32 & 0.134518 & 1.3317 & 0.093031 \tabularnewline
33 & -0.063016 & -0.6238 & 0.267097 \tabularnewline
34 & -0.042794 & -0.4236 & 0.336378 \tabularnewline
35 & -0.256401 & -2.5382 & 0.006358 \tabularnewline
36 & 0.493423 & 4.8846 & 2e-06 \tabularnewline
37 & -0.207542 & -2.0546 & 0.021291 \tabularnewline
38 & -0.138748 & -1.3735 & 0.08636 \tabularnewline
39 & 0.057046 & 0.5647 & 0.286776 \tabularnewline
40 & 0.0572 & 0.5663 & 0.286258 \tabularnewline
41 & 0.209709 & 2.076 & 0.020255 \tabularnewline
42 & -0.452797 & -4.4825 & 1e-05 \tabularnewline
43 & 0.191588 & 1.8966 & 0.030411 \tabularnewline
44 & 0.139254 & 1.3785 & 0.085586 \tabularnewline
45 & -0.069512 & -0.6881 & 0.246498 \tabularnewline
46 & -0.038912 & -0.3852 & 0.35046 \tabularnewline
47 & -0.188852 & -1.8695 & 0.032267 \tabularnewline
48 & 0.393966 & 3.9001 & 8.8e-05 \tabularnewline
49 & -0.145819 & -1.4435 & 0.076029 \tabularnewline
50 & -0.136596 & -1.3522 & 0.089708 \tabularnewline
51 & 0.042318 & 0.4189 & 0.338095 \tabularnewline
52 & 0.082979 & 0.8214 & 0.206692 \tabularnewline
53 & 0.141302 & 1.3988 & 0.082512 \tabularnewline
54 & -0.367152 & -3.6346 & 0.000223 \tabularnewline
55 & 0.171624 & 1.699 & 0.046247 \tabularnewline
56 & 0.089086 & 0.8819 & 0.189994 \tabularnewline
57 & -0.022824 & -0.2259 & 0.410856 \tabularnewline
58 & -0.072002 & -0.7128 & 0.238836 \tabularnewline
59 & -0.158564 & -1.5697 & 0.059853 \tabularnewline
60 & 0.360944 & 3.5732 & 0.000275 \tabularnewline
\hline
\end{tabular}
%Source: https://freestatistics.org/blog/index.php?pk=67356&T=1

[TABLE]
[ROW][C]Autocorrelation Function[/C][/ROW]
[ROW][C]Time lag k[/C][C]ACF(k)[/C][C]T-STAT[/C][C]P-value[/C][/ROW]
[ROW][C]1[/C][C]-0.465846[/C][C]-4.6116[/C][C]6e-06[/C][/ROW]
[ROW][C]2[/C][C]-0.172681[/C][C]-1.7095[/C][C]0.045266[/C][/ROW]
[ROW][C]3[/C][C]0.057678[/C][C]0.571[/C][C]0.284659[/C][/ROW]
[ROW][C]4[/C][C]0.106294[/C][C]1.0523[/C][C]0.147634[/C][/ROW]
[ROW][C]5[/C][C]0.41963[/C][C]4.1541[/C][C]3.5e-05[/C][/ROW]
[ROW][C]6[/C][C]-0.829296[/C][C]-8.2096[/C][C]0[/C][/ROW]
[ROW][C]7[/C][C]0.34422[/C][C]3.4076[/C][C]0.000476[/C][/ROW]
[ROW][C]8[/C][C]0.198635[/C][C]1.9664[/C][C]0.026041[/C][/ROW]
[ROW][C]9[/C][C]-0.035629[/C][C]-0.3527[/C][C]0.362531[/C][/ROW]
[ROW][C]10[/C][C]-0.147422[/C][C]-1.4594[/C][C]0.073827[/C][/ROW]
[ROW][C]11[/C][C]-0.33493[/C][C]-3.3156[/C][C]0.000641[/C][/ROW]
[ROW][C]12[/C][C]0.732517[/C][C]7.2515[/C][C]0[/C][/ROW]
[ROW][C]13[/C][C]-0.321195[/C][C]-3.1797[/C][C]0.000987[/C][/ROW]
[ROW][C]14[/C][C]-0.177427[/C][C]-1.7564[/C][C]0.041068[/C][/ROW]
[ROW][C]15[/C][C]0.042708[/C][C]0.4228[/C][C]0.336687[/C][/ROW]
[ROW][C]16[/C][C]0.115462[/C][C]1.143[/C][C]0.127908[/C][/ROW]
[ROW][C]17[/C][C]0.30928[/C][C]3.0617[/C][C]0.00142[/C][/ROW]
[ROW][C]18[/C][C]-0.655582[/C][C]-6.4899[/C][C]0[/C][/ROW]
[ROW][C]19[/C][C]0.272787[/C][C]2.7005[/C][C]0.004079[/C][/ROW]
[ROW][C]20[/C][C]0.173555[/C][C]1.7181[/C][C]0.044467[/C][/ROW]
[ROW][C]21[/C][C]-0.037424[/C][C]-0.3705[/C][C]0.355914[/C][/ROW]
[ROW][C]22[/C][C]-0.131087[/C][C]-1.2977[/C][C]0.09872[/C][/ROW]
[ROW][C]23[/C][C]-0.231072[/C][C]-2.2875[/C][C]0.012158[/C][/ROW]
[ROW][C]24[/C][C]0.56052[/C][C]5.5489[/C][C]0[/C][/ROW]
[ROW][C]25[/C][C]-0.262327[/C][C]-2.5969[/C][C]0.005427[/C][/ROW]
[ROW][C]26[/C][C]-0.108946[/C][C]-1.0785[/C][C]0.141727[/C][/ROW]
[ROW][C]27[/C][C]0.001754[/C][C]0.0174[/C][C]0.49309[/C][/ROW]
[ROW][C]28[/C][C]0.097744[/C][C]0.9676[/C][C]0.167808[/C][/ROW]
[ROW][C]29[/C][C]0.274995[/C][C]2.7223[/C][C]0.003837[/C][/ROW]
[ROW][C]30[/C][C]-0.566931[/C][C]-5.6123[/C][C]0[/C][/ROW]
[ROW][C]31[/C][C]0.253249[/C][C]2.507[/C][C]0.00691[/C][/ROW]
[ROW][C]32[/C][C]0.134518[/C][C]1.3317[/C][C]0.093031[/C][/ROW]
[ROW][C]33[/C][C]-0.063016[/C][C]-0.6238[/C][C]0.267097[/C][/ROW]
[ROW][C]34[/C][C]-0.042794[/C][C]-0.4236[/C][C]0.336378[/C][/ROW]
[ROW][C]35[/C][C]-0.256401[/C][C]-2.5382[/C][C]0.006358[/C][/ROW]
[ROW][C]36[/C][C]0.493423[/C][C]4.8846[/C][C]2e-06[/C][/ROW]
[ROW][C]37[/C][C]-0.207542[/C][C]-2.0546[/C][C]0.021291[/C][/ROW]
[ROW][C]38[/C][C]-0.138748[/C][C]-1.3735[/C][C]0.08636[/C][/ROW]
[ROW][C]39[/C][C]0.057046[/C][C]0.5647[/C][C]0.286776[/C][/ROW]
[ROW][C]40[/C][C]0.0572[/C][C]0.5663[/C][C]0.286258[/C][/ROW]
[ROW][C]41[/C][C]0.209709[/C][C]2.076[/C][C]0.020255[/C][/ROW]
[ROW][C]42[/C][C]-0.452797[/C][C]-4.4825[/C][C]1e-05[/C][/ROW]
[ROW][C]43[/C][C]0.191588[/C][C]1.8966[/C][C]0.030411[/C][/ROW]
[ROW][C]44[/C][C]0.139254[/C][C]1.3785[/C][C]0.085586[/C][/ROW]
[ROW][C]45[/C][C]-0.069512[/C][C]-0.6881[/C][C]0.246498[/C][/ROW]
[ROW][C]46[/C][C]-0.038912[/C][C]-0.3852[/C][C]0.35046[/C][/ROW]
[ROW][C]47[/C][C]-0.188852[/C][C]-1.8695[/C][C]0.032267[/C][/ROW]
[ROW][C]48[/C][C]0.393966[/C][C]3.9001[/C][C]8.8e-05[/C][/ROW]
[ROW][C]49[/C][C]-0.145819[/C][C]-1.4435[/C][C]0.076029[/C][/ROW]
[ROW][C]50[/C][C]-0.136596[/C][C]-1.3522[/C][C]0.089708[/C][/ROW]
[ROW][C]51[/C][C]0.042318[/C][C]0.4189[/C][C]0.338095[/C][/ROW]
[ROW][C]52[/C][C]0.082979[/C][C]0.8214[/C][C]0.206692[/C][/ROW]
[ROW][C]53[/C][C]0.141302[/C][C]1.3988[/C][C]0.082512[/C][/ROW]
[ROW][C]54[/C][C]-0.367152[/C][C]-3.6346[/C][C]0.000223[/C][/ROW]
[ROW][C]55[/C][C]0.171624[/C][C]1.699[/C][C]0.046247[/C][/ROW]
[ROW][C]56[/C][C]0.089086[/C][C]0.8819[/C][C]0.189994[/C][/ROW]
[ROW][C]57[/C][C]-0.022824[/C][C]-0.2259[/C][C]0.410856[/C][/ROW]
[ROW][C]58[/C][C]-0.072002[/C][C]-0.7128[/C][C]0.238836[/C][/ROW]
[ROW][C]59[/C][C]-0.158564[/C][C]-1.5697[/C][C]0.059853[/C][/ROW]
[ROW][C]60[/C][C]0.360944[/C][C]3.5732[/C][C]0.000275[/C][/ROW]
[/TABLE]
Source: https://freestatistics.org/blog/index.php?pk=67356&T=1

Globally Unique Identifier (entire table): ba.freestatistics.org/blog/index.php?pk=67356&T=1

As an alternative you can also use a QR Code:  

The GUIDs for individual cells are displayed in the table below:

Autocorrelation Function
Time lag kACF(k)T-STATP-value
1-0.465846-4.61166e-06
2-0.172681-1.70950.045266
30.0576780.5710.284659
40.1062941.05230.147634
50.419634.15413.5e-05
6-0.829296-8.20960
70.344223.40760.000476
80.1986351.96640.026041
9-0.035629-0.35270.362531
10-0.147422-1.45940.073827
11-0.33493-3.31560.000641
120.7325177.25150
13-0.321195-3.17970.000987
14-0.177427-1.75640.041068
150.0427080.42280.336687
160.1154621.1430.127908
170.309283.06170.00142
18-0.655582-6.48990
190.2727872.70050.004079
200.1735551.71810.044467
21-0.037424-0.37050.355914
22-0.131087-1.29770.09872
23-0.231072-2.28750.012158
240.560525.54890
25-0.262327-2.59690.005427
26-0.108946-1.07850.141727
270.0017540.01740.49309
280.0977440.96760.167808
290.2749952.72230.003837
30-0.566931-5.61230
310.2532492.5070.00691
320.1345181.33170.093031
33-0.063016-0.62380.267097
34-0.042794-0.42360.336378
35-0.256401-2.53820.006358
360.4934234.88462e-06
37-0.207542-2.05460.021291
38-0.138748-1.37350.08636
390.0570460.56470.286776
400.05720.56630.286258
410.2097092.0760.020255
42-0.452797-4.48251e-05
430.1915881.89660.030411
440.1392541.37850.085586
45-0.069512-0.68810.246498
46-0.038912-0.38520.35046
47-0.188852-1.86950.032267
480.3939663.90018.8e-05
49-0.145819-1.44350.076029
50-0.136596-1.35220.089708
510.0423180.41890.338095
520.0829790.82140.206692
530.1413021.39880.082512
54-0.367152-3.63460.000223
550.1716241.6990.046247
560.0890860.88190.189994
57-0.022824-0.22590.410856
58-0.072002-0.71280.238836
59-0.158564-1.56970.059853
600.3609443.57320.000275


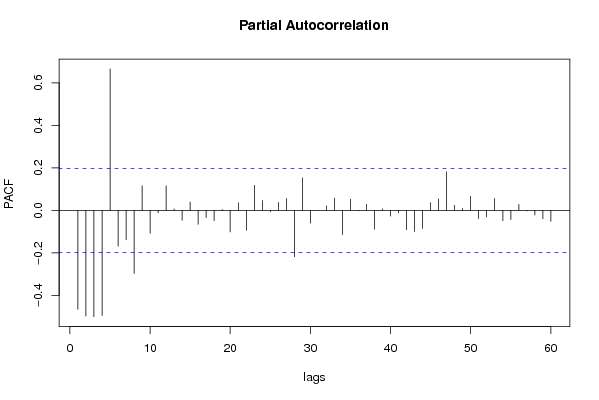
Partial Autocorrelation Function
Time lag kPACF(k)T-STATP-value
1-0.465846-4.61166e-06
2-0.4977-4.9272e-06
3-0.500227-4.9522e-06
4-0.494386-4.89422e-06
50.6653246.58640
6-0.168012-1.66320.049731
7-0.138501-1.37110.086739
8-0.297007-2.94020.002046
90.1154941.14330.127843
10-0.10833-1.07240.143084
11-0.011264-0.11150.455721
120.1148111.13660.129244
130.006890.06820.472878
14-0.046462-0.460.323285
150.0387480.38360.351059
16-0.065627-0.64970.258711
17-0.03395-0.33610.368763
18-0.048072-0.47590.317607
190.0044590.04410.482442
20-0.101534-1.00510.158653
210.0356750.35320.362364
22-0.094212-0.93270.176645
230.1175741.16390.12364
240.0468870.46420.321783
25-0.006883-0.06810.472906
260.0370670.36690.357227
270.055640.55080.291508
28-0.218296-2.1610.016565
290.1523891.50860.067313
30-0.059648-0.59050.278111
310.0001230.00120.499517
320.0205560.20350.419585
330.0572540.56680.286076
34-0.114232-1.13080.130442
350.0524310.5190.30245
36-0.002045-0.02020.491943
370.029110.28820.386911
38-0.088877-0.87980.19055
390.0066450.06580.473844
40-0.026888-0.26620.395333
41-0.012427-0.1230.451171
42-0.090985-0.90070.184978
43-0.099705-0.9870.163029
44-0.084916-0.84060.201302
450.0360330.35670.361039
460.0542580.53710.296198
470.1814671.79640.037754
480.0234910.23260.408297
490.0087310.08640.465651
500.0661880.65520.256928
51-0.038697-0.38310.351243
52-0.030876-0.30570.380256
530.0553930.54840.292346
54-0.049317-0.48820.313244
55-0.042873-0.42440.336093
560.0278350.27560.391736
57-0.002913-0.02880.488525
58-0.021416-0.2120.416269
59-0.039425-0.39030.348585
60-0.051707-0.51190.304946

\begin{tabular}{lllllllll}
\hline
Partial Autocorrelation Function \tabularnewline
Time lag k & PACF(k) & T-STAT & P-value \tabularnewline
1 & -0.465846 & -4.6116 & 6e-06 \tabularnewline
2 & -0.4977 & -4.927 & 2e-06 \tabularnewline
3 & -0.500227 & -4.952 & 2e-06 \tabularnewline
4 & -0.494386 & -4.8942 & 2e-06 \tabularnewline
5 & 0.665324 & 6.5864 & 0 \tabularnewline
6 & -0.168012 & -1.6632 & 0.049731 \tabularnewline
7 & -0.138501 & -1.3711 & 0.086739 \tabularnewline
8 & -0.297007 & -2.9402 & 0.002046 \tabularnewline
9 & 0.115494 & 1.1433 & 0.127843 \tabularnewline
10 & -0.10833 & -1.0724 & 0.143084 \tabularnewline
11 & -0.011264 & -0.1115 & 0.455721 \tabularnewline
12 & 0.114811 & 1.1366 & 0.129244 \tabularnewline
13 & 0.00689 & 0.0682 & 0.472878 \tabularnewline
14 & -0.046462 & -0.46 & 0.323285 \tabularnewline
15 & 0.038748 & 0.3836 & 0.351059 \tabularnewline
16 & -0.065627 & -0.6497 & 0.258711 \tabularnewline
17 & -0.03395 & -0.3361 & 0.368763 \tabularnewline
18 & -0.048072 & -0.4759 & 0.317607 \tabularnewline
19 & 0.004459 & 0.0441 & 0.482442 \tabularnewline
20 & -0.101534 & -1.0051 & 0.158653 \tabularnewline
21 & 0.035675 & 0.3532 & 0.362364 \tabularnewline
22 & -0.094212 & -0.9327 & 0.176645 \tabularnewline
23 & 0.117574 & 1.1639 & 0.12364 \tabularnewline
24 & 0.046887 & 0.4642 & 0.321783 \tabularnewline
25 & -0.006883 & -0.0681 & 0.472906 \tabularnewline
26 & 0.037067 & 0.3669 & 0.357227 \tabularnewline
27 & 0.05564 & 0.5508 & 0.291508 \tabularnewline
28 & -0.218296 & -2.161 & 0.016565 \tabularnewline
29 & 0.152389 & 1.5086 & 0.067313 \tabularnewline
30 & -0.059648 & -0.5905 & 0.278111 \tabularnewline
31 & 0.000123 & 0.0012 & 0.499517 \tabularnewline
32 & 0.020556 & 0.2035 & 0.419585 \tabularnewline
33 & 0.057254 & 0.5668 & 0.286076 \tabularnewline
34 & -0.114232 & -1.1308 & 0.130442 \tabularnewline
35 & 0.052431 & 0.519 & 0.30245 \tabularnewline
36 & -0.002045 & -0.0202 & 0.491943 \tabularnewline
37 & 0.02911 & 0.2882 & 0.386911 \tabularnewline
38 & -0.088877 & -0.8798 & 0.19055 \tabularnewline
39 & 0.006645 & 0.0658 & 0.473844 \tabularnewline
40 & -0.026888 & -0.2662 & 0.395333 \tabularnewline
41 & -0.012427 & -0.123 & 0.451171 \tabularnewline
42 & -0.090985 & -0.9007 & 0.184978 \tabularnewline
43 & -0.099705 & -0.987 & 0.163029 \tabularnewline
44 & -0.084916 & -0.8406 & 0.201302 \tabularnewline
45 & 0.036033 & 0.3567 & 0.361039 \tabularnewline
46 & 0.054258 & 0.5371 & 0.296198 \tabularnewline
47 & 0.181467 & 1.7964 & 0.037754 \tabularnewline
48 & 0.023491 & 0.2326 & 0.408297 \tabularnewline
49 & 0.008731 & 0.0864 & 0.465651 \tabularnewline
50 & 0.066188 & 0.6552 & 0.256928 \tabularnewline
51 & -0.038697 & -0.3831 & 0.351243 \tabularnewline
52 & -0.030876 & -0.3057 & 0.380256 \tabularnewline
53 & 0.055393 & 0.5484 & 0.292346 \tabularnewline
54 & -0.049317 & -0.4882 & 0.313244 \tabularnewline
55 & -0.042873 & -0.4244 & 0.336093 \tabularnewline
56 & 0.027835 & 0.2756 & 0.391736 \tabularnewline
57 & -0.002913 & -0.0288 & 0.488525 \tabularnewline
58 & -0.021416 & -0.212 & 0.416269 \tabularnewline
59 & -0.039425 & -0.3903 & 0.348585 \tabularnewline
60 & -0.051707 & -0.5119 & 0.304946 \tabularnewline
\hline
\end{tabular}
%Source: https://freestatistics.org/blog/index.php?pk=67356&T=2

[TABLE]
[ROW][C]Partial Autocorrelation Function[/C][/ROW]
[ROW][C]Time lag k[/C][C]PACF(k)[/C][C]T-STAT[/C][C]P-value[/C][/ROW]
[ROW][C]1[/C][C]-0.465846[/C][C]-4.6116[/C][C]6e-06[/C][/ROW]
[ROW][C]2[/C][C]-0.4977[/C][C]-4.927[/C][C]2e-06[/C][/ROW]
[ROW][C]3[/C][C]-0.500227[/C][C]-4.952[/C][C]2e-06[/C][/ROW]
[ROW][C]4[/C][C]-0.494386[/C][C]-4.8942[/C][C]2e-06[/C][/ROW]
[ROW][C]5[/C][C]0.665324[/C][C]6.5864[/C][C]0[/C][/ROW]
[ROW][C]6[/C][C]-0.168012[/C][C]-1.6632[/C][C]0.049731[/C][/ROW]
[ROW][C]7[/C][C]-0.138501[/C][C]-1.3711[/C][C]0.086739[/C][/ROW]
[ROW][C]8[/C][C]-0.297007[/C][C]-2.9402[/C][C]0.002046[/C][/ROW]
[ROW][C]9[/C][C]0.115494[/C][C]1.1433[/C][C]0.127843[/C][/ROW]
[ROW][C]10[/C][C]-0.10833[/C][C]-1.0724[/C][C]0.143084[/C][/ROW]
[ROW][C]11[/C][C]-0.011264[/C][C]-0.1115[/C][C]0.455721[/C][/ROW]
[ROW][C]12[/C][C]0.114811[/C][C]1.1366[/C][C]0.129244[/C][/ROW]
[ROW][C]13[/C][C]0.00689[/C][C]0.0682[/C][C]0.472878[/C][/ROW]
[ROW][C]14[/C][C]-0.046462[/C][C]-0.46[/C][C]0.323285[/C][/ROW]
[ROW][C]15[/C][C]0.038748[/C][C]0.3836[/C][C]0.351059[/C][/ROW]
[ROW][C]16[/C][C]-0.065627[/C][C]-0.6497[/C][C]0.258711[/C][/ROW]
[ROW][C]17[/C][C]-0.03395[/C][C]-0.3361[/C][C]0.368763[/C][/ROW]
[ROW][C]18[/C][C]-0.048072[/C][C]-0.4759[/C][C]0.317607[/C][/ROW]
[ROW][C]19[/C][C]0.004459[/C][C]0.0441[/C][C]0.482442[/C][/ROW]
[ROW][C]20[/C][C]-0.101534[/C][C]-1.0051[/C][C]0.158653[/C][/ROW]
[ROW][C]21[/C][C]0.035675[/C][C]0.3532[/C][C]0.362364[/C][/ROW]
[ROW][C]22[/C][C]-0.094212[/C][C]-0.9327[/C][C]0.176645[/C][/ROW]
[ROW][C]23[/C][C]0.117574[/C][C]1.1639[/C][C]0.12364[/C][/ROW]
[ROW][C]24[/C][C]0.046887[/C][C]0.4642[/C][C]0.321783[/C][/ROW]
[ROW][C]25[/C][C]-0.006883[/C][C]-0.0681[/C][C]0.472906[/C][/ROW]
[ROW][C]26[/C][C]0.037067[/C][C]0.3669[/C][C]0.357227[/C][/ROW]
[ROW][C]27[/C][C]0.05564[/C][C]0.5508[/C][C]0.291508[/C][/ROW]
[ROW][C]28[/C][C]-0.218296[/C][C]-2.161[/C][C]0.016565[/C][/ROW]
[ROW][C]29[/C][C]0.152389[/C][C]1.5086[/C][C]0.067313[/C][/ROW]
[ROW][C]30[/C][C]-0.059648[/C][C]-0.5905[/C][C]0.278111[/C][/ROW]
[ROW][C]31[/C][C]0.000123[/C][C]0.0012[/C][C]0.499517[/C][/ROW]
[ROW][C]32[/C][C]0.020556[/C][C]0.2035[/C][C]0.419585[/C][/ROW]
[ROW][C]33[/C][C]0.057254[/C][C]0.5668[/C][C]0.286076[/C][/ROW]
[ROW][C]34[/C][C]-0.114232[/C][C]-1.1308[/C][C]0.130442[/C][/ROW]
[ROW][C]35[/C][C]0.052431[/C][C]0.519[/C][C]0.30245[/C][/ROW]
[ROW][C]36[/C][C]-0.002045[/C][C]-0.0202[/C][C]0.491943[/C][/ROW]
[ROW][C]37[/C][C]0.02911[/C][C]0.2882[/C][C]0.386911[/C][/ROW]
[ROW][C]38[/C][C]-0.088877[/C][C]-0.8798[/C][C]0.19055[/C][/ROW]
[ROW][C]39[/C][C]0.006645[/C][C]0.0658[/C][C]0.473844[/C][/ROW]
[ROW][C]40[/C][C]-0.026888[/C][C]-0.2662[/C][C]0.395333[/C][/ROW]
[ROW][C]41[/C][C]-0.012427[/C][C]-0.123[/C][C]0.451171[/C][/ROW]
[ROW][C]42[/C][C]-0.090985[/C][C]-0.9007[/C][C]0.184978[/C][/ROW]
[ROW][C]43[/C][C]-0.099705[/C][C]-0.987[/C][C]0.163029[/C][/ROW]
[ROW][C]44[/C][C]-0.084916[/C][C]-0.8406[/C][C]0.201302[/C][/ROW]
[ROW][C]45[/C][C]0.036033[/C][C]0.3567[/C][C]0.361039[/C][/ROW]
[ROW][C]46[/C][C]0.054258[/C][C]0.5371[/C][C]0.296198[/C][/ROW]
[ROW][C]47[/C][C]0.181467[/C][C]1.7964[/C][C]0.037754[/C][/ROW]
[ROW][C]48[/C][C]0.023491[/C][C]0.2326[/C][C]0.408297[/C][/ROW]
[ROW][C]49[/C][C]0.008731[/C][C]0.0864[/C][C]0.465651[/C][/ROW]
[ROW][C]50[/C][C]0.066188[/C][C]0.6552[/C][C]0.256928[/C][/ROW]
[ROW][C]51[/C][C]-0.038697[/C][C]-0.3831[/C][C]0.351243[/C][/ROW]
[ROW][C]52[/C][C]-0.030876[/C][C]-0.3057[/C][C]0.380256[/C][/ROW]
[ROW][C]53[/C][C]0.055393[/C][C]0.5484[/C][C]0.292346[/C][/ROW]
[ROW][C]54[/C][C]-0.049317[/C][C]-0.4882[/C][C]0.313244[/C][/ROW]
[ROW][C]55[/C][C]-0.042873[/C][C]-0.4244[/C][C]0.336093[/C][/ROW]
[ROW][C]56[/C][C]0.027835[/C][C]0.2756[/C][C]0.391736[/C][/ROW]
[ROW][C]57[/C][C]-0.002913[/C][C]-0.0288[/C][C]0.488525[/C][/ROW]
[ROW][C]58[/C][C]-0.021416[/C][C]-0.212[/C][C]0.416269[/C][/ROW]
[ROW][C]59[/C][C]-0.039425[/C][C]-0.3903[/C][C]0.348585[/C][/ROW]
[ROW][C]60[/C][C]-0.051707[/C][C]-0.5119[/C][C]0.304946[/C][/ROW]
[/TABLE]
Source: https://freestatistics.org/blog/index.php?pk=67356&T=2

Globally Unique Identifier (entire table): ba.freestatistics.org/blog/index.php?pk=67356&T=2

As an alternative you can also use a QR Code:  

The GUIDs for individual cells are displayed in the table below:

Partial Autocorrelation Function
Time lag kPACF(k)T-STATP-value
1-0.465846-4.61166e-06
2-0.4977-4.9272e-06
3-0.500227-4.9522e-06
4-0.494386-4.89422e-06
50.6653246.58640
6-0.168012-1.66320.049731
7-0.138501-1.37110.086739
8-0.297007-2.94020.002046
90.1154941.14330.127843
10-0.10833-1.07240.143084
11-0.011264-0.11150.455721
120.1148111.13660.129244
130.006890.06820.472878
14-0.046462-0.460.323285
150.0387480.38360.351059
16-0.065627-0.64970.258711
17-0.03395-0.33610.368763
18-0.048072-0.47590.317607
190.0044590.04410.482442
20-0.101534-1.00510.158653
210.0356750.35320.362364
22-0.094212-0.93270.176645
230.1175741.16390.12364
240.0468870.46420.321783
25-0.006883-0.06810.472906
260.0370670.36690.357227
270.055640.55080.291508
28-0.218296-2.1610.016565
290.1523891.50860.067313
30-0.059648-0.59050.278111
310.0001230.00120.499517
320.0205560.20350.419585
330.0572540.56680.286076
34-0.114232-1.13080.130442
350.0524310.5190.30245
36-0.002045-0.02020.491943
370.029110.28820.386911
38-0.088877-0.87980.19055
390.0066450.06580.473844
40-0.026888-0.26620.395333
41-0.012427-0.1230.451171
42-0.090985-0.90070.184978
43-0.099705-0.9870.163029
44-0.084916-0.84060.201302
450.0360330.35670.361039
460.0542580.53710.296198
470.1814671.79640.037754
480.0234910.23260.408297
490.0087310.08640.465651
500.0661880.65520.256928
51-0.038697-0.38310.351243
52-0.030876-0.30570.380256
530.0553930.54840.292346
54-0.049317-0.48820.313244
55-0.042873-0.42440.336093
560.0278350.27560.391736
57-0.002913-0.02880.488525
58-0.021416-0.2120.416269
59-0.039425-0.39030.348585
60-0.051707-0.51190.304946


Parameters (Session):
par1 = 60 ; par2 = 1 ; par3 = 1 ; par4 = 1 ; par5 = 6 ; par6 = White Noise ; par7 = 0.95 ;
Parameters (R input):
par1 = 60 ; par2 = 1 ; par3 = 1 ; par4 = 1 ; par5 = 6 ; par6 = White Noise ; par7 = 0.95 ;
R code (references can be found in the software module):
if (par1 == 'Default') {
par1 = 10*log10(length(x))
} else {
par1 <- as.numeric(par1)
}
par2 <- as.numeric(par2)
par3 <- as.numeric(par3)
par4 <- as.numeric(par4)
par5 <- as.numeric(par5)
if (par6 == 'White Noise') par6 <- 'white' else par6 <- 'ma'
par7 <- as.numeric(par7)
if (par2 == 0) {
x <- log(x)
} else {
x <- (x ^ par2 - 1) / par2
}
if (par3 > 0) x <- diff(x,lag=1,difference=par3)
if (par4 > 0) x <- diff(x,lag=par5,difference=par4)
bitmap(file='pic1.png')
racf <- acf(x, par1, main='Autocorrelation', xlab='time lag', ylab='ACF', ci.type=par6, ci=par7, sub=paste('(lambda=',par2,', d=',par3,', D=',par4,', CI=', par7, ', CI type=',par6,')',sep=''))
dev.off()
bitmap(file='pic2.png')
rpacf <- pacf(x,par1,main='Partial Autocorrelation',xlab='lags',ylab='PACF')
dev.off()
(myacf <- c(racf$acf))
(mypacf <- c(rpacf$acf))
lengthx <- length(x)
sqrtn <- sqrt(lengthx)
load(file='createtable')
a<-table.start()
a<-table.row.start(a)
a<-table.element(a,'Autocorrelation Function',4,TRUE)
a<-table.row.end(a)
a<-table.row.start(a)
a<-table.element(a,'Time lag k',header=TRUE)
a<-table.element(a,hyperlink('basics.htm','ACF(k)','click here for more information about the Autocorrelation Function'),header=TRUE)
a<-table.element(a,'T-STAT',header=TRUE)
a<-table.element(a,'P-value',header=TRUE)
a<-table.row.end(a)
for (i in 2:(par1+1)) {
a<-table.row.start(a)
a<-table.element(a,i-1,header=TRUE)
a<-table.element(a,round(myacf[i],6))
mytstat <- myacf[i]*sqrtn
a<-table.element(a,round(mytstat,4))
a<-table.element(a,round(1-pt(abs(mytstat),lengthx),6))
a<-table.row.end(a)
}
a<-table.end(a)
table.save(a,file='mytable.tab')
a<-table.start()
a<-table.row.start(a)
a<-table.element(a,'Partial Autocorrelation Function',4,TRUE)
a<-table.row.end(a)
a<-table.row.start(a)
a<-table.element(a,'Time lag k',header=TRUE)
a<-table.element(a,hyperlink('basics.htm','PACF(k)','click here for more information about the Partial Autocorrelation Function'),header=TRUE)
a<-table.element(a,'T-STAT',header=TRUE)
a<-table.element(a,'P-value',header=TRUE)
a<-table.row.end(a)
for (i in 1:par1) {
a<-table.row.start(a)
a<-table.element(a,i,header=TRUE)
a<-table.element(a,round(mypacf[i],6))
mytstat <- mypacf[i]*sqrtn
a<-table.element(a,round(mytstat,4))
a<-table.element(a,round(1-pt(abs(mytstat),lengthx),6))
a<-table.row.end(a)
}
a<-table.end(a)
table.save(a,file='mytable1.tab')