Free Statistics

of Irreproducible Research!

Author's title

Author*The author of this computation has been verified*
R Software Modulerwasp_smp.wasp
Title produced by softwareStandard Deviation-Mean Plot
Date of computationSun, 13 Dec 2009 09:27:54 -0700
Cite this page as followsStatistical Computations at FreeStatistics.org, Office for Research Development and Education, URL https://freestatistics.org/blog/index.php?v=date/2009/Dec/13/t1260721718x05rlhlrp04fno7.htm/, Retrieved Sun, 28 Apr 2024 05:46:28 +0000
Statistical Computations at FreeStatistics.org, Office for Research Development and Education, URL https://freestatistics.org/blog/index.php?pk=67359, Retrieved Sun, 28 Apr 2024 05:46:28 +0000
QR Codes:

Original text written by user:
IsPrivate?No (this computation is public)
User-defined keywords
Estimated Impact105
Family? (F = Feedback message, R = changed R code, M = changed R Module, P = changed Parameters, D = changed Data)
-     [Standard Deviation-Mean Plot] [Standard deviatio...] [2008-12-19 15:14:51] [072df11bdb18ed8d65d8164df87f26f2]
-  MPD    [Standard Deviation-Mean Plot] [] [2009-12-13 16:27:54] [66ffaa9e54a90d3ae4874684602d24e9] [Current]
Feedback Forum

Post a new message
Dataseries X:
462
455
461
461
463
462
456
455
456
472
472
471
465
459
465
468
467
463
460
462
461
476
476
471
453
443
442
444
438
427
424
416
406
431
434
418
412
404
409
412
406
398
397
385
390
413
413
401
397
397
409
419
424
428
430
424
433
456
459
446


Summary of computational transaction
Raw Inputview raw input (R code)
Raw Outputview raw output of R engine
Computing time1 seconds
R Server'Gwilym Jenkins' @ 72.249.127.135

\begin{tabular}{lllllllll}
\hline
Summary of computational transaction \tabularnewline
Raw Input & view raw input (R code)  \tabularnewline
Raw Output & view raw output of R engine  \tabularnewline
Computing time & 1 seconds \tabularnewline
R Server & 'Gwilym Jenkins' @ 72.249.127.135 \tabularnewline
\hline
\end{tabular}
%Source: https://freestatistics.org/blog/index.php?pk=67359&T=0

[TABLE]
[ROW][C]Summary of computational transaction[/C][/ROW]
[ROW][C]Raw Input[/C][C]view raw input (R code) [/C][/ROW]
[ROW][C]Raw Output[/C][C]view raw output of R engine [/C][/ROW]
[ROW][C]Computing time[/C][C]1 seconds[/C][/ROW]
[ROW][C]R Server[/C][C]'Gwilym Jenkins' @ 72.249.127.135[/C][/ROW]
[/TABLE]
Source: https://freestatistics.org/blog/index.php?pk=67359&T=0

Globally Unique Identifier (entire table): ba.freestatistics.org/blog/index.php?pk=67359&T=0

As an alternative you can also use a QR Code:  

The GUIDs for individual cells are displayed in the table below:

Summary of computational transaction
Raw Inputview raw input (R code)
Raw Outputview raw output of R engine
Computing time1 seconds
R Server'Gwilym Jenkins' @ 72.249.127.135


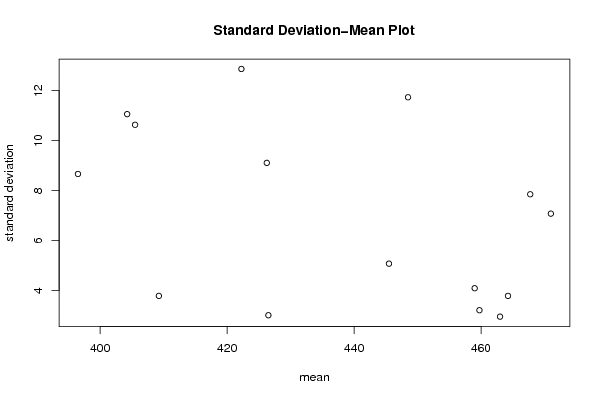
Standard Deviation-Mean Plot
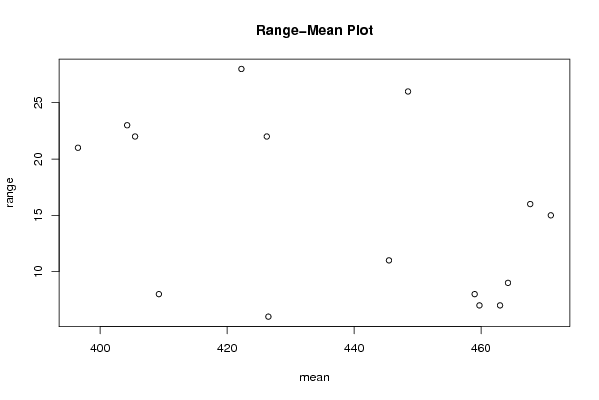
SectionMeanStandard DeviationRange
1459.753.201562118716427
24594.082482904638638
3467.757.8475049113290416
4464.253.774917217635379
54632.943920288775957
64717.0710678118654815
7445.55.0662280511902211
8426.259.1058589197651622
9422.2512.867918764638428
10409.253.774917217635378
11396.58.6602540378443921
12404.2511.05667219374823
13405.510.630145812734622
14426.536
15448.511.733143937865426

\begin{tabular}{lllllllll}
\hline
Standard Deviation-Mean Plot \tabularnewline
Section & Mean & Standard Deviation & Range \tabularnewline
1 & 459.75 & 3.20156211871642 & 7 \tabularnewline
2 & 459 & 4.08248290463863 & 8 \tabularnewline
3 & 467.75 & 7.84750491132904 & 16 \tabularnewline
4 & 464.25 & 3.77491721763537 & 9 \tabularnewline
5 & 463 & 2.94392028877595 & 7 \tabularnewline
6 & 471 & 7.07106781186548 & 15 \tabularnewline
7 & 445.5 & 5.06622805119022 & 11 \tabularnewline
8 & 426.25 & 9.10585891976516 & 22 \tabularnewline
9 & 422.25 & 12.8679187646384 & 28 \tabularnewline
10 & 409.25 & 3.77491721763537 & 8 \tabularnewline
11 & 396.5 & 8.66025403784439 & 21 \tabularnewline
12 & 404.25 & 11.056672193748 & 23 \tabularnewline
13 & 405.5 & 10.6301458127346 & 22 \tabularnewline
14 & 426.5 & 3 & 6 \tabularnewline
15 & 448.5 & 11.7331439378654 & 26 \tabularnewline
\hline
\end{tabular}
%Source: https://freestatistics.org/blog/index.php?pk=67359&T=1

[TABLE]
[ROW][C]Standard Deviation-Mean Plot[/C][/ROW]
[ROW][C]Section[/C][C]Mean[/C][C]Standard Deviation[/C][C]Range[/C][/ROW]
[ROW][C]1[/C][C]459.75[/C][C]3.20156211871642[/C][C]7[/C][/ROW]
[ROW][C]2[/C][C]459[/C][C]4.08248290463863[/C][C]8[/C][/ROW]
[ROW][C]3[/C][C]467.75[/C][C]7.84750491132904[/C][C]16[/C][/ROW]
[ROW][C]4[/C][C]464.25[/C][C]3.77491721763537[/C][C]9[/C][/ROW]
[ROW][C]5[/C][C]463[/C][C]2.94392028877595[/C][C]7[/C][/ROW]
[ROW][C]6[/C][C]471[/C][C]7.07106781186548[/C][C]15[/C][/ROW]
[ROW][C]7[/C][C]445.5[/C][C]5.06622805119022[/C][C]11[/C][/ROW]
[ROW][C]8[/C][C]426.25[/C][C]9.10585891976516[/C][C]22[/C][/ROW]
[ROW][C]9[/C][C]422.25[/C][C]12.8679187646384[/C][C]28[/C][/ROW]
[ROW][C]10[/C][C]409.25[/C][C]3.77491721763537[/C][C]8[/C][/ROW]
[ROW][C]11[/C][C]396.5[/C][C]8.66025403784439[/C][C]21[/C][/ROW]
[ROW][C]12[/C][C]404.25[/C][C]11.056672193748[/C][C]23[/C][/ROW]
[ROW][C]13[/C][C]405.5[/C][C]10.6301458127346[/C][C]22[/C][/ROW]
[ROW][C]14[/C][C]426.5[/C][C]3[/C][C]6[/C][/ROW]
[ROW][C]15[/C][C]448.5[/C][C]11.7331439378654[/C][C]26[/C][/ROW]
[/TABLE]
Source: https://freestatistics.org/blog/index.php?pk=67359&T=1

Globally Unique Identifier (entire table): ba.freestatistics.org/blog/index.php?pk=67359&T=1

As an alternative you can also use a QR Code:  

The GUIDs for individual cells are displayed in the table below:

Standard Deviation-Mean Plot
SectionMeanStandard DeviationRange
1459.753.201562118716427
24594.082482904638638
3467.757.8475049113290416
4464.253.774917217635379
54632.943920288775957
64717.0710678118654815
7445.55.0662280511902211
8426.259.1058589197651622
9422.2512.867918764638428
10409.253.774917217635378
11396.58.6602540378443921
12404.2511.05667219374823
13405.510.630145812734622
14426.536
15448.511.733143937865426


Regression: S.E.(k) = alpha + beta * Mean(k)
alpha32.8812891116887
beta-0.0591243661737563
S.D.0.0335162872357342
T-STAT-1.7640487968703
p-value0.101193344711179

\begin{tabular}{lllllllll}
\hline
Regression: S.E.(k) = alpha + beta * Mean(k) \tabularnewline
alpha & 32.8812891116887 \tabularnewline
beta & -0.0591243661737563 \tabularnewline
S.D. & 0.0335162872357342 \tabularnewline
T-STAT & -1.7640487968703 \tabularnewline
p-value & 0.101193344711179 \tabularnewline
\hline
\end{tabular}
%Source: https://freestatistics.org/blog/index.php?pk=67359&T=2

[TABLE]
[ROW][C]Regression: S.E.(k) = alpha + beta * Mean(k)[/C][/ROW]
[ROW][C]alpha[/C][C]32.8812891116887[/C][/ROW]
[ROW][C]beta[/C][C]-0.0591243661737563[/C][/ROW]
[ROW][C]S.D.[/C][C]0.0335162872357342[/C][/ROW]
[ROW][C]T-STAT[/C][C]-1.7640487968703[/C][/ROW]
[ROW][C]p-value[/C][C]0.101193344711179[/C][/ROW]
[/TABLE]
Source: https://freestatistics.org/blog/index.php?pk=67359&T=2

Globally Unique Identifier (entire table): ba.freestatistics.org/blog/index.php?pk=67359&T=2

As an alternative you can also use a QR Code:  

The GUIDs for individual cells are displayed in the table below:

Regression: S.E.(k) = alpha + beta * Mean(k)
alpha32.8812891116887
beta-0.0591243661737563
S.D.0.0335162872357342
T-STAT-1.7640487968703
p-value0.101193344711179


Regression: ln S.E.(k) = alpha + beta * ln Mean(k)
alpha24.5255032408143
beta-3.73534739810546
S.D.2.26565665380093
T-STAT-1.64868202418886
p-value0.123155552179332
Lambda4.73534739810546

\begin{tabular}{lllllllll}
\hline
Regression: ln S.E.(k) = alpha + beta * ln Mean(k) \tabularnewline
alpha & 24.5255032408143 \tabularnewline
beta & -3.73534739810546 \tabularnewline
S.D. & 2.26565665380093 \tabularnewline
T-STAT & -1.64868202418886 \tabularnewline
p-value & 0.123155552179332 \tabularnewline
Lambda & 4.73534739810546 \tabularnewline
\hline
\end{tabular}
%Source: https://freestatistics.org/blog/index.php?pk=67359&T=3

[TABLE]
[ROW][C]Regression: ln S.E.(k) = alpha + beta * ln Mean(k)[/C][/ROW]
[ROW][C]alpha[/C][C]24.5255032408143[/C][/ROW]
[ROW][C]beta[/C][C]-3.73534739810546[/C][/ROW]
[ROW][C]S.D.[/C][C]2.26565665380093[/C][/ROW]
[ROW][C]T-STAT[/C][C]-1.64868202418886[/C][/ROW]
[ROW][C]p-value[/C][C]0.123155552179332[/C][/ROW]
[ROW][C]Lambda[/C][C]4.73534739810546[/C][/ROW]
[/TABLE]
Source: https://freestatistics.org/blog/index.php?pk=67359&T=3

Globally Unique Identifier (entire table): ba.freestatistics.org/blog/index.php?pk=67359&T=3

As an alternative you can also use a QR Code:  

The GUIDs for individual cells are displayed in the table below:

Regression: ln S.E.(k) = alpha + beta * ln Mean(k)
alpha24.5255032408143
beta-3.73534739810546
S.D.2.26565665380093
T-STAT-1.64868202418886
p-value0.123155552179332
Lambda4.73534739810546


Parameters (Session):
par1 = 4 ;
Parameters (R input):
par1 = 4 ;
R code (references can be found in the software module):
par1 <- as.numeric(par1)
(n <- length(x))
(np <- floor(n / par1))
arr <- array(NA,dim=c(par1,np))
j <- 0
k <- 1
for (i in 1:(np*par1))
{
j = j + 1
arr[j,k] <- x[i]
if (j == par1) {
j = 0
k=k+1
}
}
arr
arr.mean <- array(NA,dim=np)
arr.sd <- array(NA,dim=np)
arr.range <- array(NA,dim=np)
for (j in 1:np)
{
arr.mean[j] <- mean(arr[,j],na.rm=TRUE)
arr.sd[j] <- sd(arr[,j],na.rm=TRUE)
arr.range[j] <- max(arr[,j],na.rm=TRUE) - min(arr[,j],na.rm=TRUE)
}
arr.mean
arr.sd
arr.range
(lm1 <- lm(arr.sd~arr.mean))
(lnlm1 <- lm(log(arr.sd)~log(arr.mean)))
(lm2 <- lm(arr.range~arr.mean))
bitmap(file='test1.png')
plot(arr.mean,arr.sd,main='Standard Deviation-Mean Plot',xlab='mean',ylab='standard deviation')
dev.off()
bitmap(file='test2.png')
plot(arr.mean,arr.range,main='Range-Mean Plot',xlab='mean',ylab='range')
dev.off()
load(file='createtable')
a<-table.start()
a<-table.row.start(a)
a<-table.element(a,'Standard Deviation-Mean Plot',4,TRUE)
a<-table.row.end(a)
a<-table.row.start(a)
a<-table.element(a,'Section',header=TRUE)
a<-table.element(a,'Mean',header=TRUE)
a<-table.element(a,'Standard Deviation',header=TRUE)
a<-table.element(a,'Range',header=TRUE)
a<-table.row.end(a)
for (j in 1:np) {
a<-table.row.start(a)
a<-table.element(a,j,header=TRUE)
a<-table.element(a,arr.mean[j])
a<-table.element(a,arr.sd[j] )
a<-table.element(a,arr.range[j] )
a<-table.row.end(a)
}
a<-table.end(a)
table.save(a,file='mytable.tab')
a<-table.start()
a<-table.row.start(a)
a<-table.element(a,'Regression: S.E.(k) = alpha + beta * Mean(k)',2,TRUE)
a<-table.row.end(a)
a<-table.row.start(a)
a<-table.element(a,'alpha',header=TRUE)
a<-table.element(a,lm1$coefficients[[1]])
a<-table.row.end(a)
a<-table.row.start(a)
a<-table.element(a,'beta',header=TRUE)
a<-table.element(a,lm1$coefficients[[2]])
a<-table.row.end(a)
a<-table.row.start(a)
a<-table.element(a,'S.D.',header=TRUE)
a<-table.element(a,summary(lm1)$coefficients[2,2])
a<-table.row.end(a)
a<-table.row.start(a)
a<-table.element(a,'T-STAT',header=TRUE)
a<-table.element(a,summary(lm1)$coefficients[2,3])
a<-table.row.end(a)
a<-table.row.start(a)
a<-table.element(a,'p-value',header=TRUE)
a<-table.element(a,summary(lm1)$coefficients[2,4])
a<-table.row.end(a)
a<-table.end(a)
table.save(a,file='mytable1.tab')
a<-table.start()
a<-table.row.start(a)
a<-table.element(a,'Regression: ln S.E.(k) = alpha + beta * ln Mean(k)',2,TRUE)
a<-table.row.end(a)
a<-table.row.start(a)
a<-table.element(a,'alpha',header=TRUE)
a<-table.element(a,lnlm1$coefficients[[1]])
a<-table.row.end(a)
a<-table.row.start(a)
a<-table.element(a,'beta',header=TRUE)
a<-table.element(a,lnlm1$coefficients[[2]])
a<-table.row.end(a)
a<-table.row.start(a)
a<-table.element(a,'S.D.',header=TRUE)
a<-table.element(a,summary(lnlm1)$coefficients[2,2])
a<-table.row.end(a)
a<-table.row.start(a)
a<-table.element(a,'T-STAT',header=TRUE)
a<-table.element(a,summary(lnlm1)$coefficients[2,3])
a<-table.row.end(a)
a<-table.row.start(a)
a<-table.element(a,'p-value',header=TRUE)
a<-table.element(a,summary(lnlm1)$coefficients[2,4])
a<-table.row.end(a)
a<-table.row.start(a)
a<-table.element(a,'Lambda',header=TRUE)
a<-table.element(a,1-lnlm1$coefficients[[2]])
a<-table.row.end(a)
a<-table.end(a)
table.save(a,file='mytable2.tab')