Free Statistics

of Irreproducible Research!

Author's title

Author*The author of this computation has been verified*
R Software Modulerwasp_arimaforecasting.wasp
Title produced by softwareARIMA Forecasting
Date of computationSun, 13 Dec 2009 13:23:46 -0700
Cite this page as followsStatistical Computations at FreeStatistics.org, Office for Research Development and Education, URL https://freestatistics.org/blog/index.php?v=date/2009/Dec/13/t1260735864ec6rctub0wekcit.htm/, Retrieved Sun, 28 Apr 2024 09:09:41 +0000
Statistical Computations at FreeStatistics.org, Office for Research Development and Education, URL https://freestatistics.org/blog/index.php?pk=67409, Retrieved Sun, 28 Apr 2024 09:09:41 +0000
QR Codes:

Original text written by user:
IsPrivate?No (this computation is public)
User-defined keywords
Estimated Impact136
Family? (F = Feedback message, R = changed R code, M = changed R Module, P = changed Parameters, D = changed Data)
-     [ARIMA Forecasting] [] [2009-12-07 09:54:52] [b98453cac15ba1066b407e146608df68]
- R PD    [ARIMA Forecasting] [voorspelling van ...] [2009-12-13 20:23:46] [03368d751914a6c247d86aff8eac7cbf] [Current]
- R PD      [ARIMA Forecasting] [forecast aantal b...] [2009-12-19 10:43:51] [82d27727e9ba70a4d0e9e253f76836cf]
Feedback Forum

Post a new message
Dataseries X:
2360
2214
2825
2355
2333
3016
2155
2172
2150
2533
2058
2160
2260
2498
2695
2799
2947
2930
2318
2540
2570
2669
2450
2842
3440
2678
2981
2260
2844
2546
2456
2295
2379
2479
2057
2280
2351
2276
2548
2311
2201
2725
2408
2139
1898
2537
2069
2063
2524
2437
2189
2793
2074
2622
2278
2144
2427
2139
1828
2072
1800


Summary of computational transaction
Raw Inputview raw input (R code)
Raw Outputview raw output of R engine
Computing time2 seconds
R Server'Gwilym Jenkins' @ 72.249.127.135

\begin{tabular}{lllllllll}
\hline
Summary of computational transaction \tabularnewline
Raw Input & view raw input (R code)  \tabularnewline
Raw Output & view raw output of R engine  \tabularnewline
Computing time & 2 seconds \tabularnewline
R Server & 'Gwilym Jenkins' @ 72.249.127.135 \tabularnewline
\hline
\end{tabular}
%Source: https://freestatistics.org/blog/index.php?pk=67409&T=0

[TABLE]
[ROW][C]Summary of computational transaction[/C][/ROW]
[ROW][C]Raw Input[/C][C]view raw input (R code) [/C][/ROW]
[ROW][C]Raw Output[/C][C]view raw output of R engine [/C][/ROW]
[ROW][C]Computing time[/C][C]2 seconds[/C][/ROW]
[ROW][C]R Server[/C][C]'Gwilym Jenkins' @ 72.249.127.135[/C][/ROW]
[/TABLE]
Source: https://freestatistics.org/blog/index.php?pk=67409&T=0

Globally Unique Identifier (entire table): ba.freestatistics.org/blog/index.php?pk=67409&T=0

As an alternative you can also use a QR Code:  

The GUIDs for individual cells are displayed in the table below:

Summary of computational transaction
Raw Inputview raw input (R code)
Raw Outputview raw output of R engine
Computing time2 seconds
R Server'Gwilym Jenkins' @ 72.249.127.135


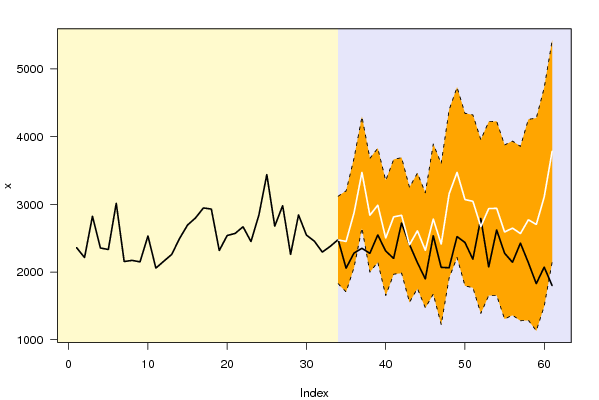
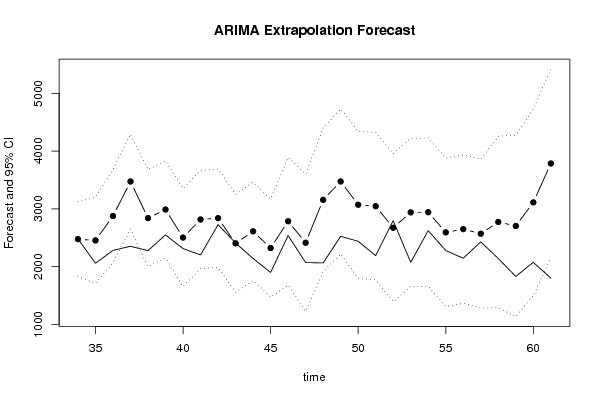
Univariate ARIMA Extrapolation Forecast
timeY[t]F[t]95% LB95% UBp-value(H0: Y[t] = F[t])P(F[t]>Y[t-1])P(F[t]>Y[t-s])P(F[t]>Y[33])
212570-------
222669-------
232450-------
242842-------
253440-------
262678-------
272981-------
282260-------
292844-------
302546-------
312456-------
322295-------
332379-------
3424792474.07591827.44073120.7110.4940.61340.27730.6134
3520572452.20971705.48243198.9370.14980.4720.50230.5762
3622802874.24822066.05813682.43830.07480.97630.53120.8851
3723513472.47532650.45054294.50020.00370.99780.53090.9954
3822762838.53221997.73443679.33010.09490.87210.64590.858
3925482987.80332146.51363829.0930.15280.95140.50630.922
4023112501.81321651.74643351.880.330.45760.71140.6115
4122012815.06621967.70753662.4250.07770.87820.47330.8434
4227252837.80771985.16673690.44880.39770.92840.74880.8542
4324082402.19421553.12753251.2610.49470.22810.45060.5213
4421392609.12481756.67413461.57560.13990.67810.76490.7016
4518982320.61411471.4483169.78010.16470.66250.44640.4464
4625372783.87421675.54763892.20090.33120.94140.70510.763
4720692412.43411222.88943601.97870.28570.41870.72090.522
4820633155.22581913.49414396.95750.04240.95680.91640.8898
4925243472.882215.47664730.28340.06960.9860.95980.9559
5024373070.6361796.73584344.53620.16480.79980.88930.8564
5121893044.95511768.42264321.48750.09440.82470.77730.8467
5227932671.69281388.64883954.73670.42650.76960.70920.6726
5320742938.16251655.10134221.22380.09340.58770.86990.8035
5426222940.40381654.89784225.90970.31370.90670.62870.804
5522782591.80491305.82983877.78010.31620.48160.61030.6272
5621442648.24751362.20083934.29420.22110.71370.78120.6592
5724272568.61031280.63543856.58520.41470.74090.84630.6135
5821392771.64791287.45874255.8370.20170.67550.62170.698
5918282703.07671132.12434274.02910.13750.75920.78560.657
6020723110.4591496.18654724.73150.10370.94030.89830.8128
6118003784.90822148.09565421.72090.00870.97990.93450.9539

\begin{tabular}{lllllllll}
\hline
Univariate ARIMA Extrapolation Forecast \tabularnewline
time & Y[t] & F[t] & 95% LB & 95% UB & p-value(H0: Y[t] = F[t]) & P(F[t]>Y[t-1]) & P(F[t]>Y[t-s]) & P(F[t]>Y[33]) \tabularnewline
21 & 2570 & - & - & - & - & - & - & - \tabularnewline
22 & 2669 & - & - & - & - & - & - & - \tabularnewline
23 & 2450 & - & - & - & - & - & - & - \tabularnewline
24 & 2842 & - & - & - & - & - & - & - \tabularnewline
25 & 3440 & - & - & - & - & - & - & - \tabularnewline
26 & 2678 & - & - & - & - & - & - & - \tabularnewline
27 & 2981 & - & - & - & - & - & - & - \tabularnewline
28 & 2260 & - & - & - & - & - & - & - \tabularnewline
29 & 2844 & - & - & - & - & - & - & - \tabularnewline
30 & 2546 & - & - & - & - & - & - & - \tabularnewline
31 & 2456 & - & - & - & - & - & - & - \tabularnewline
32 & 2295 & - & - & - & - & - & - & - \tabularnewline
33 & 2379 & - & - & - & - & - & - & - \tabularnewline
34 & 2479 & 2474.0759 & 1827.4407 & 3120.711 & 0.494 & 0.6134 & 0.2773 & 0.6134 \tabularnewline
35 & 2057 & 2452.2097 & 1705.4824 & 3198.937 & 0.1498 & 0.472 & 0.5023 & 0.5762 \tabularnewline
36 & 2280 & 2874.2482 & 2066.0581 & 3682.4383 & 0.0748 & 0.9763 & 0.5312 & 0.8851 \tabularnewline
37 & 2351 & 3472.4753 & 2650.4505 & 4294.5002 & 0.0037 & 0.9978 & 0.5309 & 0.9954 \tabularnewline
38 & 2276 & 2838.5322 & 1997.7344 & 3679.3301 & 0.0949 & 0.8721 & 0.6459 & 0.858 \tabularnewline
39 & 2548 & 2987.8033 & 2146.5136 & 3829.093 & 0.1528 & 0.9514 & 0.5063 & 0.922 \tabularnewline
40 & 2311 & 2501.8132 & 1651.7464 & 3351.88 & 0.33 & 0.4576 & 0.7114 & 0.6115 \tabularnewline
41 & 2201 & 2815.0662 & 1967.7075 & 3662.425 & 0.0777 & 0.8782 & 0.4733 & 0.8434 \tabularnewline
42 & 2725 & 2837.8077 & 1985.1667 & 3690.4488 & 0.3977 & 0.9284 & 0.7488 & 0.8542 \tabularnewline
43 & 2408 & 2402.1942 & 1553.1275 & 3251.261 & 0.4947 & 0.2281 & 0.4506 & 0.5213 \tabularnewline
44 & 2139 & 2609.1248 & 1756.6741 & 3461.5756 & 0.1399 & 0.6781 & 0.7649 & 0.7016 \tabularnewline
45 & 1898 & 2320.6141 & 1471.448 & 3169.7801 & 0.1647 & 0.6625 & 0.4464 & 0.4464 \tabularnewline
46 & 2537 & 2783.8742 & 1675.5476 & 3892.2009 & 0.3312 & 0.9414 & 0.7051 & 0.763 \tabularnewline
47 & 2069 & 2412.4341 & 1222.8894 & 3601.9787 & 0.2857 & 0.4187 & 0.7209 & 0.522 \tabularnewline
48 & 2063 & 3155.2258 & 1913.4941 & 4396.9575 & 0.0424 & 0.9568 & 0.9164 & 0.8898 \tabularnewline
49 & 2524 & 3472.88 & 2215.4766 & 4730.2834 & 0.0696 & 0.986 & 0.9598 & 0.9559 \tabularnewline
50 & 2437 & 3070.636 & 1796.7358 & 4344.5362 & 0.1648 & 0.7998 & 0.8893 & 0.8564 \tabularnewline
51 & 2189 & 3044.9551 & 1768.4226 & 4321.4875 & 0.0944 & 0.8247 & 0.7773 & 0.8467 \tabularnewline
52 & 2793 & 2671.6928 & 1388.6488 & 3954.7367 & 0.4265 & 0.7696 & 0.7092 & 0.6726 \tabularnewline
53 & 2074 & 2938.1625 & 1655.1013 & 4221.2238 & 0.0934 & 0.5877 & 0.8699 & 0.8035 \tabularnewline
54 & 2622 & 2940.4038 & 1654.8978 & 4225.9097 & 0.3137 & 0.9067 & 0.6287 & 0.804 \tabularnewline
55 & 2278 & 2591.8049 & 1305.8298 & 3877.7801 & 0.3162 & 0.4816 & 0.6103 & 0.6272 \tabularnewline
56 & 2144 & 2648.2475 & 1362.2008 & 3934.2942 & 0.2211 & 0.7137 & 0.7812 & 0.6592 \tabularnewline
57 & 2427 & 2568.6103 & 1280.6354 & 3856.5852 & 0.4147 & 0.7409 & 0.8463 & 0.6135 \tabularnewline
58 & 2139 & 2771.6479 & 1287.4587 & 4255.837 & 0.2017 & 0.6755 & 0.6217 & 0.698 \tabularnewline
59 & 1828 & 2703.0767 & 1132.1243 & 4274.0291 & 0.1375 & 0.7592 & 0.7856 & 0.657 \tabularnewline
60 & 2072 & 3110.459 & 1496.1865 & 4724.7315 & 0.1037 & 0.9403 & 0.8983 & 0.8128 \tabularnewline
61 & 1800 & 3784.9082 & 2148.0956 & 5421.7209 & 0.0087 & 0.9799 & 0.9345 & 0.9539 \tabularnewline
\hline
\end{tabular}
%Source: https://freestatistics.org/blog/index.php?pk=67409&T=1

[TABLE]
[ROW][C]Univariate ARIMA Extrapolation Forecast[/C][/ROW]
[ROW][C]time[/C][C]Y[t][/C][C]F[t][/C][C]95% LB[/C][C]95% UB[/C][C]p-value(H0: Y[t] = F[t])[/C][C]P(F[t]>Y[t-1])[/C][C]P(F[t]>Y[t-s])[/C][C]P(F[t]>Y[33])[/C][/ROW]
[ROW][C]21[/C][C]2570[/C][C]-[/C][C]-[/C][C]-[/C][C]-[/C][C]-[/C][C]-[/C][C]-[/C][/ROW]
[ROW][C]22[/C][C]2669[/C][C]-[/C][C]-[/C][C]-[/C][C]-[/C][C]-[/C][C]-[/C][C]-[/C][/ROW]
[ROW][C]23[/C][C]2450[/C][C]-[/C][C]-[/C][C]-[/C][C]-[/C][C]-[/C][C]-[/C][C]-[/C][/ROW]
[ROW][C]24[/C][C]2842[/C][C]-[/C][C]-[/C][C]-[/C][C]-[/C][C]-[/C][C]-[/C][C]-[/C][/ROW]
[ROW][C]25[/C][C]3440[/C][C]-[/C][C]-[/C][C]-[/C][C]-[/C][C]-[/C][C]-[/C][C]-[/C][/ROW]
[ROW][C]26[/C][C]2678[/C][C]-[/C][C]-[/C][C]-[/C][C]-[/C][C]-[/C][C]-[/C][C]-[/C][/ROW]
[ROW][C]27[/C][C]2981[/C][C]-[/C][C]-[/C][C]-[/C][C]-[/C][C]-[/C][C]-[/C][C]-[/C][/ROW]
[ROW][C]28[/C][C]2260[/C][C]-[/C][C]-[/C][C]-[/C][C]-[/C][C]-[/C][C]-[/C][C]-[/C][/ROW]
[ROW][C]29[/C][C]2844[/C][C]-[/C][C]-[/C][C]-[/C][C]-[/C][C]-[/C][C]-[/C][C]-[/C][/ROW]
[ROW][C]30[/C][C]2546[/C][C]-[/C][C]-[/C][C]-[/C][C]-[/C][C]-[/C][C]-[/C][C]-[/C][/ROW]
[ROW][C]31[/C][C]2456[/C][C]-[/C][C]-[/C][C]-[/C][C]-[/C][C]-[/C][C]-[/C][C]-[/C][/ROW]
[ROW][C]32[/C][C]2295[/C][C]-[/C][C]-[/C][C]-[/C][C]-[/C][C]-[/C][C]-[/C][C]-[/C][/ROW]
[ROW][C]33[/C][C]2379[/C][C]-[/C][C]-[/C][C]-[/C][C]-[/C][C]-[/C][C]-[/C][C]-[/C][/ROW]
[ROW][C]34[/C][C]2479[/C][C]2474.0759[/C][C]1827.4407[/C][C]3120.711[/C][C]0.494[/C][C]0.6134[/C][C]0.2773[/C][C]0.6134[/C][/ROW]
[ROW][C]35[/C][C]2057[/C][C]2452.2097[/C][C]1705.4824[/C][C]3198.937[/C][C]0.1498[/C][C]0.472[/C][C]0.5023[/C][C]0.5762[/C][/ROW]
[ROW][C]36[/C][C]2280[/C][C]2874.2482[/C][C]2066.0581[/C][C]3682.4383[/C][C]0.0748[/C][C]0.9763[/C][C]0.5312[/C][C]0.8851[/C][/ROW]
[ROW][C]37[/C][C]2351[/C][C]3472.4753[/C][C]2650.4505[/C][C]4294.5002[/C][C]0.0037[/C][C]0.9978[/C][C]0.5309[/C][C]0.9954[/C][/ROW]
[ROW][C]38[/C][C]2276[/C][C]2838.5322[/C][C]1997.7344[/C][C]3679.3301[/C][C]0.0949[/C][C]0.8721[/C][C]0.6459[/C][C]0.858[/C][/ROW]
[ROW][C]39[/C][C]2548[/C][C]2987.8033[/C][C]2146.5136[/C][C]3829.093[/C][C]0.1528[/C][C]0.9514[/C][C]0.5063[/C][C]0.922[/C][/ROW]
[ROW][C]40[/C][C]2311[/C][C]2501.8132[/C][C]1651.7464[/C][C]3351.88[/C][C]0.33[/C][C]0.4576[/C][C]0.7114[/C][C]0.6115[/C][/ROW]
[ROW][C]41[/C][C]2201[/C][C]2815.0662[/C][C]1967.7075[/C][C]3662.425[/C][C]0.0777[/C][C]0.8782[/C][C]0.4733[/C][C]0.8434[/C][/ROW]
[ROW][C]42[/C][C]2725[/C][C]2837.8077[/C][C]1985.1667[/C][C]3690.4488[/C][C]0.3977[/C][C]0.9284[/C][C]0.7488[/C][C]0.8542[/C][/ROW]
[ROW][C]43[/C][C]2408[/C][C]2402.1942[/C][C]1553.1275[/C][C]3251.261[/C][C]0.4947[/C][C]0.2281[/C][C]0.4506[/C][C]0.5213[/C][/ROW]
[ROW][C]44[/C][C]2139[/C][C]2609.1248[/C][C]1756.6741[/C][C]3461.5756[/C][C]0.1399[/C][C]0.6781[/C][C]0.7649[/C][C]0.7016[/C][/ROW]
[ROW][C]45[/C][C]1898[/C][C]2320.6141[/C][C]1471.448[/C][C]3169.7801[/C][C]0.1647[/C][C]0.6625[/C][C]0.4464[/C][C]0.4464[/C][/ROW]
[ROW][C]46[/C][C]2537[/C][C]2783.8742[/C][C]1675.5476[/C][C]3892.2009[/C][C]0.3312[/C][C]0.9414[/C][C]0.7051[/C][C]0.763[/C][/ROW]
[ROW][C]47[/C][C]2069[/C][C]2412.4341[/C][C]1222.8894[/C][C]3601.9787[/C][C]0.2857[/C][C]0.4187[/C][C]0.7209[/C][C]0.522[/C][/ROW]
[ROW][C]48[/C][C]2063[/C][C]3155.2258[/C][C]1913.4941[/C][C]4396.9575[/C][C]0.0424[/C][C]0.9568[/C][C]0.9164[/C][C]0.8898[/C][/ROW]
[ROW][C]49[/C][C]2524[/C][C]3472.88[/C][C]2215.4766[/C][C]4730.2834[/C][C]0.0696[/C][C]0.986[/C][C]0.9598[/C][C]0.9559[/C][/ROW]
[ROW][C]50[/C][C]2437[/C][C]3070.636[/C][C]1796.7358[/C][C]4344.5362[/C][C]0.1648[/C][C]0.7998[/C][C]0.8893[/C][C]0.8564[/C][/ROW]
[ROW][C]51[/C][C]2189[/C][C]3044.9551[/C][C]1768.4226[/C][C]4321.4875[/C][C]0.0944[/C][C]0.8247[/C][C]0.7773[/C][C]0.8467[/C][/ROW]
[ROW][C]52[/C][C]2793[/C][C]2671.6928[/C][C]1388.6488[/C][C]3954.7367[/C][C]0.4265[/C][C]0.7696[/C][C]0.7092[/C][C]0.6726[/C][/ROW]
[ROW][C]53[/C][C]2074[/C][C]2938.1625[/C][C]1655.1013[/C][C]4221.2238[/C][C]0.0934[/C][C]0.5877[/C][C]0.8699[/C][C]0.8035[/C][/ROW]
[ROW][C]54[/C][C]2622[/C][C]2940.4038[/C][C]1654.8978[/C][C]4225.9097[/C][C]0.3137[/C][C]0.9067[/C][C]0.6287[/C][C]0.804[/C][/ROW]
[ROW][C]55[/C][C]2278[/C][C]2591.8049[/C][C]1305.8298[/C][C]3877.7801[/C][C]0.3162[/C][C]0.4816[/C][C]0.6103[/C][C]0.6272[/C][/ROW]
[ROW][C]56[/C][C]2144[/C][C]2648.2475[/C][C]1362.2008[/C][C]3934.2942[/C][C]0.2211[/C][C]0.7137[/C][C]0.7812[/C][C]0.6592[/C][/ROW]
[ROW][C]57[/C][C]2427[/C][C]2568.6103[/C][C]1280.6354[/C][C]3856.5852[/C][C]0.4147[/C][C]0.7409[/C][C]0.8463[/C][C]0.6135[/C][/ROW]
[ROW][C]58[/C][C]2139[/C][C]2771.6479[/C][C]1287.4587[/C][C]4255.837[/C][C]0.2017[/C][C]0.6755[/C][C]0.6217[/C][C]0.698[/C][/ROW]
[ROW][C]59[/C][C]1828[/C][C]2703.0767[/C][C]1132.1243[/C][C]4274.0291[/C][C]0.1375[/C][C]0.7592[/C][C]0.7856[/C][C]0.657[/C][/ROW]
[ROW][C]60[/C][C]2072[/C][C]3110.459[/C][C]1496.1865[/C][C]4724.7315[/C][C]0.1037[/C][C]0.9403[/C][C]0.8983[/C][C]0.8128[/C][/ROW]
[ROW][C]61[/C][C]1800[/C][C]3784.9082[/C][C]2148.0956[/C][C]5421.7209[/C][C]0.0087[/C][C]0.9799[/C][C]0.9345[/C][C]0.9539[/C][/ROW]
[/TABLE]
Source: https://freestatistics.org/blog/index.php?pk=67409&T=1

Globally Unique Identifier (entire table): ba.freestatistics.org/blog/index.php?pk=67409&T=1

As an alternative you can also use a QR Code:  

The GUIDs for individual cells are displayed in the table below:

Univariate ARIMA Extrapolation Forecast
timeY[t]F[t]95% LB95% UBp-value(H0: Y[t] = F[t])P(F[t]>Y[t-1])P(F[t]>Y[t-s])P(F[t]>Y[33])
212570-------
222669-------
232450-------
242842-------
253440-------
262678-------
272981-------
282260-------
292844-------
302546-------
312456-------
322295-------
332379-------
3424792474.07591827.44073120.7110.4940.61340.27730.6134
3520572452.20971705.48243198.9370.14980.4720.50230.5762
3622802874.24822066.05813682.43830.07480.97630.53120.8851
3723513472.47532650.45054294.50020.00370.99780.53090.9954
3822762838.53221997.73443679.33010.09490.87210.64590.858
3925482987.80332146.51363829.0930.15280.95140.50630.922
4023112501.81321651.74643351.880.330.45760.71140.6115
4122012815.06621967.70753662.4250.07770.87820.47330.8434
4227252837.80771985.16673690.44880.39770.92840.74880.8542
4324082402.19421553.12753251.2610.49470.22810.45060.5213
4421392609.12481756.67413461.57560.13990.67810.76490.7016
4518982320.61411471.4483169.78010.16470.66250.44640.4464
4625372783.87421675.54763892.20090.33120.94140.70510.763
4720692412.43411222.88943601.97870.28570.41870.72090.522
4820633155.22581913.49414396.95750.04240.95680.91640.8898
4925243472.882215.47664730.28340.06960.9860.95980.9559
5024373070.6361796.73584344.53620.16480.79980.88930.8564
5121893044.95511768.42264321.48750.09440.82470.77730.8467
5227932671.69281388.64883954.73670.42650.76960.70920.6726
5320742938.16251655.10134221.22380.09340.58770.86990.8035
5426222940.40381654.89784225.90970.31370.90670.62870.804
5522782591.80491305.82983877.78010.31620.48160.61030.6272
5621442648.24751362.20083934.29420.22110.71370.78120.6592
5724272568.61031280.63543856.58520.41470.74090.84630.6135
5821392771.64791287.45874255.8370.20170.67550.62170.698
5918282703.07671132.12434274.02910.13750.75920.78560.657
6020723110.4591496.18654724.73150.10370.94030.89830.8128
6118003784.90822148.09565421.72090.00870.97990.93450.9539


Univariate ARIMA Extrapolation Forecast Performance
time% S.E.PEMAPESq.EMSERMSE
340.13330.002024.24700
350.1554-0.16120.0816156190.713578107.4803279.4772
360.1435-0.20670.1233353130.9093169781.9566412.0461
370.1208-0.3230.17321257706.9219441763.1979664.6527
380.1511-0.19820.1782316442.5019416699.0587645.5223
390.1437-0.14720.173193426.9369379487.0384616.0252
400.1734-0.07630.159236409.6926330475.989574.8704
410.1536-0.21810.1666377077.358336301.1601579.9148
420.1533-0.03980.152512725.583300348.3182548.0404
430.18030.00240.137533.7067270316.8571519.92
440.1667-0.18020.1414221017.372265835.0857515.592
450.1867-0.18210.1448178602.6624258565.7171508.4936
460.2031-0.08870.140460946.8926243364.2691493.3196
470.2516-0.14240.1406117946.9524234405.8893484.1548
480.2008-0.34620.15431192957.146298309.3064546.177
490.1847-0.27320.1617900373.2176335938.3009579.6018
500.2117-0.20640.1643401494.5926339794.5533582.919
510.2139-0.28110.1708732659.1156361620.3623601.3488
520.2450.04540.164214715.4441343362.2087585.9712
530.2228-0.29410.1707746776.9065363532.9436602.9369
540.2231-0.10830.1678101380.9602351049.5158592.4943
550.2531-0.12110.165698473.5448339568.7899582.7253
560.2478-0.19040.1667254265.5128335859.9518579.5343
570.2558-0.05510.162120053.4848322701.349568.0681
580.2732-0.22830.1647400243.316325803.0276570.7916
590.2965-0.32370.1708765759.1917342724.4186585.4267
600.2648-0.33390.17691078397.1331369971.5561608.2529
610.2206-0.52440.18933939860.742497467.5985705.3138

\begin{tabular}{lllllllll}
\hline
Univariate ARIMA Extrapolation Forecast Performance \tabularnewline
time & % S.E. & PE & MAPE & Sq.E & MSE & RMSE \tabularnewline
34 & 0.1333 & 0.002 & 0 & 24.247 & 0 & 0 \tabularnewline
35 & 0.1554 & -0.1612 & 0.0816 & 156190.7135 & 78107.4803 & 279.4772 \tabularnewline
36 & 0.1435 & -0.2067 & 0.1233 & 353130.9093 & 169781.9566 & 412.0461 \tabularnewline
37 & 0.1208 & -0.323 & 0.1732 & 1257706.9219 & 441763.1979 & 664.6527 \tabularnewline
38 & 0.1511 & -0.1982 & 0.1782 & 316442.5019 & 416699.0587 & 645.5223 \tabularnewline
39 & 0.1437 & -0.1472 & 0.173 & 193426.9369 & 379487.0384 & 616.0252 \tabularnewline
40 & 0.1734 & -0.0763 & 0.1592 & 36409.6926 & 330475.989 & 574.8704 \tabularnewline
41 & 0.1536 & -0.2181 & 0.1666 & 377077.358 & 336301.1601 & 579.9148 \tabularnewline
42 & 0.1533 & -0.0398 & 0.1525 & 12725.583 & 300348.3182 & 548.0404 \tabularnewline
43 & 0.1803 & 0.0024 & 0.1375 & 33.7067 & 270316.8571 & 519.92 \tabularnewline
44 & 0.1667 & -0.1802 & 0.1414 & 221017.372 & 265835.0857 & 515.592 \tabularnewline
45 & 0.1867 & -0.1821 & 0.1448 & 178602.6624 & 258565.7171 & 508.4936 \tabularnewline
46 & 0.2031 & -0.0887 & 0.1404 & 60946.8926 & 243364.2691 & 493.3196 \tabularnewline
47 & 0.2516 & -0.1424 & 0.1406 & 117946.9524 & 234405.8893 & 484.1548 \tabularnewline
48 & 0.2008 & -0.3462 & 0.1543 & 1192957.146 & 298309.3064 & 546.177 \tabularnewline
49 & 0.1847 & -0.2732 & 0.1617 & 900373.2176 & 335938.3009 & 579.6018 \tabularnewline
50 & 0.2117 & -0.2064 & 0.1643 & 401494.5926 & 339794.5533 & 582.919 \tabularnewline
51 & 0.2139 & -0.2811 & 0.1708 & 732659.1156 & 361620.3623 & 601.3488 \tabularnewline
52 & 0.245 & 0.0454 & 0.1642 & 14715.4441 & 343362.2087 & 585.9712 \tabularnewline
53 & 0.2228 & -0.2941 & 0.1707 & 746776.9065 & 363532.9436 & 602.9369 \tabularnewline
54 & 0.2231 & -0.1083 & 0.1678 & 101380.9602 & 351049.5158 & 592.4943 \tabularnewline
55 & 0.2531 & -0.1211 & 0.1656 & 98473.5448 & 339568.7899 & 582.7253 \tabularnewline
56 & 0.2478 & -0.1904 & 0.1667 & 254265.5128 & 335859.9518 & 579.5343 \tabularnewline
57 & 0.2558 & -0.0551 & 0.1621 & 20053.4848 & 322701.349 & 568.0681 \tabularnewline
58 & 0.2732 & -0.2283 & 0.1647 & 400243.316 & 325803.0276 & 570.7916 \tabularnewline
59 & 0.2965 & -0.3237 & 0.1708 & 765759.1917 & 342724.4186 & 585.4267 \tabularnewline
60 & 0.2648 & -0.3339 & 0.1769 & 1078397.1331 & 369971.5561 & 608.2529 \tabularnewline
61 & 0.2206 & -0.5244 & 0.1893 & 3939860.742 & 497467.5985 & 705.3138 \tabularnewline
\hline
\end{tabular}
%Source: https://freestatistics.org/blog/index.php?pk=67409&T=2

[TABLE]
[ROW][C]Univariate ARIMA Extrapolation Forecast Performance[/C][/ROW]
[ROW][C]time[/C][C]% S.E.[/C][C]PE[/C][C]MAPE[/C][C]Sq.E[/C][C]MSE[/C][C]RMSE[/C][/ROW]
[ROW][C]34[/C][C]0.1333[/C][C]0.002[/C][C]0[/C][C]24.247[/C][C]0[/C][C]0[/C][/ROW]
[ROW][C]35[/C][C]0.1554[/C][C]-0.1612[/C][C]0.0816[/C][C]156190.7135[/C][C]78107.4803[/C][C]279.4772[/C][/ROW]
[ROW][C]36[/C][C]0.1435[/C][C]-0.2067[/C][C]0.1233[/C][C]353130.9093[/C][C]169781.9566[/C][C]412.0461[/C][/ROW]
[ROW][C]37[/C][C]0.1208[/C][C]-0.323[/C][C]0.1732[/C][C]1257706.9219[/C][C]441763.1979[/C][C]664.6527[/C][/ROW]
[ROW][C]38[/C][C]0.1511[/C][C]-0.1982[/C][C]0.1782[/C][C]316442.5019[/C][C]416699.0587[/C][C]645.5223[/C][/ROW]
[ROW][C]39[/C][C]0.1437[/C][C]-0.1472[/C][C]0.173[/C][C]193426.9369[/C][C]379487.0384[/C][C]616.0252[/C][/ROW]
[ROW][C]40[/C][C]0.1734[/C][C]-0.0763[/C][C]0.1592[/C][C]36409.6926[/C][C]330475.989[/C][C]574.8704[/C][/ROW]
[ROW][C]41[/C][C]0.1536[/C][C]-0.2181[/C][C]0.1666[/C][C]377077.358[/C][C]336301.1601[/C][C]579.9148[/C][/ROW]
[ROW][C]42[/C][C]0.1533[/C][C]-0.0398[/C][C]0.1525[/C][C]12725.583[/C][C]300348.3182[/C][C]548.0404[/C][/ROW]
[ROW][C]43[/C][C]0.1803[/C][C]0.0024[/C][C]0.1375[/C][C]33.7067[/C][C]270316.8571[/C][C]519.92[/C][/ROW]
[ROW][C]44[/C][C]0.1667[/C][C]-0.1802[/C][C]0.1414[/C][C]221017.372[/C][C]265835.0857[/C][C]515.592[/C][/ROW]
[ROW][C]45[/C][C]0.1867[/C][C]-0.1821[/C][C]0.1448[/C][C]178602.6624[/C][C]258565.7171[/C][C]508.4936[/C][/ROW]
[ROW][C]46[/C][C]0.2031[/C][C]-0.0887[/C][C]0.1404[/C][C]60946.8926[/C][C]243364.2691[/C][C]493.3196[/C][/ROW]
[ROW][C]47[/C][C]0.2516[/C][C]-0.1424[/C][C]0.1406[/C][C]117946.9524[/C][C]234405.8893[/C][C]484.1548[/C][/ROW]
[ROW][C]48[/C][C]0.2008[/C][C]-0.3462[/C][C]0.1543[/C][C]1192957.146[/C][C]298309.3064[/C][C]546.177[/C][/ROW]
[ROW][C]49[/C][C]0.1847[/C][C]-0.2732[/C][C]0.1617[/C][C]900373.2176[/C][C]335938.3009[/C][C]579.6018[/C][/ROW]
[ROW][C]50[/C][C]0.2117[/C][C]-0.2064[/C][C]0.1643[/C][C]401494.5926[/C][C]339794.5533[/C][C]582.919[/C][/ROW]
[ROW][C]51[/C][C]0.2139[/C][C]-0.2811[/C][C]0.1708[/C][C]732659.1156[/C][C]361620.3623[/C][C]601.3488[/C][/ROW]
[ROW][C]52[/C][C]0.245[/C][C]0.0454[/C][C]0.1642[/C][C]14715.4441[/C][C]343362.2087[/C][C]585.9712[/C][/ROW]
[ROW][C]53[/C][C]0.2228[/C][C]-0.2941[/C][C]0.1707[/C][C]746776.9065[/C][C]363532.9436[/C][C]602.9369[/C][/ROW]
[ROW][C]54[/C][C]0.2231[/C][C]-0.1083[/C][C]0.1678[/C][C]101380.9602[/C][C]351049.5158[/C][C]592.4943[/C][/ROW]
[ROW][C]55[/C][C]0.2531[/C][C]-0.1211[/C][C]0.1656[/C][C]98473.5448[/C][C]339568.7899[/C][C]582.7253[/C][/ROW]
[ROW][C]56[/C][C]0.2478[/C][C]-0.1904[/C][C]0.1667[/C][C]254265.5128[/C][C]335859.9518[/C][C]579.5343[/C][/ROW]
[ROW][C]57[/C][C]0.2558[/C][C]-0.0551[/C][C]0.1621[/C][C]20053.4848[/C][C]322701.349[/C][C]568.0681[/C][/ROW]
[ROW][C]58[/C][C]0.2732[/C][C]-0.2283[/C][C]0.1647[/C][C]400243.316[/C][C]325803.0276[/C][C]570.7916[/C][/ROW]
[ROW][C]59[/C][C]0.2965[/C][C]-0.3237[/C][C]0.1708[/C][C]765759.1917[/C][C]342724.4186[/C][C]585.4267[/C][/ROW]
[ROW][C]60[/C][C]0.2648[/C][C]-0.3339[/C][C]0.1769[/C][C]1078397.1331[/C][C]369971.5561[/C][C]608.2529[/C][/ROW]
[ROW][C]61[/C][C]0.2206[/C][C]-0.5244[/C][C]0.1893[/C][C]3939860.742[/C][C]497467.5985[/C][C]705.3138[/C][/ROW]
[/TABLE]
Source: https://freestatistics.org/blog/index.php?pk=67409&T=2

Globally Unique Identifier (entire table): ba.freestatistics.org/blog/index.php?pk=67409&T=2

As an alternative you can also use a QR Code:  

The GUIDs for individual cells are displayed in the table below:

Univariate ARIMA Extrapolation Forecast Performance
time% S.E.PEMAPESq.EMSERMSE
340.13330.002024.24700
350.1554-0.16120.0816156190.713578107.4803279.4772
360.1435-0.20670.1233353130.9093169781.9566412.0461
370.1208-0.3230.17321257706.9219441763.1979664.6527
380.1511-0.19820.1782316442.5019416699.0587645.5223
390.1437-0.14720.173193426.9369379487.0384616.0252
400.1734-0.07630.159236409.6926330475.989574.8704
410.1536-0.21810.1666377077.358336301.1601579.9148
420.1533-0.03980.152512725.583300348.3182548.0404
430.18030.00240.137533.7067270316.8571519.92
440.1667-0.18020.1414221017.372265835.0857515.592
450.1867-0.18210.1448178602.6624258565.7171508.4936
460.2031-0.08870.140460946.8926243364.2691493.3196
470.2516-0.14240.1406117946.9524234405.8893484.1548
480.2008-0.34620.15431192957.146298309.3064546.177
490.1847-0.27320.1617900373.2176335938.3009579.6018
500.2117-0.20640.1643401494.5926339794.5533582.919
510.2139-0.28110.1708732659.1156361620.3623601.3488
520.2450.04540.164214715.4441343362.2087585.9712
530.2228-0.29410.1707746776.9065363532.9436602.9369
540.2231-0.10830.1678101380.9602351049.5158592.4943
550.2531-0.12110.165698473.5448339568.7899582.7253
560.2478-0.19040.1667254265.5128335859.9518579.5343
570.2558-0.05510.162120053.4848322701.349568.0681
580.2732-0.22830.1647400243.316325803.0276570.7916
590.2965-0.32370.1708765759.1917342724.4186585.4267
600.2648-0.33390.17691078397.1331369971.5561608.2529
610.2206-0.52440.18933939860.742497467.5985705.3138


Parameters (Session):
par1 = 12 ; par2 = 1 ; par3 = 1 ; par4 = 1 ; par5 = 12 ; par6 = 1 ; par7 = 1 ; par8 = 0 ; par9 = 0 ; par10 = FALSE ;
Parameters (R input):
par1 = 12 ; par2 = 1 ; par3 = 1 ; par4 = 1 ; par5 = 12 ; par6 = 1 ; par7 = 1 ; par8 = 0 ; par9 = 0 ; par10 = FALSE ;
R code (references can be found in the software module):
par1 <- as.numeric(par1) #cut off periods
par1 <- 28
par2 <- as.numeric(par2) #lambda
par3 <- as.numeric(par3) #degree of non-seasonal differencing
par4 <- as.numeric(par4) #degree of seasonal differencing
par5 <- as.numeric(par5) #seasonal period
par6 <- as.numeric(par6) #p
par6 <- 3
par7 <- as.numeric(par7) #q
par7 <- 3
par8 <- as.numeric(par8) #P
par9 <- as.numeric(par9) #Q
if (par10 == 'TRUE') par10 <- TRUE
if (par10 == 'FALSE') par10 <- FALSE
if (par2 == 0) x <- log(x)
if (par2 != 0) x <- x^par2
lx <- length(x)
first <- lx - 2*par1
nx <- lx - par1
nx1 <- nx + 1
fx <- lx - nx
if (fx < 1) {
fx <- par5
nx1 <- lx + fx - 1
first <- lx - 2*fx
}
first <- 1
if (fx < 3) fx <- round(lx/10,0)
(arima.out <- arima(x[1:nx], order=c(par6,par3,par7), seasonal=list(order=c(par8,par4,par9), period=par5), include.mean=par10, method='ML'))
(forecast <- predict(arima.out,par1))
(lb <- forecast$pred - 1.96 * forecast$se)
(ub <- forecast$pred + 1.96 * forecast$se)
if (par2 == 0) {
x <- exp(x)
forecast$pred <- exp(forecast$pred)
lb <- exp(lb)
ub <- exp(ub)
}
if (par2 != 0) {
x <- x^(1/par2)
forecast$pred <- forecast$pred^(1/par2)
lb <- lb^(1/par2)
ub <- ub^(1/par2)
}
if (par2 < 0) {
olb <- lb
lb <- ub
ub <- olb
}
(actandfor <- c(x[1:nx], forecast$pred))
(perc.se <- (ub-forecast$pred)/1.96/forecast$pred)
bitmap(file='test1.png')
opar <- par(mar=c(4,4,2,2),las=1)
ylim <- c( min(x[first:nx],lb), max(x[first:nx],ub))
plot(x,ylim=ylim,type='n',xlim=c(first,lx))
usr <- par('usr')
rect(usr[1],usr[3],nx+1,usr[4],border=NA,col='lemonchiffon')
rect(nx1,usr[3],usr[2],usr[4],border=NA,col='lavender')
abline(h= (-3:3)*2 , col ='gray', lty =3)
polygon( c(nx1:lx,lx:nx1), c(lb,rev(ub)), col = 'orange', lty=2,border=NA)
lines(nx1:lx, lb , lty=2)
lines(nx1:lx, ub , lty=2)
lines(x, lwd=2)
lines(nx1:lx, forecast$pred , lwd=2 , col ='white')
box()
par(opar)
dev.off()
prob.dec <- array(NA, dim=fx)
prob.sdec <- array(NA, dim=fx)
prob.ldec <- array(NA, dim=fx)
prob.pval <- array(NA, dim=fx)
perf.pe <- array(0, dim=fx)
perf.mape <- array(0, dim=fx)
perf.mape1 <- array(0, dim=fx)
perf.se <- array(0, dim=fx)
perf.mse <- array(0, dim=fx)
perf.mse1 <- array(0, dim=fx)
perf.rmse <- array(0, dim=fx)
for (i in 1:fx) {
locSD <- (ub[i] - forecast$pred[i]) / 1.96
perf.pe[i] = (x[nx+i] - forecast$pred[i]) / forecast$pred[i]
perf.se[i] = (x[nx+i] - forecast$pred[i])^2
prob.dec[i] = pnorm((x[nx+i-1] - forecast$pred[i]) / locSD)
prob.sdec[i] = pnorm((x[nx+i-par5] - forecast$pred[i]) / locSD)
prob.ldec[i] = pnorm((x[nx] - forecast$pred[i]) / locSD)
prob.pval[i] = pnorm(abs(x[nx+i] - forecast$pred[i]) / locSD)
}
perf.mape[1] = abs(perf.pe[1])
perf.mse[1] = abs(perf.se[1])
for (i in 2:fx) {
perf.mape[i] = perf.mape[i-1] + abs(perf.pe[i])
perf.mape1[i] = perf.mape[i] / i
perf.mse[i] = perf.mse[i-1] + perf.se[i]
perf.mse1[i] = perf.mse[i] / i
}
perf.rmse = sqrt(perf.mse1)
bitmap(file='test2.png')
plot(forecast$pred, pch=19, type='b',main='ARIMA Extrapolation Forecast', ylab='Forecast and 95% CI', xlab='time',ylim=c(min(lb),max(ub)))
dum <- forecast$pred
dum[1:par1] <- x[(nx+1):lx]
lines(dum, lty=1)
lines(ub,lty=3)
lines(lb,lty=3)
dev.off()
load(file='createtable')
a<-table.start()
a<-table.row.start(a)
a<-table.element(a,'Univariate ARIMA Extrapolation Forecast',9,TRUE)
a<-table.row.end(a)
a<-table.row.start(a)
a<-table.element(a,'time',1,header=TRUE)
a<-table.element(a,'Y[t]',1,header=TRUE)
a<-table.element(a,'F[t]',1,header=TRUE)
a<-table.element(a,'95% LB',1,header=TRUE)
a<-table.element(a,'95% UB',1,header=TRUE)
a<-table.element(a,'p-value
(H0: Y[t] = F[t])',1,header=TRUE)
a<-table.element(a,'P(F[t]>Y[t-1])',1,header=TRUE)
a<-table.element(a,'P(F[t]>Y[t-s])',1,header=TRUE)
mylab <- paste('P(F[t]>Y[',nx,sep='')
mylab <- paste(mylab,'])',sep='')
a<-table.element(a,mylab,1,header=TRUE)
a<-table.row.end(a)
for (i in (nx-par5):nx) {
a<-table.row.start(a)
a<-table.element(a,i,header=TRUE)
a<-table.element(a,x[i])
a<-table.element(a,'-')
a<-table.row.end(a)
}
for (i in 1:fx) {
a<-table.row.start(a)
a<-table.element(a,nx+i,header=TRUE)
a<-table.element(a,round(x[nx+i],4))
a<-table.element(a,round(forecast$pred[i],4))
a<-table.element(a,round(lb[i],4))
a<-table.element(a,round(ub[i],4))
a<-table.element(a,round((1-prob.pval[i]),4))
a<-table.element(a,round((1-prob.dec[i]),4))
a<-table.element(a,round((1-prob.sdec[i]),4))
a<-table.element(a,round((1-prob.ldec[i]),4))
a<-table.row.end(a)
}
a<-table.end(a)
table.save(a,file='mytable.tab')
a<-table.start()
a<-table.row.start(a)
a<-table.element(a,'Univariate ARIMA Extrapolation Forecast Performance',7,TRUE)
a<-table.row.end(a)
a<-table.row.start(a)
a<-table.element(a,'time',1,header=TRUE)
a<-table.element(a,'% S.E.',1,header=TRUE)
a<-table.element(a,'PE',1,header=TRUE)
a<-table.element(a,'MAPE',1,header=TRUE)
a<-table.element(a,'Sq.E',1,header=TRUE)
a<-table.element(a,'MSE',1,header=TRUE)
a<-table.element(a,'RMSE',1,header=TRUE)
a<-table.row.end(a)
for (i in 1:fx) {
a<-table.row.start(a)
a<-table.element(a,nx+i,header=TRUE)
a<-table.element(a,round(perc.se[i],4))
a<-table.element(a,round(perf.pe[i],4))
a<-table.element(a,round(perf.mape1[i],4))
a<-table.element(a,round(perf.se[i],4))
a<-table.element(a,round(perf.mse1[i],4))
a<-table.element(a,round(perf.rmse[i],4))
a<-table.row.end(a)
}
a<-table.end(a)
table.save(a,file='mytable1.tab')