Free Statistics

of Irreproducible Research!

Author's title

Author*The author of this computation has been verified*
R Software Modulerwasp_autocorrelation.wasp
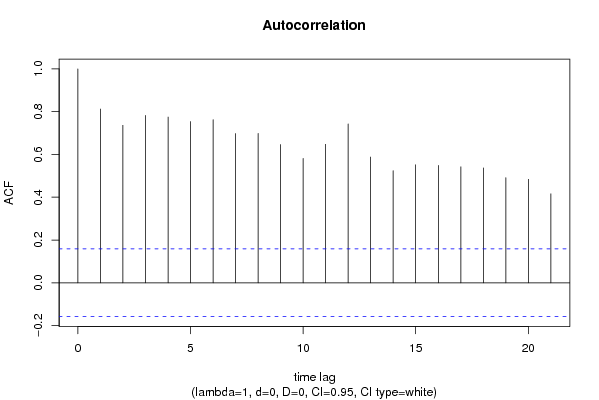
Title produced by software(Partial) Autocorrelation Function
Date of computationMon, 14 Dec 2009 02:39:23 -0700
Cite this page as followsStatistical Computations at FreeStatistics.org, Office for Research Development and Education, URL https://freestatistics.org/blog/index.php?v=date/2009/Dec/14/t1260783801j1pejmmfby1his2.htm/, Retrieved Sun, 05 May 2024 19:03:40 +0000
Statistical Computations at FreeStatistics.org, Office for Research Development and Education, URL https://freestatistics.org/blog/index.php?pk=67475, Retrieved Sun, 05 May 2024 19:03:40 +0000
QR Codes:

Original text written by user:
IsPrivate?No (this computation is public)
User-defined keywords
Estimated Impact150
Family? (F = Feedback message, R = changed R code, M = changed R Module, P = changed Parameters, D = changed Data)
-     [Variance Reduction Matrix] [VRM invoer] [2008-12-17 15:09:52] [74be16979710d4c4e7c6647856088456]
- RMPD    [(Partial) Autocorrelation Function] [Autocorrelation F...] [2009-12-14 09:39:23] [91da2e1ebdd83187f2515f461585cbee] [Current]
Feedback Forum

Post a new message
Dataseries X:
7988.8
8243.5
8843
9092.7
8246.7
9311.7
8341.2
7116.7
9635.7
9815.4
8611.3
8297.8
8715.1
8919.9
10085.8
9511.7
8991.3
10311.2
8895.4
7449.8
10084
9859.4
9100.1
8920.8
8502.7
8599.6
10394.4
9290.4
8742.2
10217.3
8639
8139.6
10779.1
10427.7
10349.1
10036.4
9492.1
10638.8
12054.5
10324.7
11817.3
11008.9
9996.6
9419.5
11958.8
12594.6
11890.6
10871.7
11835.7
11542.2
13093.7
11180.2
12035.7
12112
10875.2
9897.3
11672.1
12385.7
11405.6
9830.9
11025.1
10853.8
12252.6
11839.4
11669.1
11601.4
11178.4
9516.4
12102.8
12989
11610.2
10205.5
11356.2
11307.1
12648.6
11947.2
11714.1
12192.5
11268.8
9097.4
12639.8
13040.1
11687.3
11191.7
11391.9
11793.1
13933.2
12778.1
11810.3
13698.4
11956.6
10723.8
13938.9
13979.8
13807.4
12973.9
12509.8
12934.1
14908.3
13772.1
13012.6
14049.9
11816.5
11593.2
14466.2
13615.9
14733.9
13880.7
13527.5
13584
16170.2
13260.6
14741.9
15486.5
13154.5
12621.2
15031.6
15452.4
15428
13105.9
14716.8
14180
16202.2
14392.4
15140.6
15960.1
14351.3
13230.2
15202.1
17056
16077.7
13348.2
16402.4
16559.1
16579
17561.2
16129.6
18484.3
16402.6
14032.3
17109.1
17157.2
13879.8
12362.4
12683.5
12608.8
13583.7
12846.3
12347.1
13967
13214.7
11818.8
15394.8


Summary of computational transaction
Raw Inputview raw input (R code)
Raw Outputview raw output of R engine
Computing time1 seconds
R Server'Gwilym Jenkins' @ 72.249.127.135

\begin{tabular}{lllllllll}
\hline
Summary of computational transaction \tabularnewline
Raw Input & view raw input (R code)  \tabularnewline
Raw Output & view raw output of R engine  \tabularnewline
Computing time & 1 seconds \tabularnewline
R Server & 'Gwilym Jenkins' @ 72.249.127.135 \tabularnewline
\hline
\end{tabular}
%Source: https://freestatistics.org/blog/index.php?pk=67475&T=0

[TABLE]
[ROW][C]Summary of computational transaction[/C][/ROW]
[ROW][C]Raw Input[/C][C]view raw input (R code) [/C][/ROW]
[ROW][C]Raw Output[/C][C]view raw output of R engine [/C][/ROW]
[ROW][C]Computing time[/C][C]1 seconds[/C][/ROW]
[ROW][C]R Server[/C][C]'Gwilym Jenkins' @ 72.249.127.135[/C][/ROW]
[/TABLE]
Source: https://freestatistics.org/blog/index.php?pk=67475&T=0

Globally Unique Identifier (entire table): ba.freestatistics.org/blog/index.php?pk=67475&T=0

As an alternative you can also use a QR Code:  

The GUIDs for individual cells are displayed in the table below:

Summary of computational transaction
Raw Inputview raw input (R code)
Raw Outputview raw output of R engine
Computing time1 seconds
R Server'Gwilym Jenkins' @ 72.249.127.135


Autocorrelation Function
Time lag kACF(k)T-STATP-value
10.81248710.04990
20.7363549.10820
30.7823149.67670
40.7748189.5840
50.7539049.32530
60.7626279.43320
70.6979658.63340
80.6981558.63570
90.6463457.99480
100.5813137.19040
110.6477218.01190
120.7425689.18510
130.5877067.26950
140.524346.48570
150.5516266.82320
160.5487686.78790
170.542586.71130
180.5371016.64360
190.4912196.0760
200.4841265.98830
210.4162675.14890

\begin{tabular}{lllllllll}
\hline
Autocorrelation Function \tabularnewline
Time lag k & ACF(k) & T-STAT & P-value \tabularnewline
1 & 0.812487 & 10.0499 & 0 \tabularnewline
2 & 0.736354 & 9.1082 & 0 \tabularnewline
3 & 0.782314 & 9.6767 & 0 \tabularnewline
4 & 0.774818 & 9.584 & 0 \tabularnewline
5 & 0.753904 & 9.3253 & 0 \tabularnewline
6 & 0.762627 & 9.4332 & 0 \tabularnewline
7 & 0.697965 & 8.6334 & 0 \tabularnewline
8 & 0.698155 & 8.6357 & 0 \tabularnewline
9 & 0.646345 & 7.9948 & 0 \tabularnewline
10 & 0.581313 & 7.1904 & 0 \tabularnewline
11 & 0.647721 & 8.0119 & 0 \tabularnewline
12 & 0.742568 & 9.1851 & 0 \tabularnewline
13 & 0.587706 & 7.2695 & 0 \tabularnewline
14 & 0.52434 & 6.4857 & 0 \tabularnewline
15 & 0.551626 & 6.8232 & 0 \tabularnewline
16 & 0.548768 & 6.7879 & 0 \tabularnewline
17 & 0.54258 & 6.7113 & 0 \tabularnewline
18 & 0.537101 & 6.6436 & 0 \tabularnewline
19 & 0.491219 & 6.076 & 0 \tabularnewline
20 & 0.484126 & 5.9883 & 0 \tabularnewline
21 & 0.416267 & 5.1489 & 0 \tabularnewline
\hline
\end{tabular}
%Source: https://freestatistics.org/blog/index.php?pk=67475&T=1

[TABLE]
[ROW][C]Autocorrelation Function[/C][/ROW]
[ROW][C]Time lag k[/C][C]ACF(k)[/C][C]T-STAT[/C][C]P-value[/C][/ROW]
[ROW][C]1[/C][C]0.812487[/C][C]10.0499[/C][C]0[/C][/ROW]
[ROW][C]2[/C][C]0.736354[/C][C]9.1082[/C][C]0[/C][/ROW]
[ROW][C]3[/C][C]0.782314[/C][C]9.6767[/C][C]0[/C][/ROW]
[ROW][C]4[/C][C]0.774818[/C][C]9.584[/C][C]0[/C][/ROW]
[ROW][C]5[/C][C]0.753904[/C][C]9.3253[/C][C]0[/C][/ROW]
[ROW][C]6[/C][C]0.762627[/C][C]9.4332[/C][C]0[/C][/ROW]
[ROW][C]7[/C][C]0.697965[/C][C]8.6334[/C][C]0[/C][/ROW]
[ROW][C]8[/C][C]0.698155[/C][C]8.6357[/C][C]0[/C][/ROW]
[ROW][C]9[/C][C]0.646345[/C][C]7.9948[/C][C]0[/C][/ROW]
[ROW][C]10[/C][C]0.581313[/C][C]7.1904[/C][C]0[/C][/ROW]
[ROW][C]11[/C][C]0.647721[/C][C]8.0119[/C][C]0[/C][/ROW]
[ROW][C]12[/C][C]0.742568[/C][C]9.1851[/C][C]0[/C][/ROW]
[ROW][C]13[/C][C]0.587706[/C][C]7.2695[/C][C]0[/C][/ROW]
[ROW][C]14[/C][C]0.52434[/C][C]6.4857[/C][C]0[/C][/ROW]
[ROW][C]15[/C][C]0.551626[/C][C]6.8232[/C][C]0[/C][/ROW]
[ROW][C]16[/C][C]0.548768[/C][C]6.7879[/C][C]0[/C][/ROW]
[ROW][C]17[/C][C]0.54258[/C][C]6.7113[/C][C]0[/C][/ROW]
[ROW][C]18[/C][C]0.537101[/C][C]6.6436[/C][C]0[/C][/ROW]
[ROW][C]19[/C][C]0.491219[/C][C]6.076[/C][C]0[/C][/ROW]
[ROW][C]20[/C][C]0.484126[/C][C]5.9883[/C][C]0[/C][/ROW]
[ROW][C]21[/C][C]0.416267[/C][C]5.1489[/C][C]0[/C][/ROW]
[/TABLE]
Source: https://freestatistics.org/blog/index.php?pk=67475&T=1

Globally Unique Identifier (entire table): ba.freestatistics.org/blog/index.php?pk=67475&T=1

As an alternative you can also use a QR Code:  

The GUIDs for individual cells are displayed in the table below:

Autocorrelation Function
Time lag kACF(k)T-STATP-value
10.81248710.04990
20.7363549.10820
30.7823149.67670
40.7748189.5840
50.7539049.32530
60.7626279.43320
70.6979658.63340
80.6981558.63570
90.6463457.99480
100.5813137.19040
110.6477218.01190
120.7425689.18510
130.5877067.26950
140.524346.48570
150.5516266.82320
160.5487686.78790
170.542586.71130
180.5371016.64360
190.4912196.0760
200.4841265.98830
210.4162675.14890


Partial Autocorrelation Function
Time lag kPACF(k)T-STATP-value
10.81248710.04990
20.2242632.7740.003114
30.421345.21170
40.1647732.03810.021629
50.1565081.93590.027362
60.1511011.8690.031766
7-0.153892-1.90350.029424
80.0872921.07970.140978
9-0.279274-3.45440.000357
10-0.182387-2.2560.012744
110.2292972.83620.002591
120.4854036.00410
13-0.310249-3.83769.1e-05
14-0.196769-2.43390.008044
15-0.11789-1.45820.073416
160.0282560.34950.363595
170.0592230.73260.232476
180.0326140.40340.343605
190.0810611.00270.158801
20-0.089387-1.10570.135305
21-0.113986-1.40990.080294

\begin{tabular}{lllllllll}
\hline
Partial Autocorrelation Function \tabularnewline
Time lag k & PACF(k) & T-STAT & P-value \tabularnewline
1 & 0.812487 & 10.0499 & 0 \tabularnewline
2 & 0.224263 & 2.774 & 0.003114 \tabularnewline
3 & 0.42134 & 5.2117 & 0 \tabularnewline
4 & 0.164773 & 2.0381 & 0.021629 \tabularnewline
5 & 0.156508 & 1.9359 & 0.027362 \tabularnewline
6 & 0.151101 & 1.869 & 0.031766 \tabularnewline
7 & -0.153892 & -1.9035 & 0.029424 \tabularnewline
8 & 0.087292 & 1.0797 & 0.140978 \tabularnewline
9 & -0.279274 & -3.4544 & 0.000357 \tabularnewline
10 & -0.182387 & -2.256 & 0.012744 \tabularnewline
11 & 0.229297 & 2.8362 & 0.002591 \tabularnewline
12 & 0.485403 & 6.0041 & 0 \tabularnewline
13 & -0.310249 & -3.8376 & 9.1e-05 \tabularnewline
14 & -0.196769 & -2.4339 & 0.008044 \tabularnewline
15 & -0.11789 & -1.4582 & 0.073416 \tabularnewline
16 & 0.028256 & 0.3495 & 0.363595 \tabularnewline
17 & 0.059223 & 0.7326 & 0.232476 \tabularnewline
18 & 0.032614 & 0.4034 & 0.343605 \tabularnewline
19 & 0.081061 & 1.0027 & 0.158801 \tabularnewline
20 & -0.089387 & -1.1057 & 0.135305 \tabularnewline
21 & -0.113986 & -1.4099 & 0.080294 \tabularnewline
\hline
\end{tabular}
%Source: https://freestatistics.org/blog/index.php?pk=67475&T=2

[TABLE]
[ROW][C]Partial Autocorrelation Function[/C][/ROW]
[ROW][C]Time lag k[/C][C]PACF(k)[/C][C]T-STAT[/C][C]P-value[/C][/ROW]
[ROW][C]1[/C][C]0.812487[/C][C]10.0499[/C][C]0[/C][/ROW]
[ROW][C]2[/C][C]0.224263[/C][C]2.774[/C][C]0.003114[/C][/ROW]
[ROW][C]3[/C][C]0.42134[/C][C]5.2117[/C][C]0[/C][/ROW]
[ROW][C]4[/C][C]0.164773[/C][C]2.0381[/C][C]0.021629[/C][/ROW]
[ROW][C]5[/C][C]0.156508[/C][C]1.9359[/C][C]0.027362[/C][/ROW]
[ROW][C]6[/C][C]0.151101[/C][C]1.869[/C][C]0.031766[/C][/ROW]
[ROW][C]7[/C][C]-0.153892[/C][C]-1.9035[/C][C]0.029424[/C][/ROW]
[ROW][C]8[/C][C]0.087292[/C][C]1.0797[/C][C]0.140978[/C][/ROW]
[ROW][C]9[/C][C]-0.279274[/C][C]-3.4544[/C][C]0.000357[/C][/ROW]
[ROW][C]10[/C][C]-0.182387[/C][C]-2.256[/C][C]0.012744[/C][/ROW]
[ROW][C]11[/C][C]0.229297[/C][C]2.8362[/C][C]0.002591[/C][/ROW]
[ROW][C]12[/C][C]0.485403[/C][C]6.0041[/C][C]0[/C][/ROW]
[ROW][C]13[/C][C]-0.310249[/C][C]-3.8376[/C][C]9.1e-05[/C][/ROW]
[ROW][C]14[/C][C]-0.196769[/C][C]-2.4339[/C][C]0.008044[/C][/ROW]
[ROW][C]15[/C][C]-0.11789[/C][C]-1.4582[/C][C]0.073416[/C][/ROW]
[ROW][C]16[/C][C]0.028256[/C][C]0.3495[/C][C]0.363595[/C][/ROW]
[ROW][C]17[/C][C]0.059223[/C][C]0.7326[/C][C]0.232476[/C][/ROW]
[ROW][C]18[/C][C]0.032614[/C][C]0.4034[/C][C]0.343605[/C][/ROW]
[ROW][C]19[/C][C]0.081061[/C][C]1.0027[/C][C]0.158801[/C][/ROW]
[ROW][C]20[/C][C]-0.089387[/C][C]-1.1057[/C][C]0.135305[/C][/ROW]
[ROW][C]21[/C][C]-0.113986[/C][C]-1.4099[/C][C]0.080294[/C][/ROW]
[/TABLE]
Source: https://freestatistics.org/blog/index.php?pk=67475&T=2

Globally Unique Identifier (entire table): ba.freestatistics.org/blog/index.php?pk=67475&T=2

As an alternative you can also use a QR Code:  

The GUIDs for individual cells are displayed in the table below:

Partial Autocorrelation Function
Time lag kPACF(k)T-STATP-value
10.81248710.04990
20.2242632.7740.003114
30.421345.21170
40.1647732.03810.021629
50.1565081.93590.027362
60.1511011.8690.031766
7-0.153892-1.90350.029424
80.0872921.07970.140978
9-0.279274-3.45440.000357
10-0.182387-2.2560.012744
110.2292972.83620.002591
120.4854036.00410
13-0.310249-3.83769.1e-05
14-0.196769-2.43390.008044
15-0.11789-1.45820.073416
160.0282560.34950.363595
170.0592230.73260.232476
180.0326140.40340.343605
190.0810611.00270.158801
20-0.089387-1.10570.135305
21-0.113986-1.40990.080294


Parameters (Session):
par1 = Default ; par2 = 1 ; par3 = 0 ; par4 = 0 ; par5 = 12 ; par6 = White Noise ; par7 = 0.95 ;
Parameters (R input):
par1 = Default ; par2 = 1 ; par3 = 0 ; par4 = 0 ; par5 = 12 ; par6 = White Noise ; par7 = 0.95 ;
R code (references can be found in the software module):
if (par1 == 'Default') {
par1 = 10*log10(length(x))
} else {
par1 <- as.numeric(par1)
}
par2 <- as.numeric(par2)
par3 <- as.numeric(par3)
par4 <- as.numeric(par4)
par5 <- as.numeric(par5)
if (par6 == 'White Noise') par6 <- 'white' else par6 <- 'ma'
par7 <- as.numeric(par7)
if (par2 == 0) {
x <- log(x)
} else {
x <- (x ^ par2 - 1) / par2
}
if (par3 > 0) x <- diff(x,lag=1,difference=par3)
if (par4 > 0) x <- diff(x,lag=par5,difference=par4)
bitmap(file='pic1.png')
racf <- acf(x, par1, main='Autocorrelation', xlab='time lag', ylab='ACF', ci.type=par6, ci=par7, sub=paste('(lambda=',par2,', d=',par3,', D=',par4,', CI=', par7, ', CI type=',par6,')',sep=''))
dev.off()
bitmap(file='pic2.png')
rpacf <- pacf(x,par1,main='Partial Autocorrelation',xlab='lags',ylab='PACF')
dev.off()
(myacf <- c(racf$acf))
(mypacf <- c(rpacf$acf))
lengthx <- length(x)
sqrtn <- sqrt(lengthx)
load(file='createtable')
a<-table.start()
a<-table.row.start(a)
a<-table.element(a,'Autocorrelation Function',4,TRUE)
a<-table.row.end(a)
a<-table.row.start(a)
a<-table.element(a,'Time lag k',header=TRUE)
a<-table.element(a,hyperlink('basics.htm','ACF(k)','click here for more information about the Autocorrelation Function'),header=TRUE)
a<-table.element(a,'T-STAT',header=TRUE)
a<-table.element(a,'P-value',header=TRUE)
a<-table.row.end(a)
for (i in 2:(par1+1)) {
a<-table.row.start(a)
a<-table.element(a,i-1,header=TRUE)
a<-table.element(a,round(myacf[i],6))
mytstat <- myacf[i]*sqrtn
a<-table.element(a,round(mytstat,4))
a<-table.element(a,round(1-pt(abs(mytstat),lengthx),6))
a<-table.row.end(a)
}
a<-table.end(a)
table.save(a,file='mytable.tab')
a<-table.start()
a<-table.row.start(a)
a<-table.element(a,'Partial Autocorrelation Function',4,TRUE)
a<-table.row.end(a)
a<-table.row.start(a)
a<-table.element(a,'Time lag k',header=TRUE)
a<-table.element(a,hyperlink('basics.htm','PACF(k)','click here for more information about the Partial Autocorrelation Function'),header=TRUE)
a<-table.element(a,'T-STAT',header=TRUE)
a<-table.element(a,'P-value',header=TRUE)
a<-table.row.end(a)
for (i in 1:par1) {
a<-table.row.start(a)
a<-table.element(a,i,header=TRUE)
a<-table.element(a,round(mypacf[i],6))
mytstat <- mypacf[i]*sqrtn
a<-table.element(a,round(mytstat,4))
a<-table.element(a,round(1-pt(abs(mytstat),lengthx),6))
a<-table.row.end(a)
}
a<-table.end(a)
table.save(a,file='mytable1.tab')