Free Statistics

of Irreproducible Research!

Author's title

Author*The author of this computation has been verified*
R Software Modulerwasp_autocorrelation.wasp
Title produced by software(Partial) Autocorrelation Function
Date of computationMon, 14 Dec 2009 06:20:15 -0700
Cite this page as followsStatistical Computations at FreeStatistics.org, Office for Research Development and Education, URL https://freestatistics.org/blog/index.php?v=date/2009/Dec/14/t1260796871kemcnx8hya1siau.htm/, Retrieved Sun, 05 May 2024 20:11:07 +0000
Statistical Computations at FreeStatistics.org, Office for Research Development and Education, URL https://freestatistics.org/blog/index.php?pk=67549, Retrieved Sun, 05 May 2024 20:11:07 +0000
QR Codes:

Original text written by user:
IsPrivate?No (this computation is public)
User-defined keywords
Estimated Impact111
Family? (F = Feedback message, R = changed R code, M = changed R Module, P = changed Parameters, D = changed Data)
-     [Univariate Data Series] [data set] [2008-12-01 19:54:57] [b98453cac15ba1066b407e146608df68]
- RMP   [Standard Deviation-Mean Plot] [] [2009-11-27 14:40:44] [b98453cac15ba1066b407e146608df68]
- RMPD    [(Partial) Autocorrelation Function] [] [2009-12-10 16:13:24] [a9a33b1951d9ae87ed6d7d9055d41c93]
-   PD      [(Partial) Autocorrelation Function] [] [2009-12-14 12:53:49] [a9a33b1951d9ae87ed6d7d9055d41c93]
-   P           [(Partial) Autocorrelation Function] [] [2009-12-14 13:20:15] [66ffaa9e54a90d3ae4874684602d24e9] [Current]
Feedback Forum

Post a new message
Dataseries X:
17823.2
17872
17420.4
16704.4
15991.2
16583.6
19123.5
17838.7
17209.4
18586.5
16258.1
15141.6
19202.1
17746.5
19090.1
18040.3
17515.5
17751.8
21072.4
17170
19439.5
19795.4
17574.9
16165.4
19464.6
19932.1
19961.2
17343.4
18924.2
18574.1
21350.6
18594.6
19823.1
20844.4
19640.2
17735.4
19813.6
22160
20664.3
17877.4
20906.5
21164.1
21374.4
22952.3
21343.5
23899.3
22392.9
18274.1
22786.7
22321.5
17842.2
16373.5
15993.8
16446.1
17729
16643
16196.7
18252.1
17570.4


Summary of computational transaction
Raw Inputview raw input (R code)
Raw Outputview raw output of R engine
Computing time1 seconds
R Server'Gwilym Jenkins' @ 72.249.127.135

\begin{tabular}{lllllllll}
\hline
Summary of computational transaction \tabularnewline
Raw Input & view raw input (R code)  \tabularnewline
Raw Output & view raw output of R engine  \tabularnewline
Computing time & 1 seconds \tabularnewline
R Server & 'Gwilym Jenkins' @ 72.249.127.135 \tabularnewline
\hline
\end{tabular}
%Source: https://freestatistics.org/blog/index.php?pk=67549&T=0

[TABLE]
[ROW][C]Summary of computational transaction[/C][/ROW]
[ROW][C]Raw Input[/C][C]view raw input (R code) [/C][/ROW]
[ROW][C]Raw Output[/C][C]view raw output of R engine [/C][/ROW]
[ROW][C]Computing time[/C][C]1 seconds[/C][/ROW]
[ROW][C]R Server[/C][C]'Gwilym Jenkins' @ 72.249.127.135[/C][/ROW]
[/TABLE]
Source: https://freestatistics.org/blog/index.php?pk=67549&T=0

Globally Unique Identifier (entire table): ba.freestatistics.org/blog/index.php?pk=67549&T=0

As an alternative you can also use a QR Code:  

The GUIDs for individual cells are displayed in the table below:

Summary of computational transaction
Raw Inputview raw input (R code)
Raw Outputview raw output of R engine
Computing time1 seconds
R Server'Gwilym Jenkins' @ 72.249.127.135


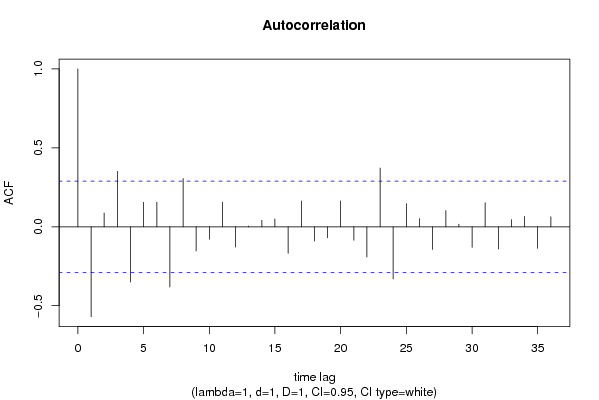
Autocorrelation Function
Time lag kACF(k)T-STATP-value
1-0.569446-3.86220.000175
20.0871530.59110.278672
30.3516372.38490.01063
4-0.350206-2.37520.010881
50.154991.05120.149331
60.1560071.05810.147769
7-0.381841-2.58980.006409
80.3059332.07490.021806
9-0.153486-1.0410.151659
10-0.078724-0.53390.29798
110.1560641.05850.147683
12-0.12861-0.87230.193795
130.0046330.03140.487535
140.0412460.27970.390463
150.0495610.33610.369148
16-0.167768-1.13790.130536
170.1639331.11180.13599
18-0.090215-0.61190.271818
19-0.070066-0.47520.318443
200.163771.11070.136226
21-0.085068-0.5770.28339
22-0.192005-1.30220.099658
230.3721492.5240.007559
24-0.330426-2.24110.014946
250.1474941.00040.161186
260.0517840.35120.363515
27-0.143873-0.97580.167136
280.1024560.69490.245311
290.0161650.10960.456587
30-0.1305-0.88510.190355
310.1523371.03320.153456
32-0.14042-0.95240.172943
330.0456210.30940.379202
340.0654530.44390.32959
35-0.13652-0.92590.179659
360.0630230.42740.335526

\begin{tabular}{lllllllll}
\hline
Autocorrelation Function \tabularnewline
Time lag k & ACF(k) & T-STAT & P-value \tabularnewline
1 & -0.569446 & -3.8622 & 0.000175 \tabularnewline
2 & 0.087153 & 0.5911 & 0.278672 \tabularnewline
3 & 0.351637 & 2.3849 & 0.01063 \tabularnewline
4 & -0.350206 & -2.3752 & 0.010881 \tabularnewline
5 & 0.15499 & 1.0512 & 0.149331 \tabularnewline
6 & 0.156007 & 1.0581 & 0.147769 \tabularnewline
7 & -0.381841 & -2.5898 & 0.006409 \tabularnewline
8 & 0.305933 & 2.0749 & 0.021806 \tabularnewline
9 & -0.153486 & -1.041 & 0.151659 \tabularnewline
10 & -0.078724 & -0.5339 & 0.29798 \tabularnewline
11 & 0.156064 & 1.0585 & 0.147683 \tabularnewline
12 & -0.12861 & -0.8723 & 0.193795 \tabularnewline
13 & 0.004633 & 0.0314 & 0.487535 \tabularnewline
14 & 0.041246 & 0.2797 & 0.390463 \tabularnewline
15 & 0.049561 & 0.3361 & 0.369148 \tabularnewline
16 & -0.167768 & -1.1379 & 0.130536 \tabularnewline
17 & 0.163933 & 1.1118 & 0.13599 \tabularnewline
18 & -0.090215 & -0.6119 & 0.271818 \tabularnewline
19 & -0.070066 & -0.4752 & 0.318443 \tabularnewline
20 & 0.16377 & 1.1107 & 0.136226 \tabularnewline
21 & -0.085068 & -0.577 & 0.28339 \tabularnewline
22 & -0.192005 & -1.3022 & 0.099658 \tabularnewline
23 & 0.372149 & 2.524 & 0.007559 \tabularnewline
24 & -0.330426 & -2.2411 & 0.014946 \tabularnewline
25 & 0.147494 & 1.0004 & 0.161186 \tabularnewline
26 & 0.051784 & 0.3512 & 0.363515 \tabularnewline
27 & -0.143873 & -0.9758 & 0.167136 \tabularnewline
28 & 0.102456 & 0.6949 & 0.245311 \tabularnewline
29 & 0.016165 & 0.1096 & 0.456587 \tabularnewline
30 & -0.1305 & -0.8851 & 0.190355 \tabularnewline
31 & 0.152337 & 1.0332 & 0.153456 \tabularnewline
32 & -0.14042 & -0.9524 & 0.172943 \tabularnewline
33 & 0.045621 & 0.3094 & 0.379202 \tabularnewline
34 & 0.065453 & 0.4439 & 0.32959 \tabularnewline
35 & -0.13652 & -0.9259 & 0.179659 \tabularnewline
36 & 0.063023 & 0.4274 & 0.335526 \tabularnewline
\hline
\end{tabular}
%Source: https://freestatistics.org/blog/index.php?pk=67549&T=1

[TABLE]
[ROW][C]Autocorrelation Function[/C][/ROW]
[ROW][C]Time lag k[/C][C]ACF(k)[/C][C]T-STAT[/C][C]P-value[/C][/ROW]
[ROW][C]1[/C][C]-0.569446[/C][C]-3.8622[/C][C]0.000175[/C][/ROW]
[ROW][C]2[/C][C]0.087153[/C][C]0.5911[/C][C]0.278672[/C][/ROW]
[ROW][C]3[/C][C]0.351637[/C][C]2.3849[/C][C]0.01063[/C][/ROW]
[ROW][C]4[/C][C]-0.350206[/C][C]-2.3752[/C][C]0.010881[/C][/ROW]
[ROW][C]5[/C][C]0.15499[/C][C]1.0512[/C][C]0.149331[/C][/ROW]
[ROW][C]6[/C][C]0.156007[/C][C]1.0581[/C][C]0.147769[/C][/ROW]
[ROW][C]7[/C][C]-0.381841[/C][C]-2.5898[/C][C]0.006409[/C][/ROW]
[ROW][C]8[/C][C]0.305933[/C][C]2.0749[/C][C]0.021806[/C][/ROW]
[ROW][C]9[/C][C]-0.153486[/C][C]-1.041[/C][C]0.151659[/C][/ROW]
[ROW][C]10[/C][C]-0.078724[/C][C]-0.5339[/C][C]0.29798[/C][/ROW]
[ROW][C]11[/C][C]0.156064[/C][C]1.0585[/C][C]0.147683[/C][/ROW]
[ROW][C]12[/C][C]-0.12861[/C][C]-0.8723[/C][C]0.193795[/C][/ROW]
[ROW][C]13[/C][C]0.004633[/C][C]0.0314[/C][C]0.487535[/C][/ROW]
[ROW][C]14[/C][C]0.041246[/C][C]0.2797[/C][C]0.390463[/C][/ROW]
[ROW][C]15[/C][C]0.049561[/C][C]0.3361[/C][C]0.369148[/C][/ROW]
[ROW][C]16[/C][C]-0.167768[/C][C]-1.1379[/C][C]0.130536[/C][/ROW]
[ROW][C]17[/C][C]0.163933[/C][C]1.1118[/C][C]0.13599[/C][/ROW]
[ROW][C]18[/C][C]-0.090215[/C][C]-0.6119[/C][C]0.271818[/C][/ROW]
[ROW][C]19[/C][C]-0.070066[/C][C]-0.4752[/C][C]0.318443[/C][/ROW]
[ROW][C]20[/C][C]0.16377[/C][C]1.1107[/C][C]0.136226[/C][/ROW]
[ROW][C]21[/C][C]-0.085068[/C][C]-0.577[/C][C]0.28339[/C][/ROW]
[ROW][C]22[/C][C]-0.192005[/C][C]-1.3022[/C][C]0.099658[/C][/ROW]
[ROW][C]23[/C][C]0.372149[/C][C]2.524[/C][C]0.007559[/C][/ROW]
[ROW][C]24[/C][C]-0.330426[/C][C]-2.2411[/C][C]0.014946[/C][/ROW]
[ROW][C]25[/C][C]0.147494[/C][C]1.0004[/C][C]0.161186[/C][/ROW]
[ROW][C]26[/C][C]0.051784[/C][C]0.3512[/C][C]0.363515[/C][/ROW]
[ROW][C]27[/C][C]-0.143873[/C][C]-0.9758[/C][C]0.167136[/C][/ROW]
[ROW][C]28[/C][C]0.102456[/C][C]0.6949[/C][C]0.245311[/C][/ROW]
[ROW][C]29[/C][C]0.016165[/C][C]0.1096[/C][C]0.456587[/C][/ROW]
[ROW][C]30[/C][C]-0.1305[/C][C]-0.8851[/C][C]0.190355[/C][/ROW]
[ROW][C]31[/C][C]0.152337[/C][C]1.0332[/C][C]0.153456[/C][/ROW]
[ROW][C]32[/C][C]-0.14042[/C][C]-0.9524[/C][C]0.172943[/C][/ROW]
[ROW][C]33[/C][C]0.045621[/C][C]0.3094[/C][C]0.379202[/C][/ROW]
[ROW][C]34[/C][C]0.065453[/C][C]0.4439[/C][C]0.32959[/C][/ROW]
[ROW][C]35[/C][C]-0.13652[/C][C]-0.9259[/C][C]0.179659[/C][/ROW]
[ROW][C]36[/C][C]0.063023[/C][C]0.4274[/C][C]0.335526[/C][/ROW]
[/TABLE]
Source: https://freestatistics.org/blog/index.php?pk=67549&T=1

Globally Unique Identifier (entire table): ba.freestatistics.org/blog/index.php?pk=67549&T=1

As an alternative you can also use a QR Code:  

The GUIDs for individual cells are displayed in the table below:

Autocorrelation Function
Time lag kACF(k)T-STATP-value
1-0.569446-3.86220.000175
20.0871530.59110.278672
30.3516372.38490.01063
4-0.350206-2.37520.010881
50.154991.05120.149331
60.1560071.05810.147769
7-0.381841-2.58980.006409
80.3059332.07490.021806
9-0.153486-1.0410.151659
10-0.078724-0.53390.29798
110.1560641.05850.147683
12-0.12861-0.87230.193795
130.0046330.03140.487535
140.0412460.27970.390463
150.0495610.33610.369148
16-0.167768-1.13790.130536
170.1639331.11180.13599
18-0.090215-0.61190.271818
19-0.070066-0.47520.318443
200.163771.11070.136226
21-0.085068-0.5770.28339
22-0.192005-1.30220.099658
230.3721492.5240.007559
24-0.330426-2.24110.014946
250.1474941.00040.161186
260.0517840.35120.363515
27-0.143873-0.97580.167136
280.1024560.69490.245311
290.0161650.10960.456587
30-0.1305-0.88510.190355
310.1523371.03320.153456
32-0.14042-0.95240.172943
330.0456210.30940.379202
340.0654530.44390.32959
35-0.13652-0.92590.179659
360.0630230.42740.335526


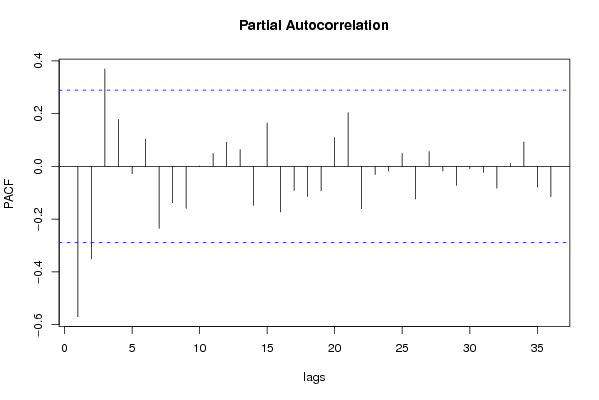
Partial Autocorrelation Function
Time lag kPACF(k)T-STATP-value
1-0.569446-3.86220.000175
2-0.350902-2.37990.010759
30.3693712.50520.007921
40.1775971.20450.117274
5-0.027544-0.18680.426316
60.1034370.70150.243249
7-0.234786-1.59240.059073
8-0.137404-0.93190.178121
9-0.158649-1.0760.143767
100.0014790.010.496019
110.0484770.32880.371905
120.0916230.62140.268697
130.0635670.43110.334192
14-0.147252-0.99870.161579
150.1646721.11690.134927
16-0.172743-1.17160.123696
17-0.091275-0.61910.269465
18-0.114055-0.77360.221575
19-0.092512-0.62740.266734
200.108160.73360.233464
210.2037971.38220.08679
22-0.16002-1.08530.14172
23-0.030454-0.20650.418638
24-0.017742-0.12030.452371
250.0486620.330.371434
26-0.12331-0.83630.203647
270.0563750.38240.35198
28-0.01781-0.12080.452192
29-0.072111-0.48910.313554
30-0.008074-0.05480.478284
31-0.022178-0.15040.440545
32-0.082616-0.56030.288988
330.0113690.07710.469435
340.0922030.62540.267415
35-0.078205-0.53040.299188
36-0.114782-0.77850.220134

\begin{tabular}{lllllllll}
\hline
Partial Autocorrelation Function \tabularnewline
Time lag k & PACF(k) & T-STAT & P-value \tabularnewline
1 & -0.569446 & -3.8622 & 0.000175 \tabularnewline
2 & -0.350902 & -2.3799 & 0.010759 \tabularnewline
3 & 0.369371 & 2.5052 & 0.007921 \tabularnewline
4 & 0.177597 & 1.2045 & 0.117274 \tabularnewline
5 & -0.027544 & -0.1868 & 0.426316 \tabularnewline
6 & 0.103437 & 0.7015 & 0.243249 \tabularnewline
7 & -0.234786 & -1.5924 & 0.059073 \tabularnewline
8 & -0.137404 & -0.9319 & 0.178121 \tabularnewline
9 & -0.158649 & -1.076 & 0.143767 \tabularnewline
10 & 0.001479 & 0.01 & 0.496019 \tabularnewline
11 & 0.048477 & 0.3288 & 0.371905 \tabularnewline
12 & 0.091623 & 0.6214 & 0.268697 \tabularnewline
13 & 0.063567 & 0.4311 & 0.334192 \tabularnewline
14 & -0.147252 & -0.9987 & 0.161579 \tabularnewline
15 & 0.164672 & 1.1169 & 0.134927 \tabularnewline
16 & -0.172743 & -1.1716 & 0.123696 \tabularnewline
17 & -0.091275 & -0.6191 & 0.269465 \tabularnewline
18 & -0.114055 & -0.7736 & 0.221575 \tabularnewline
19 & -0.092512 & -0.6274 & 0.266734 \tabularnewline
20 & 0.10816 & 0.7336 & 0.233464 \tabularnewline
21 & 0.203797 & 1.3822 & 0.08679 \tabularnewline
22 & -0.16002 & -1.0853 & 0.14172 \tabularnewline
23 & -0.030454 & -0.2065 & 0.418638 \tabularnewline
24 & -0.017742 & -0.1203 & 0.452371 \tabularnewline
25 & 0.048662 & 0.33 & 0.371434 \tabularnewline
26 & -0.12331 & -0.8363 & 0.203647 \tabularnewline
27 & 0.056375 & 0.3824 & 0.35198 \tabularnewline
28 & -0.01781 & -0.1208 & 0.452192 \tabularnewline
29 & -0.072111 & -0.4891 & 0.313554 \tabularnewline
30 & -0.008074 & -0.0548 & 0.478284 \tabularnewline
31 & -0.022178 & -0.1504 & 0.440545 \tabularnewline
32 & -0.082616 & -0.5603 & 0.288988 \tabularnewline
33 & 0.011369 & 0.0771 & 0.469435 \tabularnewline
34 & 0.092203 & 0.6254 & 0.267415 \tabularnewline
35 & -0.078205 & -0.5304 & 0.299188 \tabularnewline
36 & -0.114782 & -0.7785 & 0.220134 \tabularnewline
\hline
\end{tabular}
%Source: https://freestatistics.org/blog/index.php?pk=67549&T=2

[TABLE]
[ROW][C]Partial Autocorrelation Function[/C][/ROW]
[ROW][C]Time lag k[/C][C]PACF(k)[/C][C]T-STAT[/C][C]P-value[/C][/ROW]
[ROW][C]1[/C][C]-0.569446[/C][C]-3.8622[/C][C]0.000175[/C][/ROW]
[ROW][C]2[/C][C]-0.350902[/C][C]-2.3799[/C][C]0.010759[/C][/ROW]
[ROW][C]3[/C][C]0.369371[/C][C]2.5052[/C][C]0.007921[/C][/ROW]
[ROW][C]4[/C][C]0.177597[/C][C]1.2045[/C][C]0.117274[/C][/ROW]
[ROW][C]5[/C][C]-0.027544[/C][C]-0.1868[/C][C]0.426316[/C][/ROW]
[ROW][C]6[/C][C]0.103437[/C][C]0.7015[/C][C]0.243249[/C][/ROW]
[ROW][C]7[/C][C]-0.234786[/C][C]-1.5924[/C][C]0.059073[/C][/ROW]
[ROW][C]8[/C][C]-0.137404[/C][C]-0.9319[/C][C]0.178121[/C][/ROW]
[ROW][C]9[/C][C]-0.158649[/C][C]-1.076[/C][C]0.143767[/C][/ROW]
[ROW][C]10[/C][C]0.001479[/C][C]0.01[/C][C]0.496019[/C][/ROW]
[ROW][C]11[/C][C]0.048477[/C][C]0.3288[/C][C]0.371905[/C][/ROW]
[ROW][C]12[/C][C]0.091623[/C][C]0.6214[/C][C]0.268697[/C][/ROW]
[ROW][C]13[/C][C]0.063567[/C][C]0.4311[/C][C]0.334192[/C][/ROW]
[ROW][C]14[/C][C]-0.147252[/C][C]-0.9987[/C][C]0.161579[/C][/ROW]
[ROW][C]15[/C][C]0.164672[/C][C]1.1169[/C][C]0.134927[/C][/ROW]
[ROW][C]16[/C][C]-0.172743[/C][C]-1.1716[/C][C]0.123696[/C][/ROW]
[ROW][C]17[/C][C]-0.091275[/C][C]-0.6191[/C][C]0.269465[/C][/ROW]
[ROW][C]18[/C][C]-0.114055[/C][C]-0.7736[/C][C]0.221575[/C][/ROW]
[ROW][C]19[/C][C]-0.092512[/C][C]-0.6274[/C][C]0.266734[/C][/ROW]
[ROW][C]20[/C][C]0.10816[/C][C]0.7336[/C][C]0.233464[/C][/ROW]
[ROW][C]21[/C][C]0.203797[/C][C]1.3822[/C][C]0.08679[/C][/ROW]
[ROW][C]22[/C][C]-0.16002[/C][C]-1.0853[/C][C]0.14172[/C][/ROW]
[ROW][C]23[/C][C]-0.030454[/C][C]-0.2065[/C][C]0.418638[/C][/ROW]
[ROW][C]24[/C][C]-0.017742[/C][C]-0.1203[/C][C]0.452371[/C][/ROW]
[ROW][C]25[/C][C]0.048662[/C][C]0.33[/C][C]0.371434[/C][/ROW]
[ROW][C]26[/C][C]-0.12331[/C][C]-0.8363[/C][C]0.203647[/C][/ROW]
[ROW][C]27[/C][C]0.056375[/C][C]0.3824[/C][C]0.35198[/C][/ROW]
[ROW][C]28[/C][C]-0.01781[/C][C]-0.1208[/C][C]0.452192[/C][/ROW]
[ROW][C]29[/C][C]-0.072111[/C][C]-0.4891[/C][C]0.313554[/C][/ROW]
[ROW][C]30[/C][C]-0.008074[/C][C]-0.0548[/C][C]0.478284[/C][/ROW]
[ROW][C]31[/C][C]-0.022178[/C][C]-0.1504[/C][C]0.440545[/C][/ROW]
[ROW][C]32[/C][C]-0.082616[/C][C]-0.5603[/C][C]0.288988[/C][/ROW]
[ROW][C]33[/C][C]0.011369[/C][C]0.0771[/C][C]0.469435[/C][/ROW]
[ROW][C]34[/C][C]0.092203[/C][C]0.6254[/C][C]0.267415[/C][/ROW]
[ROW][C]35[/C][C]-0.078205[/C][C]-0.5304[/C][C]0.299188[/C][/ROW]
[ROW][C]36[/C][C]-0.114782[/C][C]-0.7785[/C][C]0.220134[/C][/ROW]
[/TABLE]
Source: https://freestatistics.org/blog/index.php?pk=67549&T=2

Globally Unique Identifier (entire table): ba.freestatistics.org/blog/index.php?pk=67549&T=2

As an alternative you can also use a QR Code:  

The GUIDs for individual cells are displayed in the table below:

Partial Autocorrelation Function
Time lag kPACF(k)T-STATP-value
1-0.569446-3.86220.000175
2-0.350902-2.37990.010759
30.3693712.50520.007921
40.1775971.20450.117274
5-0.027544-0.18680.426316
60.1034370.70150.243249
7-0.234786-1.59240.059073
8-0.137404-0.93190.178121
9-0.158649-1.0760.143767
100.0014790.010.496019
110.0484770.32880.371905
120.0916230.62140.268697
130.0635670.43110.334192
14-0.147252-0.99870.161579
150.1646721.11690.134927
16-0.172743-1.17160.123696
17-0.091275-0.61910.269465
18-0.114055-0.77360.221575
19-0.092512-0.62740.266734
200.108160.73360.233464
210.2037971.38220.08679
22-0.16002-1.08530.14172
23-0.030454-0.20650.418638
24-0.017742-0.12030.452371
250.0486620.330.371434
26-0.12331-0.83630.203647
270.0563750.38240.35198
28-0.01781-0.12080.452192
29-0.072111-0.48910.313554
30-0.008074-0.05480.478284
31-0.022178-0.15040.440545
32-0.082616-0.56030.288988
330.0113690.07710.469435
340.0922030.62540.267415
35-0.078205-0.53040.299188
36-0.114782-0.77850.220134


Parameters (Session):
par1 = 36 ; par2 = 1 ; par3 = 1 ; par4 = 1 ; par5 = 12 ; par6 = White Noise ; par7 = 0.95 ;
Parameters (R input):
par1 = 36 ; par2 = 1 ; par3 = 1 ; par4 = 1 ; par5 = 12 ; par6 = White Noise ; par7 = 0.95 ;
R code (references can be found in the software module):
if (par1 == 'Default') {
par1 = 10*log10(length(x))
} else {
par1 <- as.numeric(par1)
}
par2 <- as.numeric(par2)
par3 <- as.numeric(par3)
par4 <- as.numeric(par4)
par5 <- as.numeric(par5)
if (par6 == 'White Noise') par6 <- 'white' else par6 <- 'ma'
par7 <- as.numeric(par7)
if (par2 == 0) {
x <- log(x)
} else {
x <- (x ^ par2 - 1) / par2
}
if (par3 > 0) x <- diff(x,lag=1,difference=par3)
if (par4 > 0) x <- diff(x,lag=par5,difference=par4)
bitmap(file='pic1.png')
racf <- acf(x, par1, main='Autocorrelation', xlab='time lag', ylab='ACF', ci.type=par6, ci=par7, sub=paste('(lambda=',par2,', d=',par3,', D=',par4,', CI=', par7, ', CI type=',par6,')',sep=''))
dev.off()
bitmap(file='pic2.png')
rpacf <- pacf(x,par1,main='Partial Autocorrelation',xlab='lags',ylab='PACF')
dev.off()
(myacf <- c(racf$acf))
(mypacf <- c(rpacf$acf))
lengthx <- length(x)
sqrtn <- sqrt(lengthx)
load(file='createtable')
a<-table.start()
a<-table.row.start(a)
a<-table.element(a,'Autocorrelation Function',4,TRUE)
a<-table.row.end(a)
a<-table.row.start(a)
a<-table.element(a,'Time lag k',header=TRUE)
a<-table.element(a,hyperlink('basics.htm','ACF(k)','click here for more information about the Autocorrelation Function'),header=TRUE)
a<-table.element(a,'T-STAT',header=TRUE)
a<-table.element(a,'P-value',header=TRUE)
a<-table.row.end(a)
for (i in 2:(par1+1)) {
a<-table.row.start(a)
a<-table.element(a,i-1,header=TRUE)
a<-table.element(a,round(myacf[i],6))
mytstat <- myacf[i]*sqrtn
a<-table.element(a,round(mytstat,4))
a<-table.element(a,round(1-pt(abs(mytstat),lengthx),6))
a<-table.row.end(a)
}
a<-table.end(a)
table.save(a,file='mytable.tab')
a<-table.start()
a<-table.row.start(a)
a<-table.element(a,'Partial Autocorrelation Function',4,TRUE)
a<-table.row.end(a)
a<-table.row.start(a)
a<-table.element(a,'Time lag k',header=TRUE)
a<-table.element(a,hyperlink('basics.htm','PACF(k)','click here for more information about the Partial Autocorrelation Function'),header=TRUE)
a<-table.element(a,'T-STAT',header=TRUE)
a<-table.element(a,'P-value',header=TRUE)
a<-table.row.end(a)
for (i in 1:par1) {
a<-table.row.start(a)
a<-table.element(a,i,header=TRUE)
a<-table.element(a,round(mypacf[i],6))
mytstat <- mypacf[i]*sqrtn
a<-table.element(a,round(mytstat,4))
a<-table.element(a,round(1-pt(abs(mytstat),lengthx),6))
a<-table.row.end(a)
}
a<-table.end(a)
table.save(a,file='mytable1.tab')