Free Statistics

of Irreproducible Research!

Author's title

Author*The author of this computation has been verified*
R Software Modulerwasp_smp.wasp
Title produced by softwareStandard Deviation-Mean Plot
Date of computationMon, 14 Dec 2009 11:06:03 -0700
Cite this page as followsStatistical Computations at FreeStatistics.org, Office for Research Development and Education, URL https://freestatistics.org/blog/index.php?v=date/2009/Dec/14/t1260814062571d7lyxkvm3lkl.htm/, Retrieved Sun, 05 May 2024 13:47:54 +0000
Statistical Computations at FreeStatistics.org, Office for Research Development and Education, URL https://freestatistics.org/blog/index.php?pk=67604, Retrieved Sun, 05 May 2024 13:47:54 +0000
QR Codes:

Original text written by user:
IsPrivate?No (this computation is public)
User-defined keywords
Estimated Impact103
Family? (F = Feedback message, R = changed R code, M = changed R Module, P = changed Parameters, D = changed Data)
-       [Standard Deviation-Mean Plot] [Standard Deviatio...] [2009-12-14 18:06:03] [6df9bd2792d60592b4a24994398a86db] [Current]
Feedback Forum

Post a new message
Dataseries X:
7787.0  
8474.2  
9154.7  
8557.2  
7951.1  
9156.7  
7865.7  
7337.4  
9131.7  
8814.6  
8598.8  
8439.6  
7451.8  
8016.2  
9544.1  
8270.7  
8102.2  
9369.0  
7657.7  
7816.6  
9391.3  
9445.4  
9533.1  
10068.7  
8955.5  
10423.9  
11617.2  
9391.1  
10872.0  
10230.4  
9221.0  
9428.6  
10934.5  
10986.0  
11724.6  
11180.9  
11163.2  
11240.9  
12107.1  
10762.3  
11340.4  
11266.8  
9542.7  
9227.7  
10571.9  
10774.4  
10392.8  
9920.2  
9884.9  
10174.5  
11395.4  
10760.2  
10570.1  
10536.0  
9902.6  
8889.0  
10837.3  
11624.1  
10509.0  
10984.9  
10649.1  
10855.7  
11677.4  
10760.2  
10046.2  
10772.8  
9987.7  
8638.7  
11063.7  
11855.7  
10684.5  
11337.4  
10478.0  
11123.9  
12909.3  
11339.9  
10462.2  
12733.5  
10519.2  
10414.9  
12476.8  
12384.6  
12266.7  
12919.9  
11497.3  
12142.0  
13919.4  
12656.8  
12034.1  
13199.7  
10881.3  
11301.2  
13643.9  
12517.0  
13981.1  
14275.7  
13435.0  
13565.7  
16216.3  
12970.0  
14079.9  
14235.0  
12213.4  
12581.0  
14130.4  
14210.8  
14378.5  
13142.8  
13714.7  
13621.9  
15379.8  
13306.3  
14391.2  
14909.9  
14025.4  
12951.2  
14344.3  
16093.4  
15413.6  
14705.7  
15972.8
16241.4
16626.4
17136.2
15622.9
18003.9
16136.1
14423.7
16789.4
16782.2
14133.8
12607


Summary of computational transaction
Raw Inputview raw input (R code)
Raw Outputview raw output of R engine
Computing time1 seconds
R Server'Gwilym Jenkins' @ 72.249.127.135

\begin{tabular}{lllllllll}
\hline
Summary of computational transaction \tabularnewline
Raw Input & view raw input (R code)  \tabularnewline
Raw Output & view raw output of R engine  \tabularnewline
Computing time & 1 seconds \tabularnewline
R Server & 'Gwilym Jenkins' @ 72.249.127.135 \tabularnewline
\hline
\end{tabular}
%Source: https://freestatistics.org/blog/index.php?pk=67604&T=0

[TABLE]
[ROW][C]Summary of computational transaction[/C][/ROW]
[ROW][C]Raw Input[/C][C]view raw input (R code) [/C][/ROW]
[ROW][C]Raw Output[/C][C]view raw output of R engine [/C][/ROW]
[ROW][C]Computing time[/C][C]1 seconds[/C][/ROW]
[ROW][C]R Server[/C][C]'Gwilym Jenkins' @ 72.249.127.135[/C][/ROW]
[/TABLE]
Source: https://freestatistics.org/blog/index.php?pk=67604&T=0

Globally Unique Identifier (entire table): ba.freestatistics.org/blog/index.php?pk=67604&T=0

As an alternative you can also use a QR Code:  

The GUIDs for individual cells are displayed in the table below:

Summary of computational transaction
Raw Inputview raw input (R code)
Raw Outputview raw output of R engine
Computing time1 seconds
R Server'Gwilym Jenkins' @ 72.249.127.135


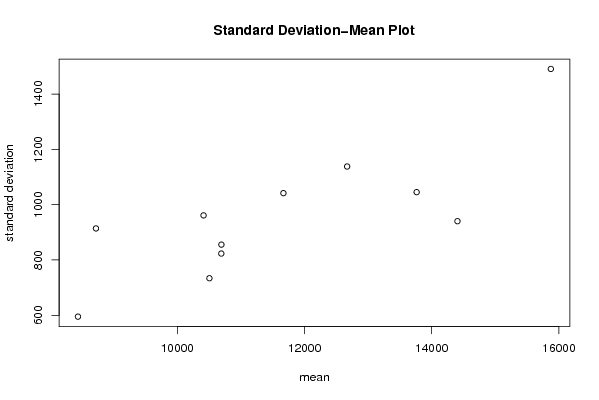
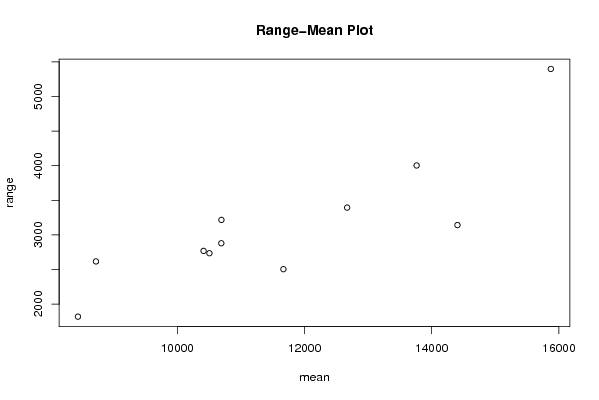
Standard Deviation-Mean Plot
SectionMeanStandard DeviationRange
18439.05833333333595.0035087113251819.3
28722.23333333333913.9862723589492616.9
310413.8083333333961.2010389075582769.1
410692.5333333333823.1347822179362879.4
510505.6666666667733.8786750526072735.1
610694.0916666667855.4037669251273217
711669.0751041.555632106482505
812670.79166666671137.874186573233394.4
913763.23333333331045.102438940224002.9
1014404.7833333333940.1138430417823142.2
1115872.98333333331490.574860328205396.9

\begin{tabular}{lllllllll}
\hline
Standard Deviation-Mean Plot \tabularnewline
Section & Mean & Standard Deviation & Range \tabularnewline
1 & 8439.05833333333 & 595.003508711325 & 1819.3 \tabularnewline
2 & 8722.23333333333 & 913.986272358949 & 2616.9 \tabularnewline
3 & 10413.8083333333 & 961.201038907558 & 2769.1 \tabularnewline
4 & 10692.5333333333 & 823.134782217936 & 2879.4 \tabularnewline
5 & 10505.6666666667 & 733.878675052607 & 2735.1 \tabularnewline
6 & 10694.0916666667 & 855.403766925127 & 3217 \tabularnewline
7 & 11669.075 & 1041.55563210648 & 2505 \tabularnewline
8 & 12670.7916666667 & 1137.87418657323 & 3394.4 \tabularnewline
9 & 13763.2333333333 & 1045.10243894022 & 4002.9 \tabularnewline
10 & 14404.7833333333 & 940.113843041782 & 3142.2 \tabularnewline
11 & 15872.9833333333 & 1490.57486032820 & 5396.9 \tabularnewline
\hline
\end{tabular}
%Source: https://freestatistics.org/blog/index.php?pk=67604&T=1

[TABLE]
[ROW][C]Standard Deviation-Mean Plot[/C][/ROW]
[ROW][C]Section[/C][C]Mean[/C][C]Standard Deviation[/C][C]Range[/C][/ROW]
[ROW][C]1[/C][C]8439.05833333333[/C][C]595.003508711325[/C][C]1819.3[/C][/ROW]
[ROW][C]2[/C][C]8722.23333333333[/C][C]913.986272358949[/C][C]2616.9[/C][/ROW]
[ROW][C]3[/C][C]10413.8083333333[/C][C]961.201038907558[/C][C]2769.1[/C][/ROW]
[ROW][C]4[/C][C]10692.5333333333[/C][C]823.134782217936[/C][C]2879.4[/C][/ROW]
[ROW][C]5[/C][C]10505.6666666667[/C][C]733.878675052607[/C][C]2735.1[/C][/ROW]
[ROW][C]6[/C][C]10694.0916666667[/C][C]855.403766925127[/C][C]3217[/C][/ROW]
[ROW][C]7[/C][C]11669.075[/C][C]1041.55563210648[/C][C]2505[/C][/ROW]
[ROW][C]8[/C][C]12670.7916666667[/C][C]1137.87418657323[/C][C]3394.4[/C][/ROW]
[ROW][C]9[/C][C]13763.2333333333[/C][C]1045.10243894022[/C][C]4002.9[/C][/ROW]
[ROW][C]10[/C][C]14404.7833333333[/C][C]940.113843041782[/C][C]3142.2[/C][/ROW]
[ROW][C]11[/C][C]15872.9833333333[/C][C]1490.57486032820[/C][C]5396.9[/C][/ROW]
[/TABLE]
Source: https://freestatistics.org/blog/index.php?pk=67604&T=1

Globally Unique Identifier (entire table): ba.freestatistics.org/blog/index.php?pk=67604&T=1

As an alternative you can also use a QR Code:  

The GUIDs for individual cells are displayed in the table below:

Standard Deviation-Mean Plot
SectionMeanStandard DeviationRange
18439.05833333333595.0035087113251819.3
28722.23333333333913.9862723589492616.9
310413.8083333333961.2010389075582769.1
410692.5333333333823.1347822179362879.4
510505.6666666667733.8786750526072735.1
610694.0916666667855.4037669251273217
711669.0751041.555632106482505
812670.79166666671137.874186573233394.4
913763.23333333331045.102438940224002.9
1014404.7833333333940.1138430417823142.2
1115872.98333333331490.574860328205396.9


Regression: S.E.(k) = alpha + beta * Mean(k)
alpha31.2947973043778
beta0.0797319131891336
S.D.0.0200583733638431
T-STAT3.97499397098955
p-value0.00323015199734159

\begin{tabular}{lllllllll}
\hline
Regression: S.E.(k) = alpha + beta * Mean(k) \tabularnewline
alpha & 31.2947973043778 \tabularnewline
beta & 0.0797319131891336 \tabularnewline
S.D. & 0.0200583733638431 \tabularnewline
T-STAT & 3.97499397098955 \tabularnewline
p-value & 0.00323015199734159 \tabularnewline
\hline
\end{tabular}
%Source: https://freestatistics.org/blog/index.php?pk=67604&T=2

[TABLE]
[ROW][C]Regression: S.E.(k) = alpha + beta * Mean(k)[/C][/ROW]
[ROW][C]alpha[/C][C]31.2947973043778[/C][/ROW]
[ROW][C]beta[/C][C]0.0797319131891336[/C][/ROW]
[ROW][C]S.D.[/C][C]0.0200583733638431[/C][/ROW]
[ROW][C]T-STAT[/C][C]3.97499397098955[/C][/ROW]
[ROW][C]p-value[/C][C]0.00323015199734159[/C][/ROW]
[/TABLE]
Source: https://freestatistics.org/blog/index.php?pk=67604&T=2

Globally Unique Identifier (entire table): ba.freestatistics.org/blog/index.php?pk=67604&T=2

As an alternative you can also use a QR Code:  

The GUIDs for individual cells are displayed in the table below:

Regression: S.E.(k) = alpha + beta * Mean(k)
alpha31.2947973043778
beta0.0797319131891336
S.D.0.0200583733638431
T-STAT3.97499397098955
p-value0.00323015199734159


Regression: ln S.E.(k) = alpha + beta * ln Mean(k)
alpha-1.94794147879422
beta0.940510872029627
S.D.0.246892586748967
T-STAT3.80939292027391
p-value0.00415699482356635
Lambda0.0594891279703729

\begin{tabular}{lllllllll}
\hline
Regression: ln S.E.(k) = alpha + beta * ln Mean(k) \tabularnewline
alpha & -1.94794147879422 \tabularnewline
beta & 0.940510872029627 \tabularnewline
S.D. & 0.246892586748967 \tabularnewline
T-STAT & 3.80939292027391 \tabularnewline
p-value & 0.00415699482356635 \tabularnewline
Lambda & 0.0594891279703729 \tabularnewline
\hline
\end{tabular}
%Source: https://freestatistics.org/blog/index.php?pk=67604&T=3

[TABLE]
[ROW][C]Regression: ln S.E.(k) = alpha + beta * ln Mean(k)[/C][/ROW]
[ROW][C]alpha[/C][C]-1.94794147879422[/C][/ROW]
[ROW][C]beta[/C][C]0.940510872029627[/C][/ROW]
[ROW][C]S.D.[/C][C]0.246892586748967[/C][/ROW]
[ROW][C]T-STAT[/C][C]3.80939292027391[/C][/ROW]
[ROW][C]p-value[/C][C]0.00415699482356635[/C][/ROW]
[ROW][C]Lambda[/C][C]0.0594891279703729[/C][/ROW]
[/TABLE]
Source: https://freestatistics.org/blog/index.php?pk=67604&T=3

Globally Unique Identifier (entire table): ba.freestatistics.org/blog/index.php?pk=67604&T=3

As an alternative you can also use a QR Code:  

The GUIDs for individual cells are displayed in the table below:

Regression: ln S.E.(k) = alpha + beta * ln Mean(k)
alpha-1.94794147879422
beta0.940510872029627
S.D.0.246892586748967
T-STAT3.80939292027391
p-value0.00415699482356635
Lambda0.0594891279703729


Parameters (Session):
par1 = 12 ;
Parameters (R input):
par1 = 12 ;
R code (references can be found in the software module):
par1 <- as.numeric(par1)
(n <- length(x))
(np <- floor(n / par1))
arr <- array(NA,dim=c(par1,np))
j <- 0
k <- 1
for (i in 1:(np*par1))
{
j = j + 1
arr[j,k] <- x[i]
if (j == par1) {
j = 0
k=k+1
}
}
arr
arr.mean <- array(NA,dim=np)
arr.sd <- array(NA,dim=np)
arr.range <- array(NA,dim=np)
for (j in 1:np)
{
arr.mean[j] <- mean(arr[,j],na.rm=TRUE)
arr.sd[j] <- sd(arr[,j],na.rm=TRUE)
arr.range[j] <- max(arr[,j],na.rm=TRUE) - min(arr[,j],na.rm=TRUE)
}
arr.mean
arr.sd
arr.range
(lm1 <- lm(arr.sd~arr.mean))
(lnlm1 <- lm(log(arr.sd)~log(arr.mean)))
(lm2 <- lm(arr.range~arr.mean))
bitmap(file='test1.png')
plot(arr.mean,arr.sd,main='Standard Deviation-Mean Plot',xlab='mean',ylab='standard deviation')
dev.off()
bitmap(file='test2.png')
plot(arr.mean,arr.range,main='Range-Mean Plot',xlab='mean',ylab='range')
dev.off()
load(file='createtable')
a<-table.start()
a<-table.row.start(a)
a<-table.element(a,'Standard Deviation-Mean Plot',4,TRUE)
a<-table.row.end(a)
a<-table.row.start(a)
a<-table.element(a,'Section',header=TRUE)
a<-table.element(a,'Mean',header=TRUE)
a<-table.element(a,'Standard Deviation',header=TRUE)
a<-table.element(a,'Range',header=TRUE)
a<-table.row.end(a)
for (j in 1:np) {
a<-table.row.start(a)
a<-table.element(a,j,header=TRUE)
a<-table.element(a,arr.mean[j])
a<-table.element(a,arr.sd[j] )
a<-table.element(a,arr.range[j] )
a<-table.row.end(a)
}
a<-table.end(a)
table.save(a,file='mytable.tab')
a<-table.start()
a<-table.row.start(a)
a<-table.element(a,'Regression: S.E.(k) = alpha + beta * Mean(k)',2,TRUE)
a<-table.row.end(a)
a<-table.row.start(a)
a<-table.element(a,'alpha',header=TRUE)
a<-table.element(a,lm1$coefficients[[1]])
a<-table.row.end(a)
a<-table.row.start(a)
a<-table.element(a,'beta',header=TRUE)
a<-table.element(a,lm1$coefficients[[2]])
a<-table.row.end(a)
a<-table.row.start(a)
a<-table.element(a,'S.D.',header=TRUE)
a<-table.element(a,summary(lm1)$coefficients[2,2])
a<-table.row.end(a)
a<-table.row.start(a)
a<-table.element(a,'T-STAT',header=TRUE)
a<-table.element(a,summary(lm1)$coefficients[2,3])
a<-table.row.end(a)
a<-table.row.start(a)
a<-table.element(a,'p-value',header=TRUE)
a<-table.element(a,summary(lm1)$coefficients[2,4])
a<-table.row.end(a)
a<-table.end(a)
table.save(a,file='mytable1.tab')
a<-table.start()
a<-table.row.start(a)
a<-table.element(a,'Regression: ln S.E.(k) = alpha + beta * ln Mean(k)',2,TRUE)
a<-table.row.end(a)
a<-table.row.start(a)
a<-table.element(a,'alpha',header=TRUE)
a<-table.element(a,lnlm1$coefficients[[1]])
a<-table.row.end(a)
a<-table.row.start(a)
a<-table.element(a,'beta',header=TRUE)
a<-table.element(a,lnlm1$coefficients[[2]])
a<-table.row.end(a)
a<-table.row.start(a)
a<-table.element(a,'S.D.',header=TRUE)
a<-table.element(a,summary(lnlm1)$coefficients[2,2])
a<-table.row.end(a)
a<-table.row.start(a)
a<-table.element(a,'T-STAT',header=TRUE)
a<-table.element(a,summary(lnlm1)$coefficients[2,3])
a<-table.row.end(a)
a<-table.row.start(a)
a<-table.element(a,'p-value',header=TRUE)
a<-table.element(a,summary(lnlm1)$coefficients[2,4])
a<-table.row.end(a)
a<-table.row.start(a)
a<-table.element(a,'Lambda',header=TRUE)
a<-table.element(a,1-lnlm1$coefficients[[2]])
a<-table.row.end(a)
a<-table.end(a)
table.save(a,file='mytable2.tab')