Free Statistics

of Irreproducible Research!

Author's title

Author*The author of this computation has been verified*
R Software Modulerwasp_multipleregression.wasp
Title produced by softwareMultiple Regression
Date of computationTue, 15 Dec 2009 07:54:02 -0700
Cite this page as followsStatistical Computations at FreeStatistics.org, Office for Research Development and Education, URL https://freestatistics.org/blog/index.php?v=date/2009/Dec/15/t1260888959lgmh6dxrs2cv9re.htm/, Retrieved Wed, 08 May 2024 17:06:48 +0000
Statistical Computations at FreeStatistics.org, Office for Research Development and Education, URL https://freestatistics.org/blog/index.php?pk=67952, Retrieved Wed, 08 May 2024 17:06:48 +0000
QR Codes:

Original text written by user:
IsPrivate?No (this computation is public)
User-defined keywords
Estimated Impact161
Family? (F = Feedback message, R = changed R code, M = changed R Module, P = changed Parameters, D = changed Data)
-     [Multiple Regression] [Q1 The Seatbeltlaw] [2007-11-14 19:27:43] [8cd6641b921d30ebe00b648d1481bba0]
- RMPD  [Multiple Regression] [Seatbelt] [2009-11-12 13:54:52] [b98453cac15ba1066b407e146608df68]
-    D    [Multiple Regression] [] [2009-11-18 12:00:00] [6ba840d2473f9a55d7b3e13093db69b8]
-    D        [Multiple Regression] [] [2009-12-15 14:54:02] [830aa0f7fb5acd5849dbc0c6ad889830] [Current]
Feedback Forum

Post a new message
Dataseries X:
8.7	0
8.2	0
8.3	0
8.5	0
8.6	0
8.5	0
8.2	0
8.1	0
7.9	0
8.6	0
8.7	0
8.7	0
8.5	0
8.4	0
8.5	0
8.7	0
8.7	0
8.6	0
8.5	0
8.3	0
8	0
8.2	0
8.1	0
8.1	0
8	0
7.9	0
7.9	0
8	0
8	0
7.9	0
8	0
7.7	0
7.2	0
7.5	0
7.3	0
7	0
7	0
7	0
7.2	0
7.3	0
7.1	0
6.8	0
6.4	0
6.1	0
6.5	0
7.7	0
7.9	0
7.5	0
6.9	1
6.6	1
6.9	1
7.7	1
8	1
8	1
7.7	1
7.3	1
7.4	1
8.1	1
8.3	1
8.2	1


Summary of computational transaction
Raw Inputview raw input (R code)
Raw Outputview raw output of R engine
Computing time3 seconds
R Server'Gwilym Jenkins' @ 72.249.127.135

\begin{tabular}{lllllllll}
\hline
Summary of computational transaction \tabularnewline
Raw Input & view raw input (R code)  \tabularnewline
Raw Output & view raw output of R engine  \tabularnewline
Computing time & 3 seconds \tabularnewline
R Server & 'Gwilym Jenkins' @ 72.249.127.135 \tabularnewline
\hline
\end{tabular}
%Source: https://freestatistics.org/blog/index.php?pk=67952&T=0

[TABLE]
[ROW][C]Summary of computational transaction[/C][/ROW]
[ROW][C]Raw Input[/C][C]view raw input (R code) [/C][/ROW]
[ROW][C]Raw Output[/C][C]view raw output of R engine [/C][/ROW]
[ROW][C]Computing time[/C][C]3 seconds[/C][/ROW]
[ROW][C]R Server[/C][C]'Gwilym Jenkins' @ 72.249.127.135[/C][/ROW]
[/TABLE]
Source: https://freestatistics.org/blog/index.php?pk=67952&T=0

Globally Unique Identifier (entire table): ba.freestatistics.org/blog/index.php?pk=67952&T=0

As an alternative you can also use a QR Code:  

The GUIDs for individual cells are displayed in the table below:

Summary of computational transaction
Raw Inputview raw input (R code)
Raw Outputview raw output of R engine
Computing time3 seconds
R Server'Gwilym Jenkins' @ 72.249.127.135


Multiple Linear Regression - Estimated Regression Equation
Y[t] = + 7.88541666666666 -0.293749999999999X[t] + e[t]

\begin{tabular}{lllllllll}
\hline
Multiple Linear Regression - Estimated Regression Equation \tabularnewline
Y[t] =  +  7.88541666666666 -0.293749999999999X[t]  + e[t] \tabularnewline
\hline
\end{tabular}
%Source: https://freestatistics.org/blog/index.php?pk=67952&T=1

[TABLE]
[ROW][C]Multiple Linear Regression - Estimated Regression Equation[/C][/ROW]
[ROW][C]Y[t] =  +  7.88541666666666 -0.293749999999999X[t]  + e[t][/C][/ROW]
[/TABLE]
Source: https://freestatistics.org/blog/index.php?pk=67952&T=1

Globally Unique Identifier (entire table): ba.freestatistics.org/blog/index.php?pk=67952&T=1

As an alternative you can also use a QR Code:  

The GUIDs for individual cells are displayed in the table below:

Multiple Linear Regression - Estimated Regression Equation
Y[t] = + 7.88541666666666 -0.293749999999999X[t] + e[t]


Multiple Linear Regression - Ordinary Least Squares
VariableParameterS.D.T-STATH0: parameter = 02-tail p-value1-tail p-value
(Intercept)7.885416666666660.09447683.465100
X-0.2937499999999990.211254-1.39050.1696870.084844

\begin{tabular}{lllllllll}
\hline
Multiple Linear Regression - Ordinary Least Squares \tabularnewline
Variable & Parameter & S.D. & T-STATH0: parameter = 0 & 2-tail p-value & 1-tail p-value \tabularnewline
(Intercept) & 7.88541666666666 & 0.094476 & 83.4651 & 0 & 0 \tabularnewline
X & -0.293749999999999 & 0.211254 & -1.3905 & 0.169687 & 0.084844 \tabularnewline
\hline
\end{tabular}
%Source: https://freestatistics.org/blog/index.php?pk=67952&T=2

[TABLE]
[ROW][C]Multiple Linear Regression - Ordinary Least Squares[/C][/ROW]
[ROW][C]Variable[/C][C]Parameter[/C][C]S.D.[/C][C]T-STATH0: parameter = 0[/C][C]2-tail p-value[/C][C]1-tail p-value[/C][/ROW]
[ROW][C](Intercept)[/C][C]7.88541666666666[/C][C]0.094476[/C][C]83.4651[/C][C]0[/C][C]0[/C][/ROW]
[ROW][C]X[/C][C]-0.293749999999999[/C][C]0.211254[/C][C]-1.3905[/C][C]0.169687[/C][C]0.084844[/C][/ROW]
[/TABLE]
Source: https://freestatistics.org/blog/index.php?pk=67952&T=2

Globally Unique Identifier (entire table): ba.freestatistics.org/blog/index.php?pk=67952&T=2

As an alternative you can also use a QR Code:  

The GUIDs for individual cells are displayed in the table below:

Multiple Linear Regression - Ordinary Least Squares
VariableParameterS.D.T-STATH0: parameter = 02-tail p-value1-tail p-value
(Intercept)7.885416666666660.09447683.465100
X-0.2937499999999990.211254-1.39050.1696870.084844


Multiple Linear Regression - Regression Statistics
Multiple R0.179613316610986
R-squared0.0322609435039984
Adjusted R-squared0.0155757873575157
F-TEST (value)1.93351163278139
F-TEST (DF numerator)1
F-TEST (DF denominator)58
p-value0.169687496829789
Multiple Linear Regression - Residual Statistics
Residual Standard Deviation0.654545885398383
Sum Squared Residuals24.8489583333333

\begin{tabular}{lllllllll}
\hline
Multiple Linear Regression - Regression Statistics \tabularnewline
Multiple R & 0.179613316610986 \tabularnewline
R-squared & 0.0322609435039984 \tabularnewline
Adjusted R-squared & 0.0155757873575157 \tabularnewline
F-TEST (value) & 1.93351163278139 \tabularnewline
F-TEST (DF numerator) & 1 \tabularnewline
F-TEST (DF denominator) & 58 \tabularnewline
p-value & 0.169687496829789 \tabularnewline
Multiple Linear Regression - Residual Statistics \tabularnewline
Residual Standard Deviation & 0.654545885398383 \tabularnewline
Sum Squared Residuals & 24.8489583333333 \tabularnewline
\hline
\end{tabular}
%Source: https://freestatistics.org/blog/index.php?pk=67952&T=3

[TABLE]
[ROW][C]Multiple Linear Regression - Regression Statistics[/C][/ROW]
[ROW][C]Multiple R[/C][C]0.179613316610986[/C][/ROW]
[ROW][C]R-squared[/C][C]0.0322609435039984[/C][/ROW]
[ROW][C]Adjusted R-squared[/C][C]0.0155757873575157[/C][/ROW]
[ROW][C]F-TEST (value)[/C][C]1.93351163278139[/C][/ROW]
[ROW][C]F-TEST (DF numerator)[/C][C]1[/C][/ROW]
[ROW][C]F-TEST (DF denominator)[/C][C]58[/C][/ROW]
[ROW][C]p-value[/C][C]0.169687496829789[/C][/ROW]
[ROW][C]Multiple Linear Regression - Residual Statistics[/C][/ROW]
[ROW][C]Residual Standard Deviation[/C][C]0.654545885398383[/C][/ROW]
[ROW][C]Sum Squared Residuals[/C][C]24.8489583333333[/C][/ROW]
[/TABLE]
Source: https://freestatistics.org/blog/index.php?pk=67952&T=3

Globally Unique Identifier (entire table): ba.freestatistics.org/blog/index.php?pk=67952&T=3

As an alternative you can also use a QR Code:  

The GUIDs for individual cells are displayed in the table below:

Multiple Linear Regression - Regression Statistics
Multiple R0.179613316610986
R-squared0.0322609435039984
Adjusted R-squared0.0155757873575157
F-TEST (value)1.93351163278139
F-TEST (DF numerator)1
F-TEST (DF denominator)58
p-value0.169687496829789
Multiple Linear Regression - Residual Statistics
Residual Standard Deviation0.654545885398383
Sum Squared Residuals24.8489583333333


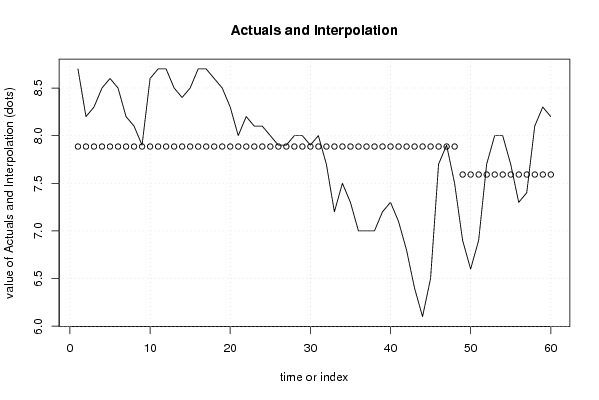
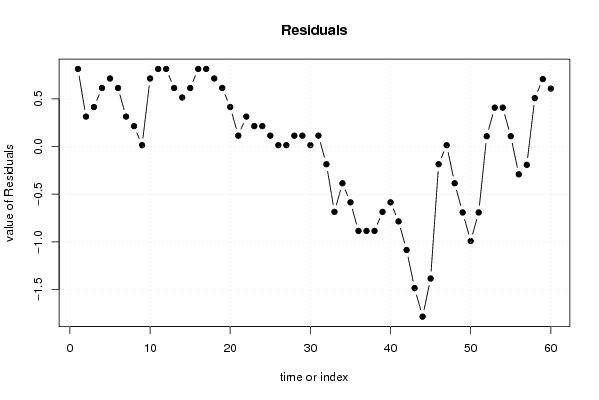
Multiple Linear Regression - Actuals, Interpolation, and Residuals
Time or IndexActualsInterpolationForecastResidualsPrediction Error
18.77.88541666666670.814583333333301
28.27.885416666666670.314583333333333
38.37.885416666666670.414583333333335
48.57.885416666666670.614583333333334
58.67.885416666666670.714583333333334
68.57.885416666666670.614583333333334
78.27.885416666666670.314583333333333
88.17.885416666666670.214583333333334
97.97.885416666666670.0145833333333344
108.67.885416666666670.714583333333334
118.77.885416666666670.814583333333333
128.77.885416666666670.814583333333333
138.57.885416666666670.614583333333334
148.47.885416666666670.514583333333334
158.57.885416666666670.614583333333334
168.77.885416666666670.814583333333333
178.77.885416666666670.814583333333333
188.67.885416666666670.714583333333334
198.57.885416666666670.614583333333334
208.37.885416666666670.414583333333335
2187.885416666666670.114583333333334
228.27.885416666666670.314583333333333
238.17.885416666666670.214583333333334
248.17.885416666666670.214583333333334
2587.885416666666670.114583333333334
267.97.885416666666670.0145833333333344
277.97.885416666666670.0145833333333344
2887.885416666666670.114583333333334
2987.885416666666670.114583333333334
307.97.885416666666670.0145833333333344
3187.885416666666670.114583333333334
327.77.88541666666667-0.185416666666666
337.27.88541666666667-0.685416666666666
347.57.88541666666667-0.385416666666666
357.37.88541666666667-0.585416666666666
3677.88541666666667-0.885416666666666
3777.88541666666667-0.885416666666666
3877.88541666666667-0.885416666666666
397.27.88541666666667-0.685416666666666
407.37.88541666666667-0.585416666666666
417.17.88541666666667-0.785416666666666
426.87.88541666666667-1.08541666666667
436.47.88541666666667-1.48541666666667
446.17.88541666666667-1.78541666666667
456.57.88541666666667-1.38541666666667
467.77.88541666666667-0.185416666666666
477.97.885416666666670.0145833333333344
487.57.88541666666667-0.385416666666666
496.97.59166666666667-0.691666666666666
506.67.59166666666667-0.991666666666667
516.97.59166666666667-0.691666666666666
527.77.591666666666670.108333333333333
5387.591666666666670.408333333333333
5487.591666666666670.408333333333333
557.77.591666666666670.108333333333333
567.37.59166666666667-0.291666666666667
577.47.59166666666667-0.191666666666666
588.17.591666666666670.508333333333333
598.37.591666666666670.708333333333334
608.27.591666666666670.608333333333333

\begin{tabular}{lllllllll}
\hline
Multiple Linear Regression - Actuals, Interpolation, and Residuals \tabularnewline
Time or Index & Actuals & InterpolationForecast & ResidualsPrediction Error \tabularnewline
1 & 8.7 & 7.8854166666667 & 0.814583333333301 \tabularnewline
2 & 8.2 & 7.88541666666667 & 0.314583333333333 \tabularnewline
3 & 8.3 & 7.88541666666667 & 0.414583333333335 \tabularnewline
4 & 8.5 & 7.88541666666667 & 0.614583333333334 \tabularnewline
5 & 8.6 & 7.88541666666667 & 0.714583333333334 \tabularnewline
6 & 8.5 & 7.88541666666667 & 0.614583333333334 \tabularnewline
7 & 8.2 & 7.88541666666667 & 0.314583333333333 \tabularnewline
8 & 8.1 & 7.88541666666667 & 0.214583333333334 \tabularnewline
9 & 7.9 & 7.88541666666667 & 0.0145833333333344 \tabularnewline
10 & 8.6 & 7.88541666666667 & 0.714583333333334 \tabularnewline
11 & 8.7 & 7.88541666666667 & 0.814583333333333 \tabularnewline
12 & 8.7 & 7.88541666666667 & 0.814583333333333 \tabularnewline
13 & 8.5 & 7.88541666666667 & 0.614583333333334 \tabularnewline
14 & 8.4 & 7.88541666666667 & 0.514583333333334 \tabularnewline
15 & 8.5 & 7.88541666666667 & 0.614583333333334 \tabularnewline
16 & 8.7 & 7.88541666666667 & 0.814583333333333 \tabularnewline
17 & 8.7 & 7.88541666666667 & 0.814583333333333 \tabularnewline
18 & 8.6 & 7.88541666666667 & 0.714583333333334 \tabularnewline
19 & 8.5 & 7.88541666666667 & 0.614583333333334 \tabularnewline
20 & 8.3 & 7.88541666666667 & 0.414583333333335 \tabularnewline
21 & 8 & 7.88541666666667 & 0.114583333333334 \tabularnewline
22 & 8.2 & 7.88541666666667 & 0.314583333333333 \tabularnewline
23 & 8.1 & 7.88541666666667 & 0.214583333333334 \tabularnewline
24 & 8.1 & 7.88541666666667 & 0.214583333333334 \tabularnewline
25 & 8 & 7.88541666666667 & 0.114583333333334 \tabularnewline
26 & 7.9 & 7.88541666666667 & 0.0145833333333344 \tabularnewline
27 & 7.9 & 7.88541666666667 & 0.0145833333333344 \tabularnewline
28 & 8 & 7.88541666666667 & 0.114583333333334 \tabularnewline
29 & 8 & 7.88541666666667 & 0.114583333333334 \tabularnewline
30 & 7.9 & 7.88541666666667 & 0.0145833333333344 \tabularnewline
31 & 8 & 7.88541666666667 & 0.114583333333334 \tabularnewline
32 & 7.7 & 7.88541666666667 & -0.185416666666666 \tabularnewline
33 & 7.2 & 7.88541666666667 & -0.685416666666666 \tabularnewline
34 & 7.5 & 7.88541666666667 & -0.385416666666666 \tabularnewline
35 & 7.3 & 7.88541666666667 & -0.585416666666666 \tabularnewline
36 & 7 & 7.88541666666667 & -0.885416666666666 \tabularnewline
37 & 7 & 7.88541666666667 & -0.885416666666666 \tabularnewline
38 & 7 & 7.88541666666667 & -0.885416666666666 \tabularnewline
39 & 7.2 & 7.88541666666667 & -0.685416666666666 \tabularnewline
40 & 7.3 & 7.88541666666667 & -0.585416666666666 \tabularnewline
41 & 7.1 & 7.88541666666667 & -0.785416666666666 \tabularnewline
42 & 6.8 & 7.88541666666667 & -1.08541666666667 \tabularnewline
43 & 6.4 & 7.88541666666667 & -1.48541666666667 \tabularnewline
44 & 6.1 & 7.88541666666667 & -1.78541666666667 \tabularnewline
45 & 6.5 & 7.88541666666667 & -1.38541666666667 \tabularnewline
46 & 7.7 & 7.88541666666667 & -0.185416666666666 \tabularnewline
47 & 7.9 & 7.88541666666667 & 0.0145833333333344 \tabularnewline
48 & 7.5 & 7.88541666666667 & -0.385416666666666 \tabularnewline
49 & 6.9 & 7.59166666666667 & -0.691666666666666 \tabularnewline
50 & 6.6 & 7.59166666666667 & -0.991666666666667 \tabularnewline
51 & 6.9 & 7.59166666666667 & -0.691666666666666 \tabularnewline
52 & 7.7 & 7.59166666666667 & 0.108333333333333 \tabularnewline
53 & 8 & 7.59166666666667 & 0.408333333333333 \tabularnewline
54 & 8 & 7.59166666666667 & 0.408333333333333 \tabularnewline
55 & 7.7 & 7.59166666666667 & 0.108333333333333 \tabularnewline
56 & 7.3 & 7.59166666666667 & -0.291666666666667 \tabularnewline
57 & 7.4 & 7.59166666666667 & -0.191666666666666 \tabularnewline
58 & 8.1 & 7.59166666666667 & 0.508333333333333 \tabularnewline
59 & 8.3 & 7.59166666666667 & 0.708333333333334 \tabularnewline
60 & 8.2 & 7.59166666666667 & 0.608333333333333 \tabularnewline
\hline
\end{tabular}
%Source: https://freestatistics.org/blog/index.php?pk=67952&T=4

[TABLE]
[ROW][C]Multiple Linear Regression - Actuals, Interpolation, and Residuals[/C][/ROW]
[ROW][C]Time or Index[/C][C]Actuals[/C][C]InterpolationForecast[/C][C]ResidualsPrediction Error[/C][/ROW]
[ROW][C]1[/C][C]8.7[/C][C]7.8854166666667[/C][C]0.814583333333301[/C][/ROW]
[ROW][C]2[/C][C]8.2[/C][C]7.88541666666667[/C][C]0.314583333333333[/C][/ROW]
[ROW][C]3[/C][C]8.3[/C][C]7.88541666666667[/C][C]0.414583333333335[/C][/ROW]
[ROW][C]4[/C][C]8.5[/C][C]7.88541666666667[/C][C]0.614583333333334[/C][/ROW]
[ROW][C]5[/C][C]8.6[/C][C]7.88541666666667[/C][C]0.714583333333334[/C][/ROW]
[ROW][C]6[/C][C]8.5[/C][C]7.88541666666667[/C][C]0.614583333333334[/C][/ROW]
[ROW][C]7[/C][C]8.2[/C][C]7.88541666666667[/C][C]0.314583333333333[/C][/ROW]
[ROW][C]8[/C][C]8.1[/C][C]7.88541666666667[/C][C]0.214583333333334[/C][/ROW]
[ROW][C]9[/C][C]7.9[/C][C]7.88541666666667[/C][C]0.0145833333333344[/C][/ROW]
[ROW][C]10[/C][C]8.6[/C][C]7.88541666666667[/C][C]0.714583333333334[/C][/ROW]
[ROW][C]11[/C][C]8.7[/C][C]7.88541666666667[/C][C]0.814583333333333[/C][/ROW]
[ROW][C]12[/C][C]8.7[/C][C]7.88541666666667[/C][C]0.814583333333333[/C][/ROW]
[ROW][C]13[/C][C]8.5[/C][C]7.88541666666667[/C][C]0.614583333333334[/C][/ROW]
[ROW][C]14[/C][C]8.4[/C][C]7.88541666666667[/C][C]0.514583333333334[/C][/ROW]
[ROW][C]15[/C][C]8.5[/C][C]7.88541666666667[/C][C]0.614583333333334[/C][/ROW]
[ROW][C]16[/C][C]8.7[/C][C]7.88541666666667[/C][C]0.814583333333333[/C][/ROW]
[ROW][C]17[/C][C]8.7[/C][C]7.88541666666667[/C][C]0.814583333333333[/C][/ROW]
[ROW][C]18[/C][C]8.6[/C][C]7.88541666666667[/C][C]0.714583333333334[/C][/ROW]
[ROW][C]19[/C][C]8.5[/C][C]7.88541666666667[/C][C]0.614583333333334[/C][/ROW]
[ROW][C]20[/C][C]8.3[/C][C]7.88541666666667[/C][C]0.414583333333335[/C][/ROW]
[ROW][C]21[/C][C]8[/C][C]7.88541666666667[/C][C]0.114583333333334[/C][/ROW]
[ROW][C]22[/C][C]8.2[/C][C]7.88541666666667[/C][C]0.314583333333333[/C][/ROW]
[ROW][C]23[/C][C]8.1[/C][C]7.88541666666667[/C][C]0.214583333333334[/C][/ROW]
[ROW][C]24[/C][C]8.1[/C][C]7.88541666666667[/C][C]0.214583333333334[/C][/ROW]
[ROW][C]25[/C][C]8[/C][C]7.88541666666667[/C][C]0.114583333333334[/C][/ROW]
[ROW][C]26[/C][C]7.9[/C][C]7.88541666666667[/C][C]0.0145833333333344[/C][/ROW]
[ROW][C]27[/C][C]7.9[/C][C]7.88541666666667[/C][C]0.0145833333333344[/C][/ROW]
[ROW][C]28[/C][C]8[/C][C]7.88541666666667[/C][C]0.114583333333334[/C][/ROW]
[ROW][C]29[/C][C]8[/C][C]7.88541666666667[/C][C]0.114583333333334[/C][/ROW]
[ROW][C]30[/C][C]7.9[/C][C]7.88541666666667[/C][C]0.0145833333333344[/C][/ROW]
[ROW][C]31[/C][C]8[/C][C]7.88541666666667[/C][C]0.114583333333334[/C][/ROW]
[ROW][C]32[/C][C]7.7[/C][C]7.88541666666667[/C][C]-0.185416666666666[/C][/ROW]
[ROW][C]33[/C][C]7.2[/C][C]7.88541666666667[/C][C]-0.685416666666666[/C][/ROW]
[ROW][C]34[/C][C]7.5[/C][C]7.88541666666667[/C][C]-0.385416666666666[/C][/ROW]
[ROW][C]35[/C][C]7.3[/C][C]7.88541666666667[/C][C]-0.585416666666666[/C][/ROW]
[ROW][C]36[/C][C]7[/C][C]7.88541666666667[/C][C]-0.885416666666666[/C][/ROW]
[ROW][C]37[/C][C]7[/C][C]7.88541666666667[/C][C]-0.885416666666666[/C][/ROW]
[ROW][C]38[/C][C]7[/C][C]7.88541666666667[/C][C]-0.885416666666666[/C][/ROW]
[ROW][C]39[/C][C]7.2[/C][C]7.88541666666667[/C][C]-0.685416666666666[/C][/ROW]
[ROW][C]40[/C][C]7.3[/C][C]7.88541666666667[/C][C]-0.585416666666666[/C][/ROW]
[ROW][C]41[/C][C]7.1[/C][C]7.88541666666667[/C][C]-0.785416666666666[/C][/ROW]
[ROW][C]42[/C][C]6.8[/C][C]7.88541666666667[/C][C]-1.08541666666667[/C][/ROW]
[ROW][C]43[/C][C]6.4[/C][C]7.88541666666667[/C][C]-1.48541666666667[/C][/ROW]
[ROW][C]44[/C][C]6.1[/C][C]7.88541666666667[/C][C]-1.78541666666667[/C][/ROW]
[ROW][C]45[/C][C]6.5[/C][C]7.88541666666667[/C][C]-1.38541666666667[/C][/ROW]
[ROW][C]46[/C][C]7.7[/C][C]7.88541666666667[/C][C]-0.185416666666666[/C][/ROW]
[ROW][C]47[/C][C]7.9[/C][C]7.88541666666667[/C][C]0.0145833333333344[/C][/ROW]
[ROW][C]48[/C][C]7.5[/C][C]7.88541666666667[/C][C]-0.385416666666666[/C][/ROW]
[ROW][C]49[/C][C]6.9[/C][C]7.59166666666667[/C][C]-0.691666666666666[/C][/ROW]
[ROW][C]50[/C][C]6.6[/C][C]7.59166666666667[/C][C]-0.991666666666667[/C][/ROW]
[ROW][C]51[/C][C]6.9[/C][C]7.59166666666667[/C][C]-0.691666666666666[/C][/ROW]
[ROW][C]52[/C][C]7.7[/C][C]7.59166666666667[/C][C]0.108333333333333[/C][/ROW]
[ROW][C]53[/C][C]8[/C][C]7.59166666666667[/C][C]0.408333333333333[/C][/ROW]
[ROW][C]54[/C][C]8[/C][C]7.59166666666667[/C][C]0.408333333333333[/C][/ROW]
[ROW][C]55[/C][C]7.7[/C][C]7.59166666666667[/C][C]0.108333333333333[/C][/ROW]
[ROW][C]56[/C][C]7.3[/C][C]7.59166666666667[/C][C]-0.291666666666667[/C][/ROW]
[ROW][C]57[/C][C]7.4[/C][C]7.59166666666667[/C][C]-0.191666666666666[/C][/ROW]
[ROW][C]58[/C][C]8.1[/C][C]7.59166666666667[/C][C]0.508333333333333[/C][/ROW]
[ROW][C]59[/C][C]8.3[/C][C]7.59166666666667[/C][C]0.708333333333334[/C][/ROW]
[ROW][C]60[/C][C]8.2[/C][C]7.59166666666667[/C][C]0.608333333333333[/C][/ROW]
[/TABLE]
Source: https://freestatistics.org/blog/index.php?pk=67952&T=4

Globally Unique Identifier (entire table): ba.freestatistics.org/blog/index.php?pk=67952&T=4

As an alternative you can also use a QR Code:  

The GUIDs for individual cells are displayed in the table below:

Multiple Linear Regression - Actuals, Interpolation, and Residuals
Time or IndexActualsInterpolationForecastResidualsPrediction Error
18.77.88541666666670.814583333333301
28.27.885416666666670.314583333333333
38.37.885416666666670.414583333333335
48.57.885416666666670.614583333333334
58.67.885416666666670.714583333333334
68.57.885416666666670.614583333333334
78.27.885416666666670.314583333333333
88.17.885416666666670.214583333333334
97.97.885416666666670.0145833333333344
108.67.885416666666670.714583333333334
118.77.885416666666670.814583333333333
128.77.885416666666670.814583333333333
138.57.885416666666670.614583333333334
148.47.885416666666670.514583333333334
158.57.885416666666670.614583333333334
168.77.885416666666670.814583333333333
178.77.885416666666670.814583333333333
188.67.885416666666670.714583333333334
198.57.885416666666670.614583333333334
208.37.885416666666670.414583333333335
2187.885416666666670.114583333333334
228.27.885416666666670.314583333333333
238.17.885416666666670.214583333333334
248.17.885416666666670.214583333333334
2587.885416666666670.114583333333334
267.97.885416666666670.0145833333333344
277.97.885416666666670.0145833333333344
2887.885416666666670.114583333333334
2987.885416666666670.114583333333334
307.97.885416666666670.0145833333333344
3187.885416666666670.114583333333334
327.77.88541666666667-0.185416666666666
337.27.88541666666667-0.685416666666666
347.57.88541666666667-0.385416666666666
357.37.88541666666667-0.585416666666666
3677.88541666666667-0.885416666666666
3777.88541666666667-0.885416666666666
3877.88541666666667-0.885416666666666
397.27.88541666666667-0.685416666666666
407.37.88541666666667-0.585416666666666
417.17.88541666666667-0.785416666666666
426.87.88541666666667-1.08541666666667
436.47.88541666666667-1.48541666666667
446.17.88541666666667-1.78541666666667
456.57.88541666666667-1.38541666666667
467.77.88541666666667-0.185416666666666
477.97.885416666666670.0145833333333344
487.57.88541666666667-0.385416666666666
496.97.59166666666667-0.691666666666666
506.67.59166666666667-0.991666666666667
516.97.59166666666667-0.691666666666666
527.77.591666666666670.108333333333333
5387.591666666666670.408333333333333
5487.591666666666670.408333333333333
557.77.591666666666670.108333333333333
567.37.59166666666667-0.291666666666667
577.47.59166666666667-0.191666666666666
588.17.591666666666670.508333333333333
598.37.591666666666670.708333333333334
608.27.591666666666670.608333333333333


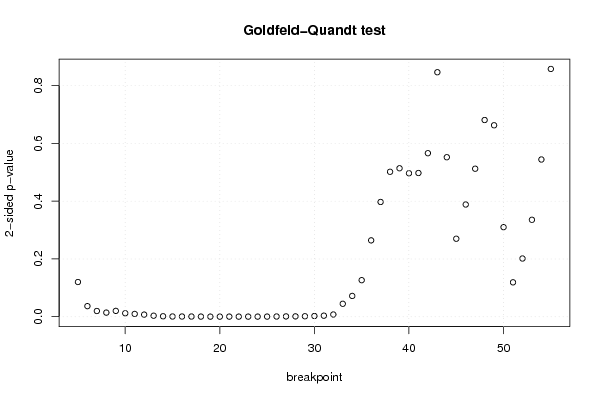
Goldfeld-Quandt test for Heteroskedasticity
p-valuesAlternative Hypothesis
breakpoint indexgreater2-sidedless
50.0600569518272150.120113903654430.939943048172785
60.01828408076938240.03656816153876470.981715919230618
70.009864838436533340.01972967687306670.990135161563467
80.007080882043929660.01416176408785930.99291911795607
90.01009677250526570.02019354501053140.989903227494734
100.00601191550157350.0120238310031470.993988084498427
110.004787560428316710.009575120856633430.995212439571683
120.003619315328602240.007238630657204490.996380684671398
130.001710481554613160.003420963109226310.998289518445387
140.0007493979865261770.001498795973052350.999250602013474
150.0003552744454553360.0007105488909106730.999644725554545
160.0003082211839308450.0006164423678616890.999691778816069
170.0002797672772006550.000559534554401310.9997202327228
180.0001961112652129830.0003922225304259660.999803888734787
190.0001221742658843360.0002443485317686730.999877825734116
208.20704842270747e-050.0001641409684541490.999917929515773
210.0001486321702946520.0002972643405893040.999851367829705
220.0001224874017855480.0002449748035710960.999877512598214
230.0001298770392216470.0002597540784432940.999870122960778
240.0001371431667089170.0002742863334178340.99986285683329
250.0001874576951281900.0003749153902563810.999812542304872
260.0003237524062905830.0006475048125811660.99967624759371
270.0004958348408057560.0009916696816115110.999504165159194
280.0006032842453867640.001206568490773530.999396715754613
290.0007731813758575790.001546362751715160.999226818624142
300.001172414282547170.002344828565094340.998827585717453
310.001759475087291980.003518950174583960.998240524912708
320.003803296061188250.007606592122376510.996196703938812
330.02234573197577830.04469146395155670.977654268024222
340.03593657864131680.07187315728263360.964063421358683
350.06323533194934160.1264706638986830.936764668050658
360.1321498783309010.2642997566618020.867850121669099
370.1986441370888140.3972882741776290.801355862911186
380.2508655135967920.5017310271935850.749134486403208
390.2569569723293710.5139139446587420.743043027670629
400.2483067100107570.4966134200215150.751693289989243
410.2487743921118040.4975487842236080.751225607888196
420.2830424815533380.5660849631066760.716957518446662
430.4232090670914480.8464181341828960.576790932908552
440.7239151222739330.5521697554521340.276084877726067
450.8650207021861370.2699585956277260.134979297813863
460.8057747083104790.3884505833790420.194225291689521
470.7438153151191070.5123693697617860.256184684880893
480.6595106619767870.6809786760464260.340489338023213
490.668585672737770.6628286545244590.331414327262229
500.8449986327422910.3100027345154180.155001367257709
510.940487079343050.1190258413139000.0595129206569498
520.899257568961680.2014848620766410.100742431038320
530.832242402871680.3355151942566390.167757597128319
540.7278542598396940.5442914803206120.272145740160306
550.5710888852590330.8578222294819330.428911114740966

\begin{tabular}{lllllllll}
\hline
Goldfeld-Quandt test for Heteroskedasticity \tabularnewline
p-values & Alternative Hypothesis \tabularnewline
breakpoint index & greater & 2-sided & less \tabularnewline
5 & 0.060056951827215 & 0.12011390365443 & 0.939943048172785 \tabularnewline
6 & 0.0182840807693824 & 0.0365681615387647 & 0.981715919230618 \tabularnewline
7 & 0.00986483843653334 & 0.0197296768730667 & 0.990135161563467 \tabularnewline
8 & 0.00708088204392966 & 0.0141617640878593 & 0.99291911795607 \tabularnewline
9 & 0.0100967725052657 & 0.0201935450105314 & 0.989903227494734 \tabularnewline
10 & 0.0060119155015735 & 0.012023831003147 & 0.993988084498427 \tabularnewline
11 & 0.00478756042831671 & 0.00957512085663343 & 0.995212439571683 \tabularnewline
12 & 0.00361931532860224 & 0.00723863065720449 & 0.996380684671398 \tabularnewline
13 & 0.00171048155461316 & 0.00342096310922631 & 0.998289518445387 \tabularnewline
14 & 0.000749397986526177 & 0.00149879597305235 & 0.999250602013474 \tabularnewline
15 & 0.000355274445455336 & 0.000710548890910673 & 0.999644725554545 \tabularnewline
16 & 0.000308221183930845 & 0.000616442367861689 & 0.999691778816069 \tabularnewline
17 & 0.000279767277200655 & 0.00055953455440131 & 0.9997202327228 \tabularnewline
18 & 0.000196111265212983 & 0.000392222530425966 & 0.999803888734787 \tabularnewline
19 & 0.000122174265884336 & 0.000244348531768673 & 0.999877825734116 \tabularnewline
20 & 8.20704842270747e-05 & 0.000164140968454149 & 0.999917929515773 \tabularnewline
21 & 0.000148632170294652 & 0.000297264340589304 & 0.999851367829705 \tabularnewline
22 & 0.000122487401785548 & 0.000244974803571096 & 0.999877512598214 \tabularnewline
23 & 0.000129877039221647 & 0.000259754078443294 & 0.999870122960778 \tabularnewline
24 & 0.000137143166708917 & 0.000274286333417834 & 0.99986285683329 \tabularnewline
25 & 0.000187457695128190 & 0.000374915390256381 & 0.999812542304872 \tabularnewline
26 & 0.000323752406290583 & 0.000647504812581166 & 0.99967624759371 \tabularnewline
27 & 0.000495834840805756 & 0.000991669681611511 & 0.999504165159194 \tabularnewline
28 & 0.000603284245386764 & 0.00120656849077353 & 0.999396715754613 \tabularnewline
29 & 0.000773181375857579 & 0.00154636275171516 & 0.999226818624142 \tabularnewline
30 & 0.00117241428254717 & 0.00234482856509434 & 0.998827585717453 \tabularnewline
31 & 0.00175947508729198 & 0.00351895017458396 & 0.998240524912708 \tabularnewline
32 & 0.00380329606118825 & 0.00760659212237651 & 0.996196703938812 \tabularnewline
33 & 0.0223457319757783 & 0.0446914639515567 & 0.977654268024222 \tabularnewline
34 & 0.0359365786413168 & 0.0718731572826336 & 0.964063421358683 \tabularnewline
35 & 0.0632353319493416 & 0.126470663898683 & 0.936764668050658 \tabularnewline
36 & 0.132149878330901 & 0.264299756661802 & 0.867850121669099 \tabularnewline
37 & 0.198644137088814 & 0.397288274177629 & 0.801355862911186 \tabularnewline
38 & 0.250865513596792 & 0.501731027193585 & 0.749134486403208 \tabularnewline
39 & 0.256956972329371 & 0.513913944658742 & 0.743043027670629 \tabularnewline
40 & 0.248306710010757 & 0.496613420021515 & 0.751693289989243 \tabularnewline
41 & 0.248774392111804 & 0.497548784223608 & 0.751225607888196 \tabularnewline
42 & 0.283042481553338 & 0.566084963106676 & 0.716957518446662 \tabularnewline
43 & 0.423209067091448 & 0.846418134182896 & 0.576790932908552 \tabularnewline
44 & 0.723915122273933 & 0.552169755452134 & 0.276084877726067 \tabularnewline
45 & 0.865020702186137 & 0.269958595627726 & 0.134979297813863 \tabularnewline
46 & 0.805774708310479 & 0.388450583379042 & 0.194225291689521 \tabularnewline
47 & 0.743815315119107 & 0.512369369761786 & 0.256184684880893 \tabularnewline
48 & 0.659510661976787 & 0.680978676046426 & 0.340489338023213 \tabularnewline
49 & 0.66858567273777 & 0.662828654524459 & 0.331414327262229 \tabularnewline
50 & 0.844998632742291 & 0.310002734515418 & 0.155001367257709 \tabularnewline
51 & 0.94048707934305 & 0.119025841313900 & 0.0595129206569498 \tabularnewline
52 & 0.89925756896168 & 0.201484862076641 & 0.100742431038320 \tabularnewline
53 & 0.83224240287168 & 0.335515194256639 & 0.167757597128319 \tabularnewline
54 & 0.727854259839694 & 0.544291480320612 & 0.272145740160306 \tabularnewline
55 & 0.571088885259033 & 0.857822229481933 & 0.428911114740966 \tabularnewline
\hline
\end{tabular}
%Source: https://freestatistics.org/blog/index.php?pk=67952&T=5

[TABLE]
[ROW][C]Goldfeld-Quandt test for Heteroskedasticity[/C][/ROW]
[ROW][C]p-values[/C][C]Alternative Hypothesis[/C][/ROW]
[ROW][C]breakpoint index[/C][C]greater[/C][C]2-sided[/C][C]less[/C][/ROW]
[ROW][C]5[/C][C]0.060056951827215[/C][C]0.12011390365443[/C][C]0.939943048172785[/C][/ROW]
[ROW][C]6[/C][C]0.0182840807693824[/C][C]0.0365681615387647[/C][C]0.981715919230618[/C][/ROW]
[ROW][C]7[/C][C]0.00986483843653334[/C][C]0.0197296768730667[/C][C]0.990135161563467[/C][/ROW]
[ROW][C]8[/C][C]0.00708088204392966[/C][C]0.0141617640878593[/C][C]0.99291911795607[/C][/ROW]
[ROW][C]9[/C][C]0.0100967725052657[/C][C]0.0201935450105314[/C][C]0.989903227494734[/C][/ROW]
[ROW][C]10[/C][C]0.0060119155015735[/C][C]0.012023831003147[/C][C]0.993988084498427[/C][/ROW]
[ROW][C]11[/C][C]0.00478756042831671[/C][C]0.00957512085663343[/C][C]0.995212439571683[/C][/ROW]
[ROW][C]12[/C][C]0.00361931532860224[/C][C]0.00723863065720449[/C][C]0.996380684671398[/C][/ROW]
[ROW][C]13[/C][C]0.00171048155461316[/C][C]0.00342096310922631[/C][C]0.998289518445387[/C][/ROW]
[ROW][C]14[/C][C]0.000749397986526177[/C][C]0.00149879597305235[/C][C]0.999250602013474[/C][/ROW]
[ROW][C]15[/C][C]0.000355274445455336[/C][C]0.000710548890910673[/C][C]0.999644725554545[/C][/ROW]
[ROW][C]16[/C][C]0.000308221183930845[/C][C]0.000616442367861689[/C][C]0.999691778816069[/C][/ROW]
[ROW][C]17[/C][C]0.000279767277200655[/C][C]0.00055953455440131[/C][C]0.9997202327228[/C][/ROW]
[ROW][C]18[/C][C]0.000196111265212983[/C][C]0.000392222530425966[/C][C]0.999803888734787[/C][/ROW]
[ROW][C]19[/C][C]0.000122174265884336[/C][C]0.000244348531768673[/C][C]0.999877825734116[/C][/ROW]
[ROW][C]20[/C][C]8.20704842270747e-05[/C][C]0.000164140968454149[/C][C]0.999917929515773[/C][/ROW]
[ROW][C]21[/C][C]0.000148632170294652[/C][C]0.000297264340589304[/C][C]0.999851367829705[/C][/ROW]
[ROW][C]22[/C][C]0.000122487401785548[/C][C]0.000244974803571096[/C][C]0.999877512598214[/C][/ROW]
[ROW][C]23[/C][C]0.000129877039221647[/C][C]0.000259754078443294[/C][C]0.999870122960778[/C][/ROW]
[ROW][C]24[/C][C]0.000137143166708917[/C][C]0.000274286333417834[/C][C]0.99986285683329[/C][/ROW]
[ROW][C]25[/C][C]0.000187457695128190[/C][C]0.000374915390256381[/C][C]0.999812542304872[/C][/ROW]
[ROW][C]26[/C][C]0.000323752406290583[/C][C]0.000647504812581166[/C][C]0.99967624759371[/C][/ROW]
[ROW][C]27[/C][C]0.000495834840805756[/C][C]0.000991669681611511[/C][C]0.999504165159194[/C][/ROW]
[ROW][C]28[/C][C]0.000603284245386764[/C][C]0.00120656849077353[/C][C]0.999396715754613[/C][/ROW]
[ROW][C]29[/C][C]0.000773181375857579[/C][C]0.00154636275171516[/C][C]0.999226818624142[/C][/ROW]
[ROW][C]30[/C][C]0.00117241428254717[/C][C]0.00234482856509434[/C][C]0.998827585717453[/C][/ROW]
[ROW][C]31[/C][C]0.00175947508729198[/C][C]0.00351895017458396[/C][C]0.998240524912708[/C][/ROW]
[ROW][C]32[/C][C]0.00380329606118825[/C][C]0.00760659212237651[/C][C]0.996196703938812[/C][/ROW]
[ROW][C]33[/C][C]0.0223457319757783[/C][C]0.0446914639515567[/C][C]0.977654268024222[/C][/ROW]
[ROW][C]34[/C][C]0.0359365786413168[/C][C]0.0718731572826336[/C][C]0.964063421358683[/C][/ROW]
[ROW][C]35[/C][C]0.0632353319493416[/C][C]0.126470663898683[/C][C]0.936764668050658[/C][/ROW]
[ROW][C]36[/C][C]0.132149878330901[/C][C]0.264299756661802[/C][C]0.867850121669099[/C][/ROW]
[ROW][C]37[/C][C]0.198644137088814[/C][C]0.397288274177629[/C][C]0.801355862911186[/C][/ROW]
[ROW][C]38[/C][C]0.250865513596792[/C][C]0.501731027193585[/C][C]0.749134486403208[/C][/ROW]
[ROW][C]39[/C][C]0.256956972329371[/C][C]0.513913944658742[/C][C]0.743043027670629[/C][/ROW]
[ROW][C]40[/C][C]0.248306710010757[/C][C]0.496613420021515[/C][C]0.751693289989243[/C][/ROW]
[ROW][C]41[/C][C]0.248774392111804[/C][C]0.497548784223608[/C][C]0.751225607888196[/C][/ROW]
[ROW][C]42[/C][C]0.283042481553338[/C][C]0.566084963106676[/C][C]0.716957518446662[/C][/ROW]
[ROW][C]43[/C][C]0.423209067091448[/C][C]0.846418134182896[/C][C]0.576790932908552[/C][/ROW]
[ROW][C]44[/C][C]0.723915122273933[/C][C]0.552169755452134[/C][C]0.276084877726067[/C][/ROW]
[ROW][C]45[/C][C]0.865020702186137[/C][C]0.269958595627726[/C][C]0.134979297813863[/C][/ROW]
[ROW][C]46[/C][C]0.805774708310479[/C][C]0.388450583379042[/C][C]0.194225291689521[/C][/ROW]
[ROW][C]47[/C][C]0.743815315119107[/C][C]0.512369369761786[/C][C]0.256184684880893[/C][/ROW]
[ROW][C]48[/C][C]0.659510661976787[/C][C]0.680978676046426[/C][C]0.340489338023213[/C][/ROW]
[ROW][C]49[/C][C]0.66858567273777[/C][C]0.662828654524459[/C][C]0.331414327262229[/C][/ROW]
[ROW][C]50[/C][C]0.844998632742291[/C][C]0.310002734515418[/C][C]0.155001367257709[/C][/ROW]
[ROW][C]51[/C][C]0.94048707934305[/C][C]0.119025841313900[/C][C]0.0595129206569498[/C][/ROW]
[ROW][C]52[/C][C]0.89925756896168[/C][C]0.201484862076641[/C][C]0.100742431038320[/C][/ROW]
[ROW][C]53[/C][C]0.83224240287168[/C][C]0.335515194256639[/C][C]0.167757597128319[/C][/ROW]
[ROW][C]54[/C][C]0.727854259839694[/C][C]0.544291480320612[/C][C]0.272145740160306[/C][/ROW]
[ROW][C]55[/C][C]0.571088885259033[/C][C]0.857822229481933[/C][C]0.428911114740966[/C][/ROW]
[/TABLE]
Source: https://freestatistics.org/blog/index.php?pk=67952&T=5

Globally Unique Identifier (entire table): ba.freestatistics.org/blog/index.php?pk=67952&T=5

As an alternative you can also use a QR Code:  

The GUIDs for individual cells are displayed in the table below:

Goldfeld-Quandt test for Heteroskedasticity
p-valuesAlternative Hypothesis
breakpoint indexgreater2-sidedless
50.0600569518272150.120113903654430.939943048172785
60.01828408076938240.03656816153876470.981715919230618
70.009864838436533340.01972967687306670.990135161563467
80.007080882043929660.01416176408785930.99291911795607
90.01009677250526570.02019354501053140.989903227494734
100.00601191550157350.0120238310031470.993988084498427
110.004787560428316710.009575120856633430.995212439571683
120.003619315328602240.007238630657204490.996380684671398
130.001710481554613160.003420963109226310.998289518445387
140.0007493979865261770.001498795973052350.999250602013474
150.0003552744454553360.0007105488909106730.999644725554545
160.0003082211839308450.0006164423678616890.999691778816069
170.0002797672772006550.000559534554401310.9997202327228
180.0001961112652129830.0003922225304259660.999803888734787
190.0001221742658843360.0002443485317686730.999877825734116
208.20704842270747e-050.0001641409684541490.999917929515773
210.0001486321702946520.0002972643405893040.999851367829705
220.0001224874017855480.0002449748035710960.999877512598214
230.0001298770392216470.0002597540784432940.999870122960778
240.0001371431667089170.0002742863334178340.99986285683329
250.0001874576951281900.0003749153902563810.999812542304872
260.0003237524062905830.0006475048125811660.99967624759371
270.0004958348408057560.0009916696816115110.999504165159194
280.0006032842453867640.001206568490773530.999396715754613
290.0007731813758575790.001546362751715160.999226818624142
300.001172414282547170.002344828565094340.998827585717453
310.001759475087291980.003518950174583960.998240524912708
320.003803296061188250.007606592122376510.996196703938812
330.02234573197577830.04469146395155670.977654268024222
340.03593657864131680.07187315728263360.964063421358683
350.06323533194934160.1264706638986830.936764668050658
360.1321498783309010.2642997566618020.867850121669099
370.1986441370888140.3972882741776290.801355862911186
380.2508655135967920.5017310271935850.749134486403208
390.2569569723293710.5139139446587420.743043027670629
400.2483067100107570.4966134200215150.751693289989243
410.2487743921118040.4975487842236080.751225607888196
420.2830424815533380.5660849631066760.716957518446662
430.4232090670914480.8464181341828960.576790932908552
440.7239151222739330.5521697554521340.276084877726067
450.8650207021861370.2699585956277260.134979297813863
460.8057747083104790.3884505833790420.194225291689521
470.7438153151191070.5123693697617860.256184684880893
480.6595106619767870.6809786760464260.340489338023213
490.668585672737770.6628286545244590.331414327262229
500.8449986327422910.3100027345154180.155001367257709
510.940487079343050.1190258413139000.0595129206569498
520.899257568961680.2014848620766410.100742431038320
530.832242402871680.3355151942566390.167757597128319
540.7278542598396940.5442914803206120.272145740160306
550.5710888852590330.8578222294819330.428911114740966


Meta Analysis of Goldfeld-Quandt test for Heteroskedasticity
Description# significant tests% significant testsOK/NOK
1% type I error level220.431372549019608NOK
5% type I error level280.549019607843137NOK
10% type I error level290.568627450980392NOK

\begin{tabular}{lllllllll}
\hline
Meta Analysis of Goldfeld-Quandt test for Heteroskedasticity \tabularnewline
Description & # significant tests & % significant tests & OK/NOK \tabularnewline
1% type I error level & 22 & 0.431372549019608 & NOK \tabularnewline
5% type I error level & 28 & 0.549019607843137 & NOK \tabularnewline
10% type I error level & 29 & 0.568627450980392 & NOK \tabularnewline
\hline
\end{tabular}
%Source: https://freestatistics.org/blog/index.php?pk=67952&T=6

[TABLE]
[ROW][C]Meta Analysis of Goldfeld-Quandt test for Heteroskedasticity[/C][/ROW]
[ROW][C]Description[/C][C]# significant tests[/C][C]% significant tests[/C][C]OK/NOK[/C][/ROW]
[ROW][C]1% type I error level[/C][C]22[/C][C]0.431372549019608[/C][C]NOK[/C][/ROW]
[ROW][C]5% type I error level[/C][C]28[/C][C]0.549019607843137[/C][C]NOK[/C][/ROW]
[ROW][C]10% type I error level[/C][C]29[/C][C]0.568627450980392[/C][C]NOK[/C][/ROW]
[/TABLE]
Source: https://freestatistics.org/blog/index.php?pk=67952&T=6

Globally Unique Identifier (entire table): ba.freestatistics.org/blog/index.php?pk=67952&T=6

As an alternative you can also use a QR Code:  

The GUIDs for individual cells are displayed in the table below:

Meta Analysis of Goldfeld-Quandt test for Heteroskedasticity
Description# significant tests% significant testsOK/NOK
1% type I error level220.431372549019608NOK
5% type I error level280.549019607843137NOK
10% type I error level290.568627450980392NOK


Parameters (Session):
par1 = 1 ; par2 = Do not include Seasonal Dummies ; par3 = No Linear Trend ;
Parameters (R input):
par1 = 1 ; par2 = Do not include Seasonal Dummies ; par3 = No Linear Trend ;
R code (references can be found in the software module):
library(lattice)
library(lmtest)
n25 <- 25 #minimum number of obs. for Goldfeld-Quandt test
par1 <- as.numeric(par1)
x <- t(y)
k <- length(x[1,])
n <- length(x[,1])
x1 <- cbind(x[,par1], x[,1:k!=par1])
mycolnames <- c(colnames(x)[par1], colnames(x)[1:k!=par1])
colnames(x1) <- mycolnames #colnames(x)[par1]
x <- x1
if (par3 == 'First Differences'){
x2 <- array(0, dim=c(n-1,k), dimnames=list(1:(n-1), paste('(1-B)',colnames(x),sep='')))
for (i in 1:n-1) {
for (j in 1:k) {
x2[i,j] <- x[i+1,j] - x[i,j]
}
}
x <- x2
}
if (par2 == 'Include Monthly Dummies'){
x2 <- array(0, dim=c(n,11), dimnames=list(1:n, paste('M', seq(1:11), sep ='')))
for (i in 1:11){
x2[seq(i,n,12),i] <- 1
}
x <- cbind(x, x2)
}
if (par2 == 'Include Quarterly Dummies'){
x2 <- array(0, dim=c(n,3), dimnames=list(1:n, paste('Q', seq(1:3), sep ='')))
for (i in 1:3){
x2[seq(i,n,4),i] <- 1
}
x <- cbind(x, x2)
}
k <- length(x[1,])
if (par3 == 'Linear Trend'){
x <- cbind(x, c(1:n))
colnames(x)[k+1] <- 't'
}
x
k <- length(x[1,])
df <- as.data.frame(x)
(mylm <- lm(df))
(mysum <- summary(mylm))
if (n > n25) {
kp3 <- k + 3
nmkm3 <- n - k - 3
gqarr <- array(NA, dim=c(nmkm3-kp3+1,3))
numgqtests <- 0
numsignificant1 <- 0
numsignificant5 <- 0
numsignificant10 <- 0
for (mypoint in kp3:nmkm3) {
j <- 0
numgqtests <- numgqtests + 1
for (myalt in c('greater', 'two.sided', 'less')) {
j <- j + 1
gqarr[mypoint-kp3+1,j] <- gqtest(mylm, point=mypoint, alternative=myalt)$p.value
}
if (gqarr[mypoint-kp3+1,2] < 0.01) numsignificant1 <- numsignificant1 + 1
if (gqarr[mypoint-kp3+1,2] < 0.05) numsignificant5 <- numsignificant5 + 1
if (gqarr[mypoint-kp3+1,2] < 0.10) numsignificant10 <- numsignificant10 + 1
}
gqarr
}
bitmap(file='test0.png')
plot(x[,1], type='l', main='Actuals and Interpolation', ylab='value of Actuals and Interpolation (dots)', xlab='time or index')
points(x[,1]-mysum$resid)
grid()
dev.off()
bitmap(file='test1.png')
plot(mysum$resid, type='b', pch=19, main='Residuals', ylab='value of Residuals', xlab='time or index')
grid()
dev.off()
bitmap(file='test2.png')
hist(mysum$resid, main='Residual Histogram', xlab='values of Residuals')
grid()
dev.off()
bitmap(file='test3.png')
densityplot(~mysum$resid,col='black',main='Residual Density Plot', xlab='values of Residuals')
dev.off()
bitmap(file='test4.png')
qqnorm(mysum$resid, main='Residual Normal Q-Q Plot')
qqline(mysum$resid)
grid()
dev.off()
(myerror <- as.ts(mysum$resid))
bitmap(file='test5.png')
dum <- cbind(lag(myerror,k=1),myerror)
dum
dum1 <- dum[2:length(myerror),]
dum1
z <- as.data.frame(dum1)
z
plot(z,main=paste('Residual Lag plot, lowess, and regression line'), ylab='values of Residuals', xlab='lagged values of Residuals')
lines(lowess(z))
abline(lm(z))
grid()
dev.off()
bitmap(file='test6.png')
acf(mysum$resid, lag.max=length(mysum$resid)/2, main='Residual Autocorrelation Function')
grid()
dev.off()
bitmap(file='test7.png')
pacf(mysum$resid, lag.max=length(mysum$resid)/2, main='Residual Partial Autocorrelation Function')
grid()
dev.off()
bitmap(file='test8.png')
opar <- par(mfrow = c(2,2), oma = c(0, 0, 1.1, 0))
plot(mylm, las = 1, sub='Residual Diagnostics')
par(opar)
dev.off()
if (n > n25) {
bitmap(file='test9.png')
plot(kp3:nmkm3,gqarr[,2], main='Goldfeld-Quandt test',ylab='2-sided p-value',xlab='breakpoint')
grid()
dev.off()
}
load(file='createtable')
a<-table.start()
a<-table.row.start(a)
a<-table.element(a, 'Multiple Linear Regression - Estimated Regression Equation', 1, TRUE)
a<-table.row.end(a)
myeq <- colnames(x)[1]
myeq <- paste(myeq, '[t] = ', sep='')
for (i in 1:k){
if (mysum$coefficients[i,1] > 0) myeq <- paste(myeq, '+', '')
myeq <- paste(myeq, mysum$coefficients[i,1], sep=' ')
if (rownames(mysum$coefficients)[i] != '(Intercept)') {
myeq <- paste(myeq, rownames(mysum$coefficients)[i], sep='')
if (rownames(mysum$coefficients)[i] != 't') myeq <- paste(myeq, '[t]', sep='')
}
}
myeq <- paste(myeq, ' + e[t]')
a<-table.row.start(a)
a<-table.element(a, myeq)
a<-table.row.end(a)
a<-table.end(a)
table.save(a,file='mytable1.tab')
a<-table.start()
a<-table.row.start(a)
a<-table.element(a,hyperlink('ols1.htm','Multiple Linear Regression - Ordinary Least Squares',''), 6, TRUE)
a<-table.row.end(a)
a<-table.row.start(a)
a<-table.element(a,'Variable',header=TRUE)
a<-table.element(a,'Parameter',header=TRUE)
a<-table.element(a,'S.D.',header=TRUE)
a<-table.element(a,'T-STAT
H0: parameter = 0',header=TRUE)
a<-table.element(a,'2-tail p-value',header=TRUE)
a<-table.element(a,'1-tail p-value',header=TRUE)
a<-table.row.end(a)
for (i in 1:k){
a<-table.row.start(a)
a<-table.element(a,rownames(mysum$coefficients)[i],header=TRUE)
a<-table.element(a,mysum$coefficients[i,1])
a<-table.element(a, round(mysum$coefficients[i,2],6))
a<-table.element(a, round(mysum$coefficients[i,3],4))
a<-table.element(a, round(mysum$coefficients[i,4],6))
a<-table.element(a, round(mysum$coefficients[i,4]/2,6))
a<-table.row.end(a)
}
a<-table.end(a)
table.save(a,file='mytable2.tab')
a<-table.start()
a<-table.row.start(a)
a<-table.element(a, 'Multiple Linear Regression - Regression Statistics', 2, TRUE)
a<-table.row.end(a)
a<-table.row.start(a)
a<-table.element(a, 'Multiple R',1,TRUE)
a<-table.element(a, sqrt(mysum$r.squared))
a<-table.row.end(a)
a<-table.row.start(a)
a<-table.element(a, 'R-squared',1,TRUE)
a<-table.element(a, mysum$r.squared)
a<-table.row.end(a)
a<-table.row.start(a)
a<-table.element(a, 'Adjusted R-squared',1,TRUE)
a<-table.element(a, mysum$adj.r.squared)
a<-table.row.end(a)
a<-table.row.start(a)
a<-table.element(a, 'F-TEST (value)',1,TRUE)
a<-table.element(a, mysum$fstatistic[1])
a<-table.row.end(a)
a<-table.row.start(a)
a<-table.element(a, 'F-TEST (DF numerator)',1,TRUE)
a<-table.element(a, mysum$fstatistic[2])
a<-table.row.end(a)
a<-table.row.start(a)
a<-table.element(a, 'F-TEST (DF denominator)',1,TRUE)
a<-table.element(a, mysum$fstatistic[3])
a<-table.row.end(a)
a<-table.row.start(a)
a<-table.element(a, 'p-value',1,TRUE)
a<-table.element(a, 1-pf(mysum$fstatistic[1],mysum$fstatistic[2],mysum$fstatistic[3]))
a<-table.row.end(a)
a<-table.row.start(a)
a<-table.element(a, 'Multiple Linear Regression - Residual Statistics', 2, TRUE)
a<-table.row.end(a)
a<-table.row.start(a)
a<-table.element(a, 'Residual Standard Deviation',1,TRUE)
a<-table.element(a, mysum$sigma)
a<-table.row.end(a)
a<-table.row.start(a)
a<-table.element(a, 'Sum Squared Residuals',1,TRUE)
a<-table.element(a, sum(myerror*myerror))
a<-table.row.end(a)
a<-table.end(a)
table.save(a,file='mytable3.tab')
a<-table.start()
a<-table.row.start(a)
a<-table.element(a, 'Multiple Linear Regression - Actuals, Interpolation, and Residuals', 4, TRUE)
a<-table.row.end(a)
a<-table.row.start(a)
a<-table.element(a, 'Time or Index', 1, TRUE)
a<-table.element(a, 'Actuals', 1, TRUE)
a<-table.element(a, 'Interpolation
Forecast', 1, TRUE)
a<-table.element(a, 'Residuals
Prediction Error', 1, TRUE)
a<-table.row.end(a)
for (i in 1:n) {
a<-table.row.start(a)
a<-table.element(a,i, 1, TRUE)
a<-table.element(a,x[i])
a<-table.element(a,x[i]-mysum$resid[i])
a<-table.element(a,mysum$resid[i])
a<-table.row.end(a)
}
a<-table.end(a)
table.save(a,file='mytable4.tab')
if (n > n25) {
a<-table.start()
a<-table.row.start(a)
a<-table.element(a,'Goldfeld-Quandt test for Heteroskedasticity',4,TRUE)
a<-table.row.end(a)
a<-table.row.start(a)
a<-table.element(a,'p-values',header=TRUE)
a<-table.element(a,'Alternative Hypothesis',3,header=TRUE)
a<-table.row.end(a)
a<-table.row.start(a)
a<-table.element(a,'breakpoint index',header=TRUE)
a<-table.element(a,'greater',header=TRUE)
a<-table.element(a,'2-sided',header=TRUE)
a<-table.element(a,'less',header=TRUE)
a<-table.row.end(a)
for (mypoint in kp3:nmkm3) {
a<-table.row.start(a)
a<-table.element(a,mypoint,header=TRUE)
a<-table.element(a,gqarr[mypoint-kp3+1,1])
a<-table.element(a,gqarr[mypoint-kp3+1,2])
a<-table.element(a,gqarr[mypoint-kp3+1,3])
a<-table.row.end(a)
}
a<-table.end(a)
table.save(a,file='mytable5.tab')
a<-table.start()
a<-table.row.start(a)
a<-table.element(a,'Meta Analysis of Goldfeld-Quandt test for Heteroskedasticity',4,TRUE)
a<-table.row.end(a)
a<-table.row.start(a)
a<-table.element(a,'Description',header=TRUE)
a<-table.element(a,'# significant tests',header=TRUE)
a<-table.element(a,'% significant tests',header=TRUE)
a<-table.element(a,'OK/NOK',header=TRUE)
a<-table.row.end(a)
a<-table.row.start(a)
a<-table.element(a,'1% type I error level',header=TRUE)
a<-table.element(a,numsignificant1)
a<-table.element(a,numsignificant1/numgqtests)
if (numsignificant1/numgqtests < 0.01) dum <- 'OK' else dum <- 'NOK'
a<-table.element(a,dum)
a<-table.row.end(a)
a<-table.row.start(a)
a<-table.element(a,'5% type I error level',header=TRUE)
a<-table.element(a,numsignificant5)
a<-table.element(a,numsignificant5/numgqtests)
if (numsignificant5/numgqtests < 0.05) dum <- 'OK' else dum <- 'NOK'
a<-table.element(a,dum)
a<-table.row.end(a)
a<-table.row.start(a)
a<-table.element(a,'10% type I error level',header=TRUE)
a<-table.element(a,numsignificant10)
a<-table.element(a,numsignificant10/numgqtests)
if (numsignificant10/numgqtests < 0.1) dum <- 'OK' else dum <- 'NOK'
a<-table.element(a,dum)
a<-table.row.end(a)
a<-table.end(a)
table.save(a,file='mytable6.tab')
}