Free Statistics
of Irreproducible Research!
Description of Statistical Computation | |||||||||||||||||||||||||||||||||||||||||||||||||||||||||||||||||||||||||
|---|---|---|---|---|---|---|---|---|---|---|---|---|---|---|---|---|---|---|---|---|---|---|---|---|---|---|---|---|---|---|---|---|---|---|---|---|---|---|---|---|---|---|---|---|---|---|---|---|---|---|---|---|---|---|---|---|---|---|---|---|---|---|---|---|---|---|---|---|---|---|---|---|---|
| Author's title | |||||||||||||||||||||||||||||||||||||||||||||||||||||||||||||||||||||||||
| Author | *The author of this computation has been verified* | ||||||||||||||||||||||||||||||||||||||||||||||||||||||||||||||||||||||||
| R Software Module | rwasp_pairs.wasp | ||||||||||||||||||||||||||||||||||||||||||||||||||||||||||||||||||||||||
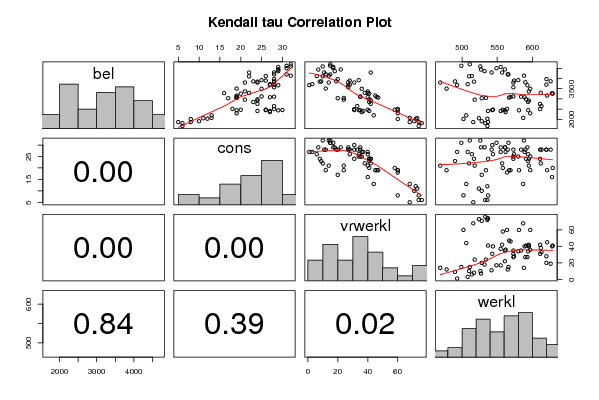
| Title produced by software | Kendall tau Correlation Matrix | ||||||||||||||||||||||||||||||||||||||||||||||||||||||||||||||||||||||||
| Date of computation | Tue, 15 Dec 2009 08:05:03 -0700 | ||||||||||||||||||||||||||||||||||||||||||||||||||||||||||||||||||||||||
| Cite this page as follows | Statistical Computations at FreeStatistics.org, Office for Research Development and Education, URL https://freestatistics.org/blog/index.php?v=date/2009/Dec/15/t12608895360r80wgki44ix05n.htm/, Retrieved Wed, 08 May 2024 22:41:24 +0000 | ||||||||||||||||||||||||||||||||||||||||||||||||||||||||||||||||||||||||
| Statistical Computations at FreeStatistics.org, Office for Research Development and Education, URL https://freestatistics.org/blog/index.php?pk=67960, Retrieved Wed, 08 May 2024 22:41:24 +0000 | |||||||||||||||||||||||||||||||||||||||||||||||||||||||||||||||||||||||||
| QR Codes: | |||||||||||||||||||||||||||||||||||||||||||||||||||||||||||||||||||||||||
|
| |||||||||||||||||||||||||||||||||||||||||||||||||||||||||||||||||||||||||
| Original text written by user: | |||||||||||||||||||||||||||||||||||||||||||||||||||||||||||||||||||||||||
| IsPrivate? | No (this computation is public) | ||||||||||||||||||||||||||||||||||||||||||||||||||||||||||||||||||||||||
| User-defined keywords | |||||||||||||||||||||||||||||||||||||||||||||||||||||||||||||||||||||||||
| Estimated Impact | 165 | ||||||||||||||||||||||||||||||||||||||||||||||||||||||||||||||||||||||||
Tree of Dependent Computations | |||||||||||||||||||||||||||||||||||||||||||||||||||||||||||||||||||||||||
| Family? (F = Feedback message, R = changed R code, M = changed R Module, P = changed Parameters, D = changed Data) | |||||||||||||||||||||||||||||||||||||||||||||||||||||||||||||||||||||||||
| - [Standard Deviation-Mean Plot] [mean plot bel20] [2008-12-10 18:16:19] [74be16979710d4c4e7c6647856088456] - RMPD [Kendall tau Correlation Matrix] [] [2009-12-15 12:54:03] [2f674a53c3d7aaa1bcf80e66074d3c9b] - D [Kendall tau Correlation Matrix] [] [2009-12-15 15:05:03] [5858ea01c9bd81debbf921a11363ad90] [Current] - PD [Kendall tau Correlation Matrix] [paper] [2010-12-24 09:31:35] [960f506a46b790b06fab7ca57984a121] | |||||||||||||||||||||||||||||||||||||||||||||||||||||||||||||||||||||||||
| Feedback Forum | |||||||||||||||||||||||||||||||||||||||||||||||||||||||||||||||||||||||||
Post a new message | |||||||||||||||||||||||||||||||||||||||||||||||||||||||||||||||||||||||||
Dataset | |||||||||||||||||||||||||||||||||||||||||||||||||||||||||||||||||||||||||
| Dataseries X: | |||||||||||||||||||||||||||||||||||||||||||||||||||||||||||||||||||||||||
2350.44 27 36 562 2440.25 29 35 561 2408.64 27 37 555 2472.81 26 40 544 2407.6 24 41 537 2454.62 30 31 543 2448.05 26 34 594 2497.84 28 31 611 2645.64 28 33 613 2756.76 24 42 611 2849.27 23 41 594 2921.44 24 42 595 2981.85 24 41 591 3080.58 27 40 589 3106.22 28 35 584 3119.31 25 35 573 3061.26 19 47 567 3097.31 19 46 569 3161.69 19 45 621 3257.16 20 41 629 3277.01 16 40 628 3295.32 22 38 612 3363.99 21 40 595 3494.17 25 36 597 3667.03 29 27 593 3813.06 28 27 590 3917.96 25 34 580 3895.51 26 28 574 3801.06 24 31 573 3570.12 28 27 573 3701.61 28 28 620 3862.27 28 19 626 3970.1 28 20 620 4138.52 32 14 588 4199.75 31 15 566 4290.89 22 42 557 4443.91 29 22 561 4502.64 31 17 549 4356.98 29 18 532 4591.27 32 10 526 4696.96 32 15 511 4621.4 31 15 499 4562.84 29 17 555 4202.52 28 12 565 4296.49 28 11 542 4435.23 29 7 527 4105.18 22 10 510 4116.68 26 6 514 3844.49 24 8 517 3720.98 27 3 508 3674.4 27 1 493 3857.62 23 9 490 3801.06 21 14 469 3504.37 19 12 478 3032.6 17 20 528 3047.03 19 24 534 2962.34 21 24 518 2197.82 13 44 506 2014.45 8 60 502 1862.83 5 68 516 1905.41 10 71 528 1810.99 6 76 533 1670.07 6 74 536 1864.44 8 74 537 2052.02 11 73 524 2029.6 12 72 536 2070.83 13 68 587 2293.41 19 60 597 2443.27 19 60 581 2513.17 18 60 564 2466.92 20 58 558 | |||||||||||||||||||||||||||||||||||||||||||||||||||||||||||||||||||||||||
Tables (Output of Computation) | |||||||||||||||||||||||||||||||||||||||||||||||||||||||||||||||||||||||||
| |||||||||||||||||||||||||||||||||||||||||||||||||||||||||||||||||||||||||
Figures (Output of Computation) | |||||||||||||||||||||||||||||||||||||||||||||||||||||||||||||||||||||||||
Input Parameters & R Code | |||||||||||||||||||||||||||||||||||||||||||||||||||||||||||||||||||||||||
| Parameters (Session): | |||||||||||||||||||||||||||||||||||||||||||||||||||||||||||||||||||||||||
| Parameters (R input): | |||||||||||||||||||||||||||||||||||||||||||||||||||||||||||||||||||||||||
| R code (references can be found in the software module): | |||||||||||||||||||||||||||||||||||||||||||||||||||||||||||||||||||||||||
panel.tau <- function(x, y, digits=2, prefix='', cex.cor) | |||||||||||||||||||||||||||||||||||||||||||||||||||||||||||||||||||||||||