Free Statistics

of Irreproducible Research!

Author's title

Author*The author of this computation has been verified*
R Software Modulerwasp_smp.wasp
Title produced by softwareStandard Deviation-Mean Plot
Date of computationTue, 15 Dec 2009 11:23:34 -0700
Cite this page as followsStatistical Computations at FreeStatistics.org, Office for Research Development and Education, URL https://freestatistics.org/blog/index.php?v=date/2009/Dec/15/t1260901538p7wlnyhb260m41l.htm/, Retrieved Wed, 08 May 2024 21:00:19 +0000
Statistical Computations at FreeStatistics.org, Office for Research Development and Education, URL https://freestatistics.org/blog/index.php?pk=68067, Retrieved Wed, 08 May 2024 21:00:19 +0000
QR Codes:

Original text written by user:
IsPrivate?No (this computation is public)
User-defined keywordsSDHW, DSHW
Estimated Impact115
Family? (F = Feedback message, R = changed R code, M = changed R Module, P = changed Parameters, D = changed Data)
-     [Bivariate Explorative Data Analysis] [Paper Bivariate E...] [2009-12-13 14:39:24] [143cbdcaf7333bdd9926a1dde50d1082]
- RMPD    [Standard Deviation-Mean Plot] [Paper-SMP-Yt] [2009-12-15 18:23:34] [36295456a56d4c7dcc9b9537ce63463b] [Current]
- R PD      [Standard Deviation-Mean Plot] [Paper-SMP-Xt] [2009-12-16 21:01:03] [143cbdcaf7333bdd9926a1dde50d1082]
Feedback Forum

Post a new message
Dataseries X:
128
502
629.7
595.9
823.7
498.7
766.9
1611.3
329.7
1378.9
1159.4
790.1
-189.6
862.4
426.6
852
834.7
1026.7
1052.8
1280.9
-243.6
976
908.2
416
610.7
728
520.8
905.8
768.9
479.3
1054.2
1411.9
-131
1526.2
1049.5
550.8
168.5
458.2
297
616.3
762.7
693.1
512.7
1169.2
-915.1
1384.2
1368.9
-275.1
-408.9
-37.5
171.5
671.8
-18.5
231.6
747.5
1505.7
-83.6
1173.2
1452.1
777
-52.8
861.2
735.2
1073.6
966.9
1189.8
1093.5
1782.7
-70.4
1471.6
1273.8
900.8
-910.2
299.8
460.2
677.2
937.1
1265.4
1275.6
1582.6
-154.2
1667.7
1083.1
891.7
-26.5
423.4
662.8
711.4
993.3
1133.2
343.9
1415.8
-531.8
1193.6
1201.3
805.6
-164.8


Summary of computational transaction
Raw Inputview raw input (R code)
Raw Outputview raw output of R engine
Computing time1 seconds
R Server'Gwilym Jenkins' @ 72.249.127.135

\begin{tabular}{lllllllll}
\hline
Summary of computational transaction \tabularnewline
Raw Input & view raw input (R code)  \tabularnewline
Raw Output & view raw output of R engine  \tabularnewline
Computing time & 1 seconds \tabularnewline
R Server & 'Gwilym Jenkins' @ 72.249.127.135 \tabularnewline
\hline
\end{tabular}
%Source: https://freestatistics.org/blog/index.php?pk=68067&T=0

[TABLE]
[ROW][C]Summary of computational transaction[/C][/ROW]
[ROW][C]Raw Input[/C][C]view raw input (R code) [/C][/ROW]
[ROW][C]Raw Output[/C][C]view raw output of R engine [/C][/ROW]
[ROW][C]Computing time[/C][C]1 seconds[/C][/ROW]
[ROW][C]R Server[/C][C]'Gwilym Jenkins' @ 72.249.127.135[/C][/ROW]
[/TABLE]
Source: https://freestatistics.org/blog/index.php?pk=68067&T=0

Globally Unique Identifier (entire table): ba.freestatistics.org/blog/index.php?pk=68067&T=0

As an alternative you can also use a QR Code:  

The GUIDs for individual cells are displayed in the table below:

Summary of computational transaction
Raw Inputview raw input (R code)
Raw Outputview raw output of R engine
Computing time1 seconds
R Server'Gwilym Jenkins' @ 72.249.127.135


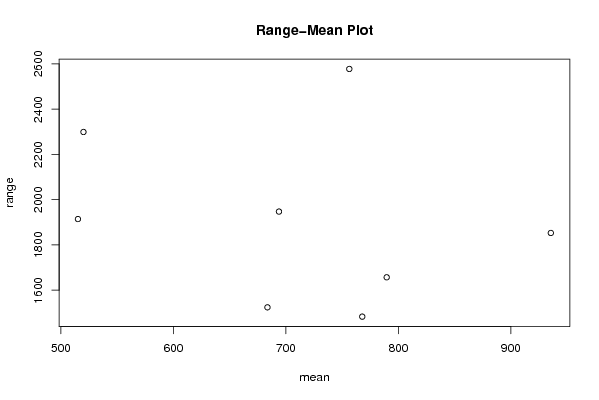
Standard Deviation-Mean Plot
SectionMeanStandard DeviationRange
1767.858333333333430.102546880781483.3
2683.591666666667485.21152923861524.5
3789.591666666667446.2162183970971657.2
4520.05664.4152487166992299.3
5515.158333333333635.3421275306331914.6
6935.491666666667544.7855599113091853.1
7756.333333333333745.2061183242382577.9
8693.833333333333567.4229228127231947.6

\begin{tabular}{lllllllll}
\hline
Standard Deviation-Mean Plot \tabularnewline
Section & Mean & Standard Deviation & Range \tabularnewline
1 & 767.858333333333 & 430.10254688078 & 1483.3 \tabularnewline
2 & 683.591666666667 & 485.2115292386 & 1524.5 \tabularnewline
3 & 789.591666666667 & 446.216218397097 & 1657.2 \tabularnewline
4 & 520.05 & 664.415248716699 & 2299.3 \tabularnewline
5 & 515.158333333333 & 635.342127530633 & 1914.6 \tabularnewline
6 & 935.491666666667 & 544.785559911309 & 1853.1 \tabularnewline
7 & 756.333333333333 & 745.206118324238 & 2577.9 \tabularnewline
8 & 693.833333333333 & 567.422922812723 & 1947.6 \tabularnewline
\hline
\end{tabular}
%Source: https://freestatistics.org/blog/index.php?pk=68067&T=1

[TABLE]
[ROW][C]Standard Deviation-Mean Plot[/C][/ROW]
[ROW][C]Section[/C][C]Mean[/C][C]Standard Deviation[/C][C]Range[/C][/ROW]
[ROW][C]1[/C][C]767.858333333333[/C][C]430.10254688078[/C][C]1483.3[/C][/ROW]
[ROW][C]2[/C][C]683.591666666667[/C][C]485.2115292386[/C][C]1524.5[/C][/ROW]
[ROW][C]3[/C][C]789.591666666667[/C][C]446.216218397097[/C][C]1657.2[/C][/ROW]
[ROW][C]4[/C][C]520.05[/C][C]664.415248716699[/C][C]2299.3[/C][/ROW]
[ROW][C]5[/C][C]515.158333333333[/C][C]635.342127530633[/C][C]1914.6[/C][/ROW]
[ROW][C]6[/C][C]935.491666666667[/C][C]544.785559911309[/C][C]1853.1[/C][/ROW]
[ROW][C]7[/C][C]756.333333333333[/C][C]745.206118324238[/C][C]2577.9[/C][/ROW]
[ROW][C]8[/C][C]693.833333333333[/C][C]567.422922812723[/C][C]1947.6[/C][/ROW]
[/TABLE]
Source: https://freestatistics.org/blog/index.php?pk=68067&T=1

Globally Unique Identifier (entire table): ba.freestatistics.org/blog/index.php?pk=68067&T=1

As an alternative you can also use a QR Code:  

The GUIDs for individual cells are displayed in the table below:

Standard Deviation-Mean Plot
SectionMeanStandard DeviationRange
1767.858333333333430.102546880781483.3
2683.591666666667485.21152923861524.5
3789.591666666667446.2162183970971657.2
4520.05664.4152487166992299.3
5515.158333333333635.3421275306331914.6
6935.491666666667544.7855599113091853.1
7756.333333333333745.2061183242382577.9
8693.833333333333567.4229228127231947.6


Regression: S.E.(k) = alpha + beta * Mean(k)
alpha791.047793361936
beta-0.319623697266394
S.D.0.295951748714603
T-STAT-1.07998583774080
p-value0.321636624651754

\begin{tabular}{lllllllll}
\hline
Regression: S.E.(k) = alpha + beta * Mean(k) \tabularnewline
alpha & 791.047793361936 \tabularnewline
beta & -0.319623697266394 \tabularnewline
S.D. & 0.295951748714603 \tabularnewline
T-STAT & -1.07998583774080 \tabularnewline
p-value & 0.321636624651754 \tabularnewline
\hline
\end{tabular}
%Source: https://freestatistics.org/blog/index.php?pk=68067&T=2

[TABLE]
[ROW][C]Regression: S.E.(k) = alpha + beta * Mean(k)[/C][/ROW]
[ROW][C]alpha[/C][C]791.047793361936[/C][/ROW]
[ROW][C]beta[/C][C]-0.319623697266394[/C][/ROW]
[ROW][C]S.D.[/C][C]0.295951748714603[/C][/ROW]
[ROW][C]T-STAT[/C][C]-1.07998583774080[/C][/ROW]
[ROW][C]p-value[/C][C]0.321636624651754[/C][/ROW]
[/TABLE]
Source: https://freestatistics.org/blog/index.php?pk=68067&T=2

Globally Unique Identifier (entire table): ba.freestatistics.org/blog/index.php?pk=68067&T=2

As an alternative you can also use a QR Code:  

The GUIDs for individual cells are displayed in the table below:

Regression: S.E.(k) = alpha + beta * Mean(k)
alpha791.047793361936
beta-0.319623697266394
S.D.0.295951748714603
T-STAT-1.07998583774080
p-value0.321636624651754


Regression: ln S.E.(k) = alpha + beta * ln Mean(k)
alpha9.0711245197402
beta-0.420443809812484
S.D.0.349485579950383
T-STAT-1.20303621646471
p-value0.274274369714348
Lambda1.42044380981248

\begin{tabular}{lllllllll}
\hline
Regression: ln S.E.(k) = alpha + beta * ln Mean(k) \tabularnewline
alpha & 9.0711245197402 \tabularnewline
beta & -0.420443809812484 \tabularnewline
S.D. & 0.349485579950383 \tabularnewline
T-STAT & -1.20303621646471 \tabularnewline
p-value & 0.274274369714348 \tabularnewline
Lambda & 1.42044380981248 \tabularnewline
\hline
\end{tabular}
%Source: https://freestatistics.org/blog/index.php?pk=68067&T=3

[TABLE]
[ROW][C]Regression: ln S.E.(k) = alpha + beta * ln Mean(k)[/C][/ROW]
[ROW][C]alpha[/C][C]9.0711245197402[/C][/ROW]
[ROW][C]beta[/C][C]-0.420443809812484[/C][/ROW]
[ROW][C]S.D.[/C][C]0.349485579950383[/C][/ROW]
[ROW][C]T-STAT[/C][C]-1.20303621646471[/C][/ROW]
[ROW][C]p-value[/C][C]0.274274369714348[/C][/ROW]
[ROW][C]Lambda[/C][C]1.42044380981248[/C][/ROW]
[/TABLE]
Source: https://freestatistics.org/blog/index.php?pk=68067&T=3

Globally Unique Identifier (entire table): ba.freestatistics.org/blog/index.php?pk=68067&T=3

As an alternative you can also use a QR Code:  

The GUIDs for individual cells are displayed in the table below:

Regression: ln S.E.(k) = alpha + beta * ln Mean(k)
alpha9.0711245197402
beta-0.420443809812484
S.D.0.349485579950383
T-STAT-1.20303621646471
p-value0.274274369714348
Lambda1.42044380981248


Parameters (Session):
par1 = 1 ; par2 = 1 ; par3 = 1 ; par4 = 12 ;
Parameters (R input):
par1 = 12 ;
R code (references can be found in the software module):
par1 <- as.numeric(par1)
(n <- length(x))
(np <- floor(n / par1))
arr <- array(NA,dim=c(par1,np))
j <- 0
k <- 1
for (i in 1:(np*par1))
{
j = j + 1
arr[j,k] <- x[i]
if (j == par1) {
j = 0
k=k+1
}
}
arr
arr.mean <- array(NA,dim=np)
arr.sd <- array(NA,dim=np)
arr.range <- array(NA,dim=np)
for (j in 1:np)
{
arr.mean[j] <- mean(arr[,j],na.rm=TRUE)
arr.sd[j] <- sd(arr[,j],na.rm=TRUE)
arr.range[j] <- max(arr[,j],na.rm=TRUE) - min(arr[,j],na.rm=TRUE)
}
arr.mean
arr.sd
arr.range
(lm1 <- lm(arr.sd~arr.mean))
(lnlm1 <- lm(log(arr.sd)~log(arr.mean)))
(lm2 <- lm(arr.range~arr.mean))
bitmap(file='test1.png')
plot(arr.mean,arr.sd,main='Standard Deviation-Mean Plot',xlab='mean',ylab='standard deviation')
dev.off()
bitmap(file='test2.png')
plot(arr.mean,arr.range,main='Range-Mean Plot',xlab='mean',ylab='range')
dev.off()
load(file='createtable')
a<-table.start()
a<-table.row.start(a)
a<-table.element(a,'Standard Deviation-Mean Plot',4,TRUE)
a<-table.row.end(a)
a<-table.row.start(a)
a<-table.element(a,'Section',header=TRUE)
a<-table.element(a,'Mean',header=TRUE)
a<-table.element(a,'Standard Deviation',header=TRUE)
a<-table.element(a,'Range',header=TRUE)
a<-table.row.end(a)
for (j in 1:np) {
a<-table.row.start(a)
a<-table.element(a,j,header=TRUE)
a<-table.element(a,arr.mean[j])
a<-table.element(a,arr.sd[j] )
a<-table.element(a,arr.range[j] )
a<-table.row.end(a)
}
a<-table.end(a)
table.save(a,file='mytable.tab')
a<-table.start()
a<-table.row.start(a)
a<-table.element(a,'Regression: S.E.(k) = alpha + beta * Mean(k)',2,TRUE)
a<-table.row.end(a)
a<-table.row.start(a)
a<-table.element(a,'alpha',header=TRUE)
a<-table.element(a,lm1$coefficients[[1]])
a<-table.row.end(a)
a<-table.row.start(a)
a<-table.element(a,'beta',header=TRUE)
a<-table.element(a,lm1$coefficients[[2]])
a<-table.row.end(a)
a<-table.row.start(a)
a<-table.element(a,'S.D.',header=TRUE)
a<-table.element(a,summary(lm1)$coefficients[2,2])
a<-table.row.end(a)
a<-table.row.start(a)
a<-table.element(a,'T-STAT',header=TRUE)
a<-table.element(a,summary(lm1)$coefficients[2,3])
a<-table.row.end(a)
a<-table.row.start(a)
a<-table.element(a,'p-value',header=TRUE)
a<-table.element(a,summary(lm1)$coefficients[2,4])
a<-table.row.end(a)
a<-table.end(a)
table.save(a,file='mytable1.tab')
a<-table.start()
a<-table.row.start(a)
a<-table.element(a,'Regression: ln S.E.(k) = alpha + beta * ln Mean(k)',2,TRUE)
a<-table.row.end(a)
a<-table.row.start(a)
a<-table.element(a,'alpha',header=TRUE)
a<-table.element(a,lnlm1$coefficients[[1]])
a<-table.row.end(a)
a<-table.row.start(a)
a<-table.element(a,'beta',header=TRUE)
a<-table.element(a,lnlm1$coefficients[[2]])
a<-table.row.end(a)
a<-table.row.start(a)
a<-table.element(a,'S.D.',header=TRUE)
a<-table.element(a,summary(lnlm1)$coefficients[2,2])
a<-table.row.end(a)
a<-table.row.start(a)
a<-table.element(a,'T-STAT',header=TRUE)
a<-table.element(a,summary(lnlm1)$coefficients[2,3])
a<-table.row.end(a)
a<-table.row.start(a)
a<-table.element(a,'p-value',header=TRUE)
a<-table.element(a,summary(lnlm1)$coefficients[2,4])
a<-table.row.end(a)
a<-table.row.start(a)
a<-table.element(a,'Lambda',header=TRUE)
a<-table.element(a,1-lnlm1$coefficients[[2]])
a<-table.row.end(a)
a<-table.end(a)
table.save(a,file='mytable2.tab')