Free Statistics

of Irreproducible Research!

Author's title

Author*The author of this computation has been verified*
R Software Modulerwasp_arimabackwardselection.wasp
Title produced by softwareARIMA Backward Selection
Date of computationTue, 15 Dec 2009 14:25:55 -0700
Cite this page as followsStatistical Computations at FreeStatistics.org, Office for Research Development and Education, URL https://freestatistics.org/blog/index.php?v=date/2009/Dec/15/t1260912402lqunkb8msln62i1.htm/, Retrieved Wed, 08 May 2024 23:14:04 +0000
Statistical Computations at FreeStatistics.org, Office for Research Development and Education, URL https://freestatistics.org/blog/index.php?pk=68179, Retrieved Wed, 08 May 2024 23:14:04 +0000
QR Codes:

Original text written by user:
IsPrivate?No (this computation is public)
User-defined keywords
Estimated Impact132
Family? (F = Feedback message, R = changed R code, M = changed R Module, P = changed Parameters, D = changed Data)
-     [Univariate Data Series] [data set] [2008-12-01 19:54:57] [b98453cac15ba1066b407e146608df68]
- RMP   [ARIMA Backward Selection] [] [2009-11-27 14:53:14] [b98453cac15ba1066b407e146608df68]
F   PD    [ARIMA Backward Selection] [fout] [2009-12-04 11:22:29] [b8b64ced21f32e31669b267b64eede7f]
- R P         [ARIMA Backward Selection] [ws 9] [2009-12-15 21:25:55] [e339dd08bcbfc073ac7494f09a949034] [Current]
Feedback Forum

Post a new message
Dataseries X:
3922
3759
4138
4634
3995
4308
4143
4429
5219
4929
5755
5592
4163
4962
5208
4755
4491
5732
5731
5040
6102
4904
5369
5578
4619
4731
5011
5299
4146
4625
4736
4219
5116
4205
4121
5103
4300
4578
3809
5526
4247
3830
4394
4826
4409
4569
4106
4794
3914
3793
4405
4022
4100
4788
3163
3585
3903
4178
3863
4187


Summary of computational transaction
Raw Inputview raw input (R code)
Raw Outputview raw output of R engine
Computing time15 seconds
R Server'Gwilym Jenkins' @ 72.249.127.135

\begin{tabular}{lllllllll}
\hline
Summary of computational transaction \tabularnewline
Raw Input & view raw input (R code)  \tabularnewline
Raw Output & view raw output of R engine  \tabularnewline
Computing time & 15 seconds \tabularnewline
R Server & 'Gwilym Jenkins' @ 72.249.127.135 \tabularnewline
\hline
\end{tabular}
%Source: https://freestatistics.org/blog/index.php?pk=68179&T=0

[TABLE]
[ROW][C]Summary of computational transaction[/C][/ROW]
[ROW][C]Raw Input[/C][C]view raw input (R code) [/C][/ROW]
[ROW][C]Raw Output[/C][C]view raw output of R engine [/C][/ROW]
[ROW][C]Computing time[/C][C]15 seconds[/C][/ROW]
[ROW][C]R Server[/C][C]'Gwilym Jenkins' @ 72.249.127.135[/C][/ROW]
[/TABLE]
Source: https://freestatistics.org/blog/index.php?pk=68179&T=0

Globally Unique Identifier (entire table): ba.freestatistics.org/blog/index.php?pk=68179&T=0

As an alternative you can also use a QR Code:  

The GUIDs for individual cells are displayed in the table below:

Summary of computational transaction
Raw Inputview raw input (R code)
Raw Outputview raw output of R engine
Computing time15 seconds
R Server'Gwilym Jenkins' @ 72.249.127.135


ARIMA Parameter Estimation and Backward Selection
Iterationar1ar2ar3ma1sar1sar2sma1
Estimates ( 1 )-0.7267-0.5316-0.1538-0.9937-0.0452-0.3817-0.6479
(p-val)(0 )(0.0028 )(0.3164 )(0 )(0.8792 )(0.0892 )(0.2222 )
Estimates ( 2 )-0.7275-0.536-0.1539-1.00630-0.3676-1.3777
(p-val)(0 )(0.0021 )(0.3157 )(0 )(NA )(0.0814 )(0.1372 )
Estimates ( 3 )-0.6544-0.43190-1.00460-0.417-1.4872
(p-val)(0 )(0.0023 )(NA )(0 )(NA )(0.0357 )(0.146 )
Estimates ( 4 )-0.6243-0.46930-1.00310-0.38360
(p-val)(0 )(8e-04 )(NA )(0 )(NA )(0.0503 )(NA )
Estimates ( 5 )-0.6237-0.52790-1.0026000
(p-val)(0 )(1e-04 )(NA )(0 )(NA )(NA )(NA )
Estimates ( 6 )NANANANANANANA
(p-val)(NA )(NA )(NA )(NA )(NA )(NA )(NA )
Estimates ( 7 )NANANANANANANA
(p-val)(NA )(NA )(NA )(NA )(NA )(NA )(NA )
Estimates ( 8 )NANANANANANANA
(p-val)(NA )(NA )(NA )(NA )(NA )(NA )(NA )
Estimates ( 9 )NANANANANANANA
(p-val)(NA )(NA )(NA )(NA )(NA )(NA )(NA )
Estimates ( 10 )NANANANANANANA
(p-val)(NA )(NA )(NA )(NA )(NA )(NA )(NA )
Estimates ( 11 )NANANANANANANA
(p-val)(NA )(NA )(NA )(NA )(NA )(NA )(NA )
Estimates ( 12 )NANANANANANANA
(p-val)(NA )(NA )(NA )(NA )(NA )(NA )(NA )
Estimates ( 13 )NANANANANANANA
(p-val)(NA )(NA )(NA )(NA )(NA )(NA )(NA )

\begin{tabular}{lllllllll}
\hline
ARIMA Parameter Estimation and Backward Selection \tabularnewline
Iteration & ar1 & ar2 & ar3 & ma1 & sar1 & sar2 & sma1 \tabularnewline
Estimates ( 1 ) & -0.7267 & -0.5316 & -0.1538 & -0.9937 & -0.0452 & -0.3817 & -0.6479 \tabularnewline
(p-val) & (0 ) & (0.0028 ) & (0.3164 ) & (0 ) & (0.8792 ) & (0.0892 ) & (0.2222 ) \tabularnewline
Estimates ( 2 ) & -0.7275 & -0.536 & -0.1539 & -1.0063 & 0 & -0.3676 & -1.3777 \tabularnewline
(p-val) & (0 ) & (0.0021 ) & (0.3157 ) & (0 ) & (NA ) & (0.0814 ) & (0.1372 ) \tabularnewline
Estimates ( 3 ) & -0.6544 & -0.4319 & 0 & -1.0046 & 0 & -0.417 & -1.4872 \tabularnewline
(p-val) & (0 ) & (0.0023 ) & (NA ) & (0 ) & (NA ) & (0.0357 ) & (0.146 ) \tabularnewline
Estimates ( 4 ) & -0.6243 & -0.4693 & 0 & -1.0031 & 0 & -0.3836 & 0 \tabularnewline
(p-val) & (0 ) & (8e-04 ) & (NA ) & (0 ) & (NA ) & (0.0503 ) & (NA ) \tabularnewline
Estimates ( 5 ) & -0.6237 & -0.5279 & 0 & -1.0026 & 0 & 0 & 0 \tabularnewline
(p-val) & (0 ) & (1e-04 ) & (NA ) & (0 ) & (NA ) & (NA ) & (NA ) \tabularnewline
Estimates ( 6 ) & NA & NA & NA & NA & NA & NA & NA \tabularnewline
(p-val) & (NA ) & (NA ) & (NA ) & (NA ) & (NA ) & (NA ) & (NA ) \tabularnewline
Estimates ( 7 ) & NA & NA & NA & NA & NA & NA & NA \tabularnewline
(p-val) & (NA ) & (NA ) & (NA ) & (NA ) & (NA ) & (NA ) & (NA ) \tabularnewline
Estimates ( 8 ) & NA & NA & NA & NA & NA & NA & NA \tabularnewline
(p-val) & (NA ) & (NA ) & (NA ) & (NA ) & (NA ) & (NA ) & (NA ) \tabularnewline
Estimates ( 9 ) & NA & NA & NA & NA & NA & NA & NA \tabularnewline
(p-val) & (NA ) & (NA ) & (NA ) & (NA ) & (NA ) & (NA ) & (NA ) \tabularnewline
Estimates ( 10 ) & NA & NA & NA & NA & NA & NA & NA \tabularnewline
(p-val) & (NA ) & (NA ) & (NA ) & (NA ) & (NA ) & (NA ) & (NA ) \tabularnewline
Estimates ( 11 ) & NA & NA & NA & NA & NA & NA & NA \tabularnewline
(p-val) & (NA ) & (NA ) & (NA ) & (NA ) & (NA ) & (NA ) & (NA ) \tabularnewline
Estimates ( 12 ) & NA & NA & NA & NA & NA & NA & NA \tabularnewline
(p-val) & (NA ) & (NA ) & (NA ) & (NA ) & (NA ) & (NA ) & (NA ) \tabularnewline
Estimates ( 13 ) & NA & NA & NA & NA & NA & NA & NA \tabularnewline
(p-val) & (NA ) & (NA ) & (NA ) & (NA ) & (NA ) & (NA ) & (NA ) \tabularnewline
\hline
\end{tabular}
%Source: https://freestatistics.org/blog/index.php?pk=68179&T=1

[TABLE]
[ROW][C]ARIMA Parameter Estimation and Backward Selection[/C][/ROW]
[ROW][C]Iteration[/C][C]ar1[/C][C]ar2[/C][C]ar3[/C][C]ma1[/C][C]sar1[/C][C]sar2[/C][C]sma1[/C][/ROW]
[ROW][C]Estimates ( 1 )[/C][C]-0.7267[/C][C]-0.5316[/C][C]-0.1538[/C][C]-0.9937[/C][C]-0.0452[/C][C]-0.3817[/C][C]-0.6479[/C][/ROW]
[ROW][C](p-val)[/C][C](0 )[/C][C](0.0028 )[/C][C](0.3164 )[/C][C](0 )[/C][C](0.8792 )[/C][C](0.0892 )[/C][C](0.2222 )[/C][/ROW]
[ROW][C]Estimates ( 2 )[/C][C]-0.7275[/C][C]-0.536[/C][C]-0.1539[/C][C]-1.0063[/C][C]0[/C][C]-0.3676[/C][C]-1.3777[/C][/ROW]
[ROW][C](p-val)[/C][C](0 )[/C][C](0.0021 )[/C][C](0.3157 )[/C][C](0 )[/C][C](NA )[/C][C](0.0814 )[/C][C](0.1372 )[/C][/ROW]
[ROW][C]Estimates ( 3 )[/C][C]-0.6544[/C][C]-0.4319[/C][C]0[/C][C]-1.0046[/C][C]0[/C][C]-0.417[/C][C]-1.4872[/C][/ROW]
[ROW][C](p-val)[/C][C](0 )[/C][C](0.0023 )[/C][C](NA )[/C][C](0 )[/C][C](NA )[/C][C](0.0357 )[/C][C](0.146 )[/C][/ROW]
[ROW][C]Estimates ( 4 )[/C][C]-0.6243[/C][C]-0.4693[/C][C]0[/C][C]-1.0031[/C][C]0[/C][C]-0.3836[/C][C]0[/C][/ROW]
[ROW][C](p-val)[/C][C](0 )[/C][C](8e-04 )[/C][C](NA )[/C][C](0 )[/C][C](NA )[/C][C](0.0503 )[/C][C](NA )[/C][/ROW]
[ROW][C]Estimates ( 5 )[/C][C]-0.6237[/C][C]-0.5279[/C][C]0[/C][C]-1.0026[/C][C]0[/C][C]0[/C][C]0[/C][/ROW]
[ROW][C](p-val)[/C][C](0 )[/C][C](1e-04 )[/C][C](NA )[/C][C](0 )[/C][C](NA )[/C][C](NA )[/C][C](NA )[/C][/ROW]
[ROW][C]Estimates ( 6 )[/C][C]NA[/C][C]NA[/C][C]NA[/C][C]NA[/C][C]NA[/C][C]NA[/C][C]NA[/C][/ROW]
[ROW][C](p-val)[/C][C](NA )[/C][C](NA )[/C][C](NA )[/C][C](NA )[/C][C](NA )[/C][C](NA )[/C][C](NA )[/C][/ROW]
[ROW][C]Estimates ( 7 )[/C][C]NA[/C][C]NA[/C][C]NA[/C][C]NA[/C][C]NA[/C][C]NA[/C][C]NA[/C][/ROW]
[ROW][C](p-val)[/C][C](NA )[/C][C](NA )[/C][C](NA )[/C][C](NA )[/C][C](NA )[/C][C](NA )[/C][C](NA )[/C][/ROW]
[ROW][C]Estimates ( 8 )[/C][C]NA[/C][C]NA[/C][C]NA[/C][C]NA[/C][C]NA[/C][C]NA[/C][C]NA[/C][/ROW]
[ROW][C](p-val)[/C][C](NA )[/C][C](NA )[/C][C](NA )[/C][C](NA )[/C][C](NA )[/C][C](NA )[/C][C](NA )[/C][/ROW]
[ROW][C]Estimates ( 9 )[/C][C]NA[/C][C]NA[/C][C]NA[/C][C]NA[/C][C]NA[/C][C]NA[/C][C]NA[/C][/ROW]
[ROW][C](p-val)[/C][C](NA )[/C][C](NA )[/C][C](NA )[/C][C](NA )[/C][C](NA )[/C][C](NA )[/C][C](NA )[/C][/ROW]
[ROW][C]Estimates ( 10 )[/C][C]NA[/C][C]NA[/C][C]NA[/C][C]NA[/C][C]NA[/C][C]NA[/C][C]NA[/C][/ROW]
[ROW][C](p-val)[/C][C](NA )[/C][C](NA )[/C][C](NA )[/C][C](NA )[/C][C](NA )[/C][C](NA )[/C][C](NA )[/C][/ROW]
[ROW][C]Estimates ( 11 )[/C][C]NA[/C][C]NA[/C][C]NA[/C][C]NA[/C][C]NA[/C][C]NA[/C][C]NA[/C][/ROW]
[ROW][C](p-val)[/C][C](NA )[/C][C](NA )[/C][C](NA )[/C][C](NA )[/C][C](NA )[/C][C](NA )[/C][C](NA )[/C][/ROW]
[ROW][C]Estimates ( 12 )[/C][C]NA[/C][C]NA[/C][C]NA[/C][C]NA[/C][C]NA[/C][C]NA[/C][C]NA[/C][/ROW]
[ROW][C](p-val)[/C][C](NA )[/C][C](NA )[/C][C](NA )[/C][C](NA )[/C][C](NA )[/C][C](NA )[/C][C](NA )[/C][/ROW]
[ROW][C]Estimates ( 13 )[/C][C]NA[/C][C]NA[/C][C]NA[/C][C]NA[/C][C]NA[/C][C]NA[/C][C]NA[/C][/ROW]
[ROW][C](p-val)[/C][C](NA )[/C][C](NA )[/C][C](NA )[/C][C](NA )[/C][C](NA )[/C][C](NA )[/C][C](NA )[/C][/ROW]
[/TABLE]
Source: https://freestatistics.org/blog/index.php?pk=68179&T=1

Globally Unique Identifier (entire table): ba.freestatistics.org/blog/index.php?pk=68179&T=1

As an alternative you can also use a QR Code:  

The GUIDs for individual cells are displayed in the table below:

ARIMA Parameter Estimation and Backward Selection
Iterationar1ar2ar3ma1sar1sar2sma1
Estimates ( 1 )-0.7267-0.5316-0.1538-0.9937-0.0452-0.3817-0.6479
(p-val)(0 )(0.0028 )(0.3164 )(0 )(0.8792 )(0.0892 )(0.2222 )
Estimates ( 2 )-0.7275-0.536-0.1539-1.00630-0.3676-1.3777
(p-val)(0 )(0.0021 )(0.3157 )(0 )(NA )(0.0814 )(0.1372 )
Estimates ( 3 )-0.6544-0.43190-1.00460-0.417-1.4872
(p-val)(0 )(0.0023 )(NA )(0 )(NA )(0.0357 )(0.146 )
Estimates ( 4 )-0.6243-0.46930-1.00310-0.38360
(p-val)(0 )(8e-04 )(NA )(0 )(NA )(0.0503 )(NA )
Estimates ( 5 )-0.6237-0.52790-1.0026000
(p-val)(0 )(1e-04 )(NA )(0 )(NA )(NA )(NA )
Estimates ( 6 )NANANANANANANA
(p-val)(NA )(NA )(NA )(NA )(NA )(NA )(NA )
Estimates ( 7 )NANANANANANANA
(p-val)(NA )(NA )(NA )(NA )(NA )(NA )(NA )
Estimates ( 8 )NANANANANANANA
(p-val)(NA )(NA )(NA )(NA )(NA )(NA )(NA )
Estimates ( 9 )NANANANANANANA
(p-val)(NA )(NA )(NA )(NA )(NA )(NA )(NA )
Estimates ( 10 )NANANANANANANA
(p-val)(NA )(NA )(NA )(NA )(NA )(NA )(NA )
Estimates ( 11 )NANANANANANANA
(p-val)(NA )(NA )(NA )(NA )(NA )(NA )(NA )
Estimates ( 12 )NANANANANANANA
(p-val)(NA )(NA )(NA )(NA )(NA )(NA )(NA )
Estimates ( 13 )NANANANANANANA
(p-val)(NA )(NA )(NA )(NA )(NA )(NA )(NA )


Estimated ARIMA Residuals
Value
46.054701462841
-476.673805740804
-774.230484721225
-133.187015964188
689.522109480573
679.073902643794
-590.995437718659
-341.161581023398
-1095.45151498681
-613.526372694571
-92.5017761592052
628.791838232114
-86.9337835008015
-44.4623341455752
501.423239628426
-278.271380346535
-769.213804035159
-565.833696848101
107.267554450118
170.950854748979
352.288148075727
-178.413112723739
684.197706907255
304.439683384247
895.625804292449
-670.89315232291
757.778942266257
253.741848977733
46.8401889287379
252.373624794098
677.026001772899
-576.704995541029
277.144725371682
-584.310379589966
-69.148687685336
-162.068383895450
-579.036222415203
1104.83005850628
-1175.89125123945
626.070612670209
658.749071302326
-1087.46710911575
-792.86996881003
-174.787443141474
784.327067594848
485.708086575143
83.0510302762539

\begin{tabular}{lllllllll}
\hline
Estimated ARIMA Residuals \tabularnewline
Value \tabularnewline
46.054701462841 \tabularnewline
-476.673805740804 \tabularnewline
-774.230484721225 \tabularnewline
-133.187015964188 \tabularnewline
689.522109480573 \tabularnewline
679.073902643794 \tabularnewline
-590.995437718659 \tabularnewline
-341.161581023398 \tabularnewline
-1095.45151498681 \tabularnewline
-613.526372694571 \tabularnewline
-92.5017761592052 \tabularnewline
628.791838232114 \tabularnewline
-86.9337835008015 \tabularnewline
-44.4623341455752 \tabularnewline
501.423239628426 \tabularnewline
-278.271380346535 \tabularnewline
-769.213804035159 \tabularnewline
-565.833696848101 \tabularnewline
107.267554450118 \tabularnewline
170.950854748979 \tabularnewline
352.288148075727 \tabularnewline
-178.413112723739 \tabularnewline
684.197706907255 \tabularnewline
304.439683384247 \tabularnewline
895.625804292449 \tabularnewline
-670.89315232291 \tabularnewline
757.778942266257 \tabularnewline
253.741848977733 \tabularnewline
46.8401889287379 \tabularnewline
252.373624794098 \tabularnewline
677.026001772899 \tabularnewline
-576.704995541029 \tabularnewline
277.144725371682 \tabularnewline
-584.310379589966 \tabularnewline
-69.148687685336 \tabularnewline
-162.068383895450 \tabularnewline
-579.036222415203 \tabularnewline
1104.83005850628 \tabularnewline
-1175.89125123945 \tabularnewline
626.070612670209 \tabularnewline
658.749071302326 \tabularnewline
-1087.46710911575 \tabularnewline
-792.86996881003 \tabularnewline
-174.787443141474 \tabularnewline
784.327067594848 \tabularnewline
485.708086575143 \tabularnewline
83.0510302762539 \tabularnewline
\hline
\end{tabular}
%Source: https://freestatistics.org/blog/index.php?pk=68179&T=2

[TABLE]
[ROW][C]Estimated ARIMA Residuals[/C][/ROW]
[ROW][C]Value[/C][/ROW]
[ROW][C]46.054701462841[/C][/ROW]
[ROW][C]-476.673805740804[/C][/ROW]
[ROW][C]-774.230484721225[/C][/ROW]
[ROW][C]-133.187015964188[/C][/ROW]
[ROW][C]689.522109480573[/C][/ROW]
[ROW][C]679.073902643794[/C][/ROW]
[ROW][C]-590.995437718659[/C][/ROW]
[ROW][C]-341.161581023398[/C][/ROW]
[ROW][C]-1095.45151498681[/C][/ROW]
[ROW][C]-613.526372694571[/C][/ROW]
[ROW][C]-92.5017761592052[/C][/ROW]
[ROW][C]628.791838232114[/C][/ROW]
[ROW][C]-86.9337835008015[/C][/ROW]
[ROW][C]-44.4623341455752[/C][/ROW]
[ROW][C]501.423239628426[/C][/ROW]
[ROW][C]-278.271380346535[/C][/ROW]
[ROW][C]-769.213804035159[/C][/ROW]
[ROW][C]-565.833696848101[/C][/ROW]
[ROW][C]107.267554450118[/C][/ROW]
[ROW][C]170.950854748979[/C][/ROW]
[ROW][C]352.288148075727[/C][/ROW]
[ROW][C]-178.413112723739[/C][/ROW]
[ROW][C]684.197706907255[/C][/ROW]
[ROW][C]304.439683384247[/C][/ROW]
[ROW][C]895.625804292449[/C][/ROW]
[ROW][C]-670.89315232291[/C][/ROW]
[ROW][C]757.778942266257[/C][/ROW]
[ROW][C]253.741848977733[/C][/ROW]
[ROW][C]46.8401889287379[/C][/ROW]
[ROW][C]252.373624794098[/C][/ROW]
[ROW][C]677.026001772899[/C][/ROW]
[ROW][C]-576.704995541029[/C][/ROW]
[ROW][C]277.144725371682[/C][/ROW]
[ROW][C]-584.310379589966[/C][/ROW]
[ROW][C]-69.148687685336[/C][/ROW]
[ROW][C]-162.068383895450[/C][/ROW]
[ROW][C]-579.036222415203[/C][/ROW]
[ROW][C]1104.83005850628[/C][/ROW]
[ROW][C]-1175.89125123945[/C][/ROW]
[ROW][C]626.070612670209[/C][/ROW]
[ROW][C]658.749071302326[/C][/ROW]
[ROW][C]-1087.46710911575[/C][/ROW]
[ROW][C]-792.86996881003[/C][/ROW]
[ROW][C]-174.787443141474[/C][/ROW]
[ROW][C]784.327067594848[/C][/ROW]
[ROW][C]485.708086575143[/C][/ROW]
[ROW][C]83.0510302762539[/C][/ROW]
[/TABLE]
Source: https://freestatistics.org/blog/index.php?pk=68179&T=2

Globally Unique Identifier (entire table): ba.freestatistics.org/blog/index.php?pk=68179&T=2

As an alternative you can also use a QR Code:  

The GUIDs for individual cells are displayed in the table below:

Estimated ARIMA Residuals
Value
46.054701462841
-476.673805740804
-774.230484721225
-133.187015964188
689.522109480573
679.073902643794
-590.995437718659
-341.161581023398
-1095.45151498681
-613.526372694571
-92.5017761592052
628.791838232114
-86.9337835008015
-44.4623341455752
501.423239628426
-278.271380346535
-769.213804035159
-565.833696848101
107.267554450118
170.950854748979
352.288148075727
-178.413112723739
684.197706907255
304.439683384247
895.625804292449
-670.89315232291
757.778942266257
253.741848977733
46.8401889287379
252.373624794098
677.026001772899
-576.704995541029
277.144725371682
-584.310379589966
-69.148687685336
-162.068383895450
-579.036222415203
1104.83005850628
-1175.89125123945
626.070612670209
658.749071302326
-1087.46710911575
-792.86996881003
-174.787443141474
784.327067594848
485.708086575143
83.0510302762539


Parameters (Session):
par1 = Default ; par2 = 1 ; par3 = 0 ; par4 = 0 ; par5 = 12 ; par6 = White Noise ; par7 = 0.95 ;
Parameters (R input):
par1 = FALSE ; par2 = 1.0 ; par3 = 2 ; par4 = 1 ; par5 = 12 ; par6 = 3 ; par7 = 1 ; par8 = 2 ; par9 = 1 ;
R code (references can be found in the software module):
library(lattice)
if (par1 == 'TRUE') par1 <- TRUE
if (par1 == 'FALSE') par1 <- FALSE
par2 <- as.numeric(par2) #Box-Cox lambda transformation parameter
par3 <- as.numeric(par3) #degree of non-seasonal differencing
par4 <- as.numeric(par4) #degree of seasonal differencing
par5 <- as.numeric(par5) #seasonal period
par6 <- as.numeric(par6) #degree (p) of the non-seasonal AR(p) polynomial
par7 <- as.numeric(par7) #degree (q) of the non-seasonal MA(q) polynomial
par8 <- as.numeric(par8) #degree (P) of the seasonal AR(P) polynomial
par9 <- as.numeric(par9) #degree (Q) of the seasonal MA(Q) polynomial
armaGR <- function(arima.out, names, n){
try1 <- arima.out$coef
try2 <- sqrt(diag(arima.out$var.coef))
try.data.frame <- data.frame(matrix(NA,ncol=4,nrow=length(names)))
dimnames(try.data.frame) <- list(names,c('coef','std','tstat','pv'))
try.data.frame[,1] <- try1
for(i in 1:length(try2)) try.data.frame[which(rownames(try.data.frame)==names(try2)[i]),2] <- try2[i]
try.data.frame[,3] <- try.data.frame[,1] / try.data.frame[,2]
try.data.frame[,4] <- round((1-pt(abs(try.data.frame[,3]),df=n-(length(try2)+1)))*2,5)
vector <- rep(NA,length(names))
vector[is.na(try.data.frame[,4])] <- 0
maxi <- which.max(try.data.frame[,4])
continue <- max(try.data.frame[,4],na.rm=TRUE) > .05
vector[maxi] <- 0
list(summary=try.data.frame,next.vector=vector,continue=continue)
}
arimaSelect <- function(series, order=c(13,0,0), seasonal=list(order=c(2,0,0),period=12), include.mean=F){
nrc <- order[1]+order[3]+seasonal$order[1]+seasonal$order[3]
coeff <- matrix(NA, nrow=nrc*2, ncol=nrc)
pval <- matrix(NA, nrow=nrc*2, ncol=nrc)
mylist <- rep(list(NULL), nrc)
names <- NULL
if(order[1] > 0) names <- paste('ar',1:order[1],sep='')
if(order[3] > 0) names <- c( names , paste('ma',1:order[3],sep='') )
if(seasonal$order[1] > 0) names <- c(names, paste('sar',1:seasonal$order[1],sep=''))
if(seasonal$order[3] > 0) names <- c(names, paste('sma',1:seasonal$order[3],sep=''))
arima.out <- arima(series, order=order, seasonal=seasonal, include.mean=include.mean, method='ML')
mylist[[1]] <- arima.out
last.arma <- armaGR(arima.out, names, length(series))
mystop <- FALSE
i <- 1
coeff[i,] <- last.arma[[1]][,1]
pval [i,] <- last.arma[[1]][,4]
i <- 2
aic <- arima.out$aic
while(!mystop){
mylist[[i]] <- arima.out
arima.out <- arima(series, order=order, seasonal=seasonal, include.mean=include.mean, method='ML', fixed=last.arma$next.vector)
aic <- c(aic, arima.out$aic)
last.arma <- armaGR(arima.out, names, length(series))
mystop <- !last.arma$continue
coeff[i,] <- last.arma[[1]][,1]
pval [i,] <- last.arma[[1]][,4]
i <- i+1
}
list(coeff, pval, mylist, aic=aic)
}
arimaSelectplot <- function(arimaSelect.out,noms,choix){
noms <- names(arimaSelect.out[[3]][[1]]$coef)
coeff <- arimaSelect.out[[1]]
k <- min(which(is.na(coeff[,1])))-1
coeff <- coeff[1:k,]
pval <- arimaSelect.out[[2]][1:k,]
aic <- arimaSelect.out$aic[1:k]
coeff[coeff==0] <- NA
n <- ncol(coeff)
if(missing(choix)) choix <- k
layout(matrix(c(1,1,1,2,
3,3,3,2,
3,3,3,4,
5,6,7,7),nr=4),
widths=c(10,35,45,15),
heights=c(30,30,15,15))
couleurs <- rainbow(75)[1:50]#(50)
ticks <- pretty(coeff)
par(mar=c(1,1,3,1))
plot(aic,k:1-.5,type='o',pch=21,bg='blue',cex=2,axes=F,lty=2,xpd=NA)
points(aic[choix],k-choix+.5,pch=21,cex=4,bg=2,xpd=NA)
title('aic',line=2)
par(mar=c(3,0,0,0))
plot(0,axes=F,xlab='',ylab='',xlim=range(ticks),ylim=c(.1,1))
rect(xleft = min(ticks) + (0:49)/50*(max(ticks)-min(ticks)),
xright = min(ticks) + (1:50)/50*(max(ticks)-min(ticks)),
ytop = rep(1,50),
ybottom= rep(0,50),col=couleurs,border=NA)
axis(1,ticks)
rect(xleft=min(ticks),xright=max(ticks),ytop=1,ybottom=0)
text(mean(coeff,na.rm=T),.5,'coefficients',cex=2,font=2)
par(mar=c(1,1,3,1))
image(1:n,1:k,t(coeff[k:1,]),axes=F,col=couleurs,zlim=range(ticks))
for(i in 1:n) for(j in 1:k) if(!is.na(coeff[j,i])) {
if(pval[j,i]<.01) symb = 'green'
else if( (pval[j,i]<.05) & (pval[j,i]>=.01)) symb = 'orange'
else if( (pval[j,i]<.1) & (pval[j,i]>=.05)) symb = 'red'
else symb = 'black'
polygon(c(i+.5 ,i+.2 ,i+.5 ,i+.5),
c(k-j+0.5,k-j+0.5,k-j+0.8,k-j+0.5),
col=symb)
if(j==choix) {
rect(xleft=i-.5,
xright=i+.5,
ybottom=k-j+1.5,
ytop=k-j+.5,
lwd=4)
text(i,
k-j+1,
round(coeff[j,i],2),
cex=1.2,
font=2)
}
else{
rect(xleft=i-.5,xright=i+.5,ybottom=k-j+1.5,ytop=k-j+.5)
text(i,k-j+1,round(coeff[j,i],2),cex=1.2,font=1)
}
}
axis(3,1:n,noms)
par(mar=c(0.5,0,0,0.5))
plot(0,axes=F,xlab='',ylab='',type='n',xlim=c(0,8),ylim=c(-.2,.8))
cols <- c('green','orange','red','black')
niv <- c('0','0.01','0.05','0.1')
for(i in 0:3){
polygon(c(1+2*i ,1+2*i ,1+2*i-.5 ,1+2*i),
c(.4 ,.7 , .4 , .4),
col=cols[i+1])
text(2*i,0.5,niv[i+1],cex=1.5)
}
text(8,.5,1,cex=1.5)
text(4,0,'p-value',cex=2)
box()
residus <- arimaSelect.out[[3]][[choix]]$res
par(mar=c(1,2,4,1))
acf(residus,main='')
title('acf',line=.5)
par(mar=c(1,2,4,1))
pacf(residus,main='')
title('pacf',line=.5)
par(mar=c(2,2,4,1))
qqnorm(residus,main='')
title('qq-norm',line=.5)
qqline(residus)
residus
}
if (par2 == 0) x <- log(x)
if (par2 != 0) x <- x^par2
(selection <- arimaSelect(x, order=c(par6,par3,par7), seasonal=list(order=c(par8,par4,par9), period=par5)))
bitmap(file='test1.png')
resid <- arimaSelectplot(selection)
dev.off()
resid
bitmap(file='test2.png')
acf(resid,length(resid)/2, main='Residual Autocorrelation Function')
dev.off()
bitmap(file='test3.png')
pacf(resid,length(resid)/2, main='Residual Partial Autocorrelation Function')
dev.off()
bitmap(file='test4.png')
cpgram(resid, main='Residual Cumulative Periodogram')
dev.off()
bitmap(file='test5.png')
hist(resid, main='Residual Histogram', xlab='values of Residuals')
dev.off()
bitmap(file='test6.png')
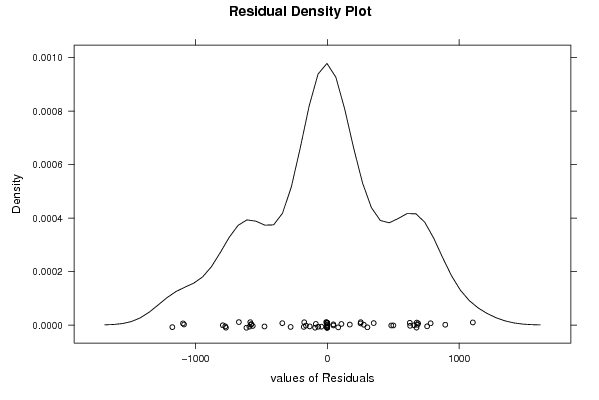
densityplot(~resid,col='black',main='Residual Density Plot', xlab='values of Residuals')
dev.off()
bitmap(file='test7.png')
qqnorm(resid, main='Residual Normal Q-Q Plot')
qqline(resid)
dev.off()
ncols <- length(selection[[1]][1,])
nrows <- length(selection[[2]][,1])-1
load(file='createtable')
a<-table.start()
a<-table.row.start(a)
a<-table.element(a,'ARIMA Parameter Estimation and Backward Selection', ncols+1,TRUE)
a<-table.row.end(a)
a<-table.row.start(a)
a<-table.element(a,'Iteration', header=TRUE)
for (i in 1:ncols) {
a<-table.element(a,names(selection[[3]][[1]]$coef)[i],header=TRUE)
}
a<-table.row.end(a)
for (j in 1:nrows) {
a<-table.row.start(a)
mydum <- 'Estimates ('
mydum <- paste(mydum,j)
mydum <- paste(mydum,')')
a<-table.element(a,mydum, header=TRUE)
for (i in 1:ncols) {
a<-table.element(a,round(selection[[1]][j,i],4))
}
a<-table.row.end(a)
a<-table.row.start(a)
a<-table.element(a,'(p-val)', header=TRUE)
for (i in 1:ncols) {
mydum <- '('
mydum <- paste(mydum,round(selection[[2]][j,i],4),sep='')
mydum <- paste(mydum,')')
a<-table.element(a,mydum)
}
a<-table.row.end(a)
}
a<-table.end(a)
table.save(a,file='mytable.tab')
a<-table.start()
a<-table.row.start(a)
a<-table.element(a,'Estimated ARIMA Residuals', 1,TRUE)
a<-table.row.end(a)
a<-table.row.start(a)
a<-table.element(a,'Value', 1,TRUE)
a<-table.row.end(a)
for (i in (par4*par5+par3):length(resid)) {
a<-table.row.start(a)
a<-table.element(a,resid[i])
a<-table.row.end(a)
}
a<-table.end(a)
table.save(a,file='mytable1.tab')