Free Statistics

of Irreproducible Research!

Author's title

Author*The author of this computation has been verified*
R Software Modulerwasp_autocorrelation.wasp
Title produced by software(Partial) Autocorrelation Function
Date of computationThu, 17 Dec 2009 00:47:23 -0700
Cite this page as followsStatistical Computations at FreeStatistics.org, Office for Research Development and Education, URL https://freestatistics.org/blog/index.php?v=date/2009/Dec/17/t12610362771j3rqx0g0sjnk4q.htm/, Retrieved Tue, 30 Apr 2024 00:20:18 +0000
Statistical Computations at FreeStatistics.org, Office for Research Development and Education, URL https://freestatistics.org/blog/index.php?pk=68638, Retrieved Tue, 30 Apr 2024 00:20:18 +0000
QR Codes:

Original text written by user:
IsPrivate?No (this computation is public)
User-defined keywords
Estimated Impact134
Family? (F = Feedback message, R = changed R code, M = changed R Module, P = changed Parameters, D = changed Data)
-     [(Partial) Autocorrelation Function] [] [2009-11-25 10:38:28] [3daae06e609b839af47edc9c5015e41f]
- R  D    [(Partial) Autocorrelation Function] [] [2009-12-17 07:47:23] [21503129a47c64de7f80e1fde84c3a45] [Current]
Feedback Forum

Post a new message
Dataseries X:
98,8
100,5
110,4
96,4
101,9
106,2
81
94,7
101
109,4
102,3
90,7
96,2
96,1
106
103,1
102
104,7
86
92,1
106,9
112,6
101,7
92
97,4
97
105,4
102,7
98,1
104,5
87,4
89,9
109,8
111,7
98,6
96,9
95,1
97
112,7
102,9
97,4
111,4
87,4
96,8
114,1
110,3
103,9
101,6
94,6
95,9
104,7
102,8
98,1
113,9
80,9
95,7
113,2
105,9
108,8
102,3


Summary of computational transaction
Raw Inputview raw input (R code)
Raw Outputview raw output of R engine
Computing time1 seconds
R Server'Gwilym Jenkins' @ 72.249.127.135

\begin{tabular}{lllllllll}
\hline
Summary of computational transaction \tabularnewline
Raw Input & view raw input (R code)  \tabularnewline
Raw Output & view raw output of R engine  \tabularnewline
Computing time & 1 seconds \tabularnewline
R Server & 'Gwilym Jenkins' @ 72.249.127.135 \tabularnewline
\hline
\end{tabular}
%Source: https://freestatistics.org/blog/index.php?pk=68638&T=0

[TABLE]
[ROW][C]Summary of computational transaction[/C][/ROW]
[ROW][C]Raw Input[/C][C]view raw input (R code) [/C][/ROW]
[ROW][C]Raw Output[/C][C]view raw output of R engine [/C][/ROW]
[ROW][C]Computing time[/C][C]1 seconds[/C][/ROW]
[ROW][C]R Server[/C][C]'Gwilym Jenkins' @ 72.249.127.135[/C][/ROW]
[/TABLE]
Source: https://freestatistics.org/blog/index.php?pk=68638&T=0

Globally Unique Identifier (entire table): ba.freestatistics.org/blog/index.php?pk=68638&T=0

As an alternative you can also use a QR Code:  

The GUIDs for individual cells are displayed in the table below:

Summary of computational transaction
Raw Inputview raw input (R code)
Raw Outputview raw output of R engine
Computing time1 seconds
R Server'Gwilym Jenkins' @ 72.249.127.135


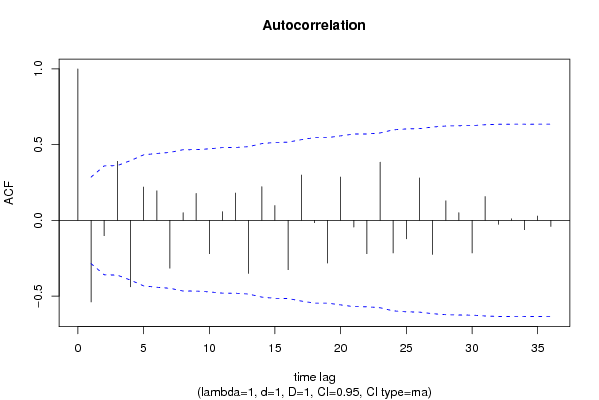
Autocorrelation Function
Time lag kACF(k)T-STATP-value
1-0.539175-3.69640.000285
2-0.101653-0.69690.244651
30.3896422.67130.005175
4-0.439125-3.01050.002093
50.2200851.50880.069019
60.1948381.33570.094033
7-0.315699-2.16430.017776
80.0509910.34960.36411
90.1775641.21730.11478
10-0.22023-1.50980.068891
110.0572150.39220.348324
120.1803421.23640.111234
13-0.350446-2.40250.010142
140.2224961.52540.066936
150.0974790.66830.25361
16-0.325404-2.23090.01525
170.2994642.0530.02283
18-0.015065-0.10330.45909
19-0.281943-1.93290.029643
200.2859521.96040.027946
21-0.044152-0.30270.381731
22-0.220115-1.5090.068992
230.3840332.63280.005712
24-0.215091-1.47460.073495
25-0.121602-0.83370.204345
260.2798031.91820.030584
27-0.225353-1.54490.064534
280.1288510.88340.19077
290.0509680.34940.364167
30-0.215284-1.47590.073318
310.157151.07740.143408
32-0.025733-0.17640.430362
330.0105350.07220.471365
34-0.061375-0.42080.337922
350.0281170.19280.423988
36-0.039846-0.27320.392961

\begin{tabular}{lllllllll}
\hline
Autocorrelation Function \tabularnewline
Time lag k & ACF(k) & T-STAT & P-value \tabularnewline
1 & -0.539175 & -3.6964 & 0.000285 \tabularnewline
2 & -0.101653 & -0.6969 & 0.244651 \tabularnewline
3 & 0.389642 & 2.6713 & 0.005175 \tabularnewline
4 & -0.439125 & -3.0105 & 0.002093 \tabularnewline
5 & 0.220085 & 1.5088 & 0.069019 \tabularnewline
6 & 0.194838 & 1.3357 & 0.094033 \tabularnewline
7 & -0.315699 & -2.1643 & 0.017776 \tabularnewline
8 & 0.050991 & 0.3496 & 0.36411 \tabularnewline
9 & 0.177564 & 1.2173 & 0.11478 \tabularnewline
10 & -0.22023 & -1.5098 & 0.068891 \tabularnewline
11 & 0.057215 & 0.3922 & 0.348324 \tabularnewline
12 & 0.180342 & 1.2364 & 0.111234 \tabularnewline
13 & -0.350446 & -2.4025 & 0.010142 \tabularnewline
14 & 0.222496 & 1.5254 & 0.066936 \tabularnewline
15 & 0.097479 & 0.6683 & 0.25361 \tabularnewline
16 & -0.325404 & -2.2309 & 0.01525 \tabularnewline
17 & 0.299464 & 2.053 & 0.02283 \tabularnewline
18 & -0.015065 & -0.1033 & 0.45909 \tabularnewline
19 & -0.281943 & -1.9329 & 0.029643 \tabularnewline
20 & 0.285952 & 1.9604 & 0.027946 \tabularnewline
21 & -0.044152 & -0.3027 & 0.381731 \tabularnewline
22 & -0.220115 & -1.509 & 0.068992 \tabularnewline
23 & 0.384033 & 2.6328 & 0.005712 \tabularnewline
24 & -0.215091 & -1.4746 & 0.073495 \tabularnewline
25 & -0.121602 & -0.8337 & 0.204345 \tabularnewline
26 & 0.279803 & 1.9182 & 0.030584 \tabularnewline
27 & -0.225353 & -1.5449 & 0.064534 \tabularnewline
28 & 0.128851 & 0.8834 & 0.19077 \tabularnewline
29 & 0.050968 & 0.3494 & 0.364167 \tabularnewline
30 & -0.215284 & -1.4759 & 0.073318 \tabularnewline
31 & 0.15715 & 1.0774 & 0.143408 \tabularnewline
32 & -0.025733 & -0.1764 & 0.430362 \tabularnewline
33 & 0.010535 & 0.0722 & 0.471365 \tabularnewline
34 & -0.061375 & -0.4208 & 0.337922 \tabularnewline
35 & 0.028117 & 0.1928 & 0.423988 \tabularnewline
36 & -0.039846 & -0.2732 & 0.392961 \tabularnewline
\hline
\end{tabular}
%Source: https://freestatistics.org/blog/index.php?pk=68638&T=1

[TABLE]
[ROW][C]Autocorrelation Function[/C][/ROW]
[ROW][C]Time lag k[/C][C]ACF(k)[/C][C]T-STAT[/C][C]P-value[/C][/ROW]
[ROW][C]1[/C][C]-0.539175[/C][C]-3.6964[/C][C]0.000285[/C][/ROW]
[ROW][C]2[/C][C]-0.101653[/C][C]-0.6969[/C][C]0.244651[/C][/ROW]
[ROW][C]3[/C][C]0.389642[/C][C]2.6713[/C][C]0.005175[/C][/ROW]
[ROW][C]4[/C][C]-0.439125[/C][C]-3.0105[/C][C]0.002093[/C][/ROW]
[ROW][C]5[/C][C]0.220085[/C][C]1.5088[/C][C]0.069019[/C][/ROW]
[ROW][C]6[/C][C]0.194838[/C][C]1.3357[/C][C]0.094033[/C][/ROW]
[ROW][C]7[/C][C]-0.315699[/C][C]-2.1643[/C][C]0.017776[/C][/ROW]
[ROW][C]8[/C][C]0.050991[/C][C]0.3496[/C][C]0.36411[/C][/ROW]
[ROW][C]9[/C][C]0.177564[/C][C]1.2173[/C][C]0.11478[/C][/ROW]
[ROW][C]10[/C][C]-0.22023[/C][C]-1.5098[/C][C]0.068891[/C][/ROW]
[ROW][C]11[/C][C]0.057215[/C][C]0.3922[/C][C]0.348324[/C][/ROW]
[ROW][C]12[/C][C]0.180342[/C][C]1.2364[/C][C]0.111234[/C][/ROW]
[ROW][C]13[/C][C]-0.350446[/C][C]-2.4025[/C][C]0.010142[/C][/ROW]
[ROW][C]14[/C][C]0.222496[/C][C]1.5254[/C][C]0.066936[/C][/ROW]
[ROW][C]15[/C][C]0.097479[/C][C]0.6683[/C][C]0.25361[/C][/ROW]
[ROW][C]16[/C][C]-0.325404[/C][C]-2.2309[/C][C]0.01525[/C][/ROW]
[ROW][C]17[/C][C]0.299464[/C][C]2.053[/C][C]0.02283[/C][/ROW]
[ROW][C]18[/C][C]-0.015065[/C][C]-0.1033[/C][C]0.45909[/C][/ROW]
[ROW][C]19[/C][C]-0.281943[/C][C]-1.9329[/C][C]0.029643[/C][/ROW]
[ROW][C]20[/C][C]0.285952[/C][C]1.9604[/C][C]0.027946[/C][/ROW]
[ROW][C]21[/C][C]-0.044152[/C][C]-0.3027[/C][C]0.381731[/C][/ROW]
[ROW][C]22[/C][C]-0.220115[/C][C]-1.509[/C][C]0.068992[/C][/ROW]
[ROW][C]23[/C][C]0.384033[/C][C]2.6328[/C][C]0.005712[/C][/ROW]
[ROW][C]24[/C][C]-0.215091[/C][C]-1.4746[/C][C]0.073495[/C][/ROW]
[ROW][C]25[/C][C]-0.121602[/C][C]-0.8337[/C][C]0.204345[/C][/ROW]
[ROW][C]26[/C][C]0.279803[/C][C]1.9182[/C][C]0.030584[/C][/ROW]
[ROW][C]27[/C][C]-0.225353[/C][C]-1.5449[/C][C]0.064534[/C][/ROW]
[ROW][C]28[/C][C]0.128851[/C][C]0.8834[/C][C]0.19077[/C][/ROW]
[ROW][C]29[/C][C]0.050968[/C][C]0.3494[/C][C]0.364167[/C][/ROW]
[ROW][C]30[/C][C]-0.215284[/C][C]-1.4759[/C][C]0.073318[/C][/ROW]
[ROW][C]31[/C][C]0.15715[/C][C]1.0774[/C][C]0.143408[/C][/ROW]
[ROW][C]32[/C][C]-0.025733[/C][C]-0.1764[/C][C]0.430362[/C][/ROW]
[ROW][C]33[/C][C]0.010535[/C][C]0.0722[/C][C]0.471365[/C][/ROW]
[ROW][C]34[/C][C]-0.061375[/C][C]-0.4208[/C][C]0.337922[/C][/ROW]
[ROW][C]35[/C][C]0.028117[/C][C]0.1928[/C][C]0.423988[/C][/ROW]
[ROW][C]36[/C][C]-0.039846[/C][C]-0.2732[/C][C]0.392961[/C][/ROW]
[/TABLE]
Source: https://freestatistics.org/blog/index.php?pk=68638&T=1

Globally Unique Identifier (entire table): ba.freestatistics.org/blog/index.php?pk=68638&T=1

As an alternative you can also use a QR Code:  

The GUIDs for individual cells are displayed in the table below:

Autocorrelation Function
Time lag kACF(k)T-STATP-value
1-0.539175-3.69640.000285
2-0.101653-0.69690.244651
30.3896422.67130.005175
4-0.439125-3.01050.002093
50.2200851.50880.069019
60.1948381.33570.094033
7-0.315699-2.16430.017776
80.0509910.34960.36411
90.1775641.21730.11478
10-0.22023-1.50980.068891
110.0572150.39220.348324
120.1803421.23640.111234
13-0.350446-2.40250.010142
140.2224961.52540.066936
150.0974790.66830.25361
16-0.325404-2.23090.01525
170.2994642.0530.02283
18-0.015065-0.10330.45909
19-0.281943-1.93290.029643
200.2859521.96040.027946
21-0.044152-0.30270.381731
22-0.220115-1.5090.068992
230.3840332.63280.005712
24-0.215091-1.47460.073495
25-0.121602-0.83370.204345
260.2798031.91820.030584
27-0.225353-1.54490.064534
280.1288510.88340.19077
290.0509680.34940.364167
30-0.215284-1.47590.073318
310.157151.07740.143408
32-0.025733-0.17640.430362
330.0105350.07220.471365
34-0.061375-0.42080.337922
350.0281170.19280.423988
36-0.039846-0.27320.392961


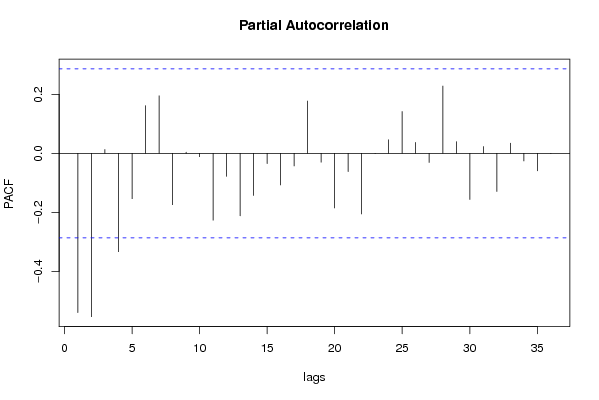
Partial Autocorrelation Function
Time lag kPACF(k)T-STATP-value
1-0.539175-3.69640.000285
2-0.553176-3.79240.000213
30.012710.08710.465468
4-0.332941-2.28250.013514
5-0.153696-1.05370.148707
60.1615531.10760.136845
70.1949291.33640.093932
8-0.173966-1.19260.119497
90.003750.02570.489799
10-0.011512-0.07890.468715
11-0.226381-1.5520.063686
12-0.077886-0.5340.297944
13-0.211484-1.44990.076869
14-0.142769-0.97880.166351
15-0.03442-0.2360.407241
16-0.106967-0.73330.2335
17-0.042869-0.29390.385066
180.177231.2150.115213
19-0.029977-0.20550.41903
20-0.184924-1.26780.105562
21-0.061595-0.42230.337375
22-0.205145-1.40640.083091
23-0.000359-0.00250.499023
240.0458620.31440.3773
250.1417540.97180.168059
260.0370160.25380.40039
27-0.030928-0.2120.416499
280.2280811.56360.062305
290.0396790.2720.393398
30-0.156023-1.06960.145122
310.0229030.1570.437953
32-0.128989-0.88430.190516
330.0344280.2360.407219
34-0.025806-0.17690.430167
35-0.059166-0.40560.34343
36-0.000283-0.00190.499231

\begin{tabular}{lllllllll}
\hline
Partial Autocorrelation Function \tabularnewline
Time lag k & PACF(k) & T-STAT & P-value \tabularnewline
1 & -0.539175 & -3.6964 & 0.000285 \tabularnewline
2 & -0.553176 & -3.7924 & 0.000213 \tabularnewline
3 & 0.01271 & 0.0871 & 0.465468 \tabularnewline
4 & -0.332941 & -2.2825 & 0.013514 \tabularnewline
5 & -0.153696 & -1.0537 & 0.148707 \tabularnewline
6 & 0.161553 & 1.1076 & 0.136845 \tabularnewline
7 & 0.194929 & 1.3364 & 0.093932 \tabularnewline
8 & -0.173966 & -1.1926 & 0.119497 \tabularnewline
9 & 0.00375 & 0.0257 & 0.489799 \tabularnewline
10 & -0.011512 & -0.0789 & 0.468715 \tabularnewline
11 & -0.226381 & -1.552 & 0.063686 \tabularnewline
12 & -0.077886 & -0.534 & 0.297944 \tabularnewline
13 & -0.211484 & -1.4499 & 0.076869 \tabularnewline
14 & -0.142769 & -0.9788 & 0.166351 \tabularnewline
15 & -0.03442 & -0.236 & 0.407241 \tabularnewline
16 & -0.106967 & -0.7333 & 0.2335 \tabularnewline
17 & -0.042869 & -0.2939 & 0.385066 \tabularnewline
18 & 0.17723 & 1.215 & 0.115213 \tabularnewline
19 & -0.029977 & -0.2055 & 0.41903 \tabularnewline
20 & -0.184924 & -1.2678 & 0.105562 \tabularnewline
21 & -0.061595 & -0.4223 & 0.337375 \tabularnewline
22 & -0.205145 & -1.4064 & 0.083091 \tabularnewline
23 & -0.000359 & -0.0025 & 0.499023 \tabularnewline
24 & 0.045862 & 0.3144 & 0.3773 \tabularnewline
25 & 0.141754 & 0.9718 & 0.168059 \tabularnewline
26 & 0.037016 & 0.2538 & 0.40039 \tabularnewline
27 & -0.030928 & -0.212 & 0.416499 \tabularnewline
28 & 0.228081 & 1.5636 & 0.062305 \tabularnewline
29 & 0.039679 & 0.272 & 0.393398 \tabularnewline
30 & -0.156023 & -1.0696 & 0.145122 \tabularnewline
31 & 0.022903 & 0.157 & 0.437953 \tabularnewline
32 & -0.128989 & -0.8843 & 0.190516 \tabularnewline
33 & 0.034428 & 0.236 & 0.407219 \tabularnewline
34 & -0.025806 & -0.1769 & 0.430167 \tabularnewline
35 & -0.059166 & -0.4056 & 0.34343 \tabularnewline
36 & -0.000283 & -0.0019 & 0.499231 \tabularnewline
\hline
\end{tabular}
%Source: https://freestatistics.org/blog/index.php?pk=68638&T=2

[TABLE]
[ROW][C]Partial Autocorrelation Function[/C][/ROW]
[ROW][C]Time lag k[/C][C]PACF(k)[/C][C]T-STAT[/C][C]P-value[/C][/ROW]
[ROW][C]1[/C][C]-0.539175[/C][C]-3.6964[/C][C]0.000285[/C][/ROW]
[ROW][C]2[/C][C]-0.553176[/C][C]-3.7924[/C][C]0.000213[/C][/ROW]
[ROW][C]3[/C][C]0.01271[/C][C]0.0871[/C][C]0.465468[/C][/ROW]
[ROW][C]4[/C][C]-0.332941[/C][C]-2.2825[/C][C]0.013514[/C][/ROW]
[ROW][C]5[/C][C]-0.153696[/C][C]-1.0537[/C][C]0.148707[/C][/ROW]
[ROW][C]6[/C][C]0.161553[/C][C]1.1076[/C][C]0.136845[/C][/ROW]
[ROW][C]7[/C][C]0.194929[/C][C]1.3364[/C][C]0.093932[/C][/ROW]
[ROW][C]8[/C][C]-0.173966[/C][C]-1.1926[/C][C]0.119497[/C][/ROW]
[ROW][C]9[/C][C]0.00375[/C][C]0.0257[/C][C]0.489799[/C][/ROW]
[ROW][C]10[/C][C]-0.011512[/C][C]-0.0789[/C][C]0.468715[/C][/ROW]
[ROW][C]11[/C][C]-0.226381[/C][C]-1.552[/C][C]0.063686[/C][/ROW]
[ROW][C]12[/C][C]-0.077886[/C][C]-0.534[/C][C]0.297944[/C][/ROW]
[ROW][C]13[/C][C]-0.211484[/C][C]-1.4499[/C][C]0.076869[/C][/ROW]
[ROW][C]14[/C][C]-0.142769[/C][C]-0.9788[/C][C]0.166351[/C][/ROW]
[ROW][C]15[/C][C]-0.03442[/C][C]-0.236[/C][C]0.407241[/C][/ROW]
[ROW][C]16[/C][C]-0.106967[/C][C]-0.7333[/C][C]0.2335[/C][/ROW]
[ROW][C]17[/C][C]-0.042869[/C][C]-0.2939[/C][C]0.385066[/C][/ROW]
[ROW][C]18[/C][C]0.17723[/C][C]1.215[/C][C]0.115213[/C][/ROW]
[ROW][C]19[/C][C]-0.029977[/C][C]-0.2055[/C][C]0.41903[/C][/ROW]
[ROW][C]20[/C][C]-0.184924[/C][C]-1.2678[/C][C]0.105562[/C][/ROW]
[ROW][C]21[/C][C]-0.061595[/C][C]-0.4223[/C][C]0.337375[/C][/ROW]
[ROW][C]22[/C][C]-0.205145[/C][C]-1.4064[/C][C]0.083091[/C][/ROW]
[ROW][C]23[/C][C]-0.000359[/C][C]-0.0025[/C][C]0.499023[/C][/ROW]
[ROW][C]24[/C][C]0.045862[/C][C]0.3144[/C][C]0.3773[/C][/ROW]
[ROW][C]25[/C][C]0.141754[/C][C]0.9718[/C][C]0.168059[/C][/ROW]
[ROW][C]26[/C][C]0.037016[/C][C]0.2538[/C][C]0.40039[/C][/ROW]
[ROW][C]27[/C][C]-0.030928[/C][C]-0.212[/C][C]0.416499[/C][/ROW]
[ROW][C]28[/C][C]0.228081[/C][C]1.5636[/C][C]0.062305[/C][/ROW]
[ROW][C]29[/C][C]0.039679[/C][C]0.272[/C][C]0.393398[/C][/ROW]
[ROW][C]30[/C][C]-0.156023[/C][C]-1.0696[/C][C]0.145122[/C][/ROW]
[ROW][C]31[/C][C]0.022903[/C][C]0.157[/C][C]0.437953[/C][/ROW]
[ROW][C]32[/C][C]-0.128989[/C][C]-0.8843[/C][C]0.190516[/C][/ROW]
[ROW][C]33[/C][C]0.034428[/C][C]0.236[/C][C]0.407219[/C][/ROW]
[ROW][C]34[/C][C]-0.025806[/C][C]-0.1769[/C][C]0.430167[/C][/ROW]
[ROW][C]35[/C][C]-0.059166[/C][C]-0.4056[/C][C]0.34343[/C][/ROW]
[ROW][C]36[/C][C]-0.000283[/C][C]-0.0019[/C][C]0.499231[/C][/ROW]
[/TABLE]
Source: https://freestatistics.org/blog/index.php?pk=68638&T=2

Globally Unique Identifier (entire table): ba.freestatistics.org/blog/index.php?pk=68638&T=2

As an alternative you can also use a QR Code:  

The GUIDs for individual cells are displayed in the table below:

Partial Autocorrelation Function
Time lag kPACF(k)T-STATP-value
1-0.539175-3.69640.000285
2-0.553176-3.79240.000213
30.012710.08710.465468
4-0.332941-2.28250.013514
5-0.153696-1.05370.148707
60.1615531.10760.136845
70.1949291.33640.093932
8-0.173966-1.19260.119497
90.003750.02570.489799
10-0.011512-0.07890.468715
11-0.226381-1.5520.063686
12-0.077886-0.5340.297944
13-0.211484-1.44990.076869
14-0.142769-0.97880.166351
15-0.03442-0.2360.407241
16-0.106967-0.73330.2335
17-0.042869-0.29390.385066
180.177231.2150.115213
19-0.029977-0.20550.41903
20-0.184924-1.26780.105562
21-0.061595-0.42230.337375
22-0.205145-1.40640.083091
23-0.000359-0.00250.499023
240.0458620.31440.3773
250.1417540.97180.168059
260.0370160.25380.40039
27-0.030928-0.2120.416499
280.2280811.56360.062305
290.0396790.2720.393398
30-0.156023-1.06960.145122
310.0229030.1570.437953
32-0.128989-0.88430.190516
330.0344280.2360.407219
34-0.025806-0.17690.430167
35-0.059166-0.40560.34343
36-0.000283-0.00190.499231


Parameters (Session):
par1 = 36 ; par2 = 1 ; par3 = 1 ; par4 = 1 ; par5 = 12 ; par6 = MA ; par7 = 0.95 ;
Parameters (R input):
par1 = 36 ; par2 = 1 ; par3 = 1 ; par4 = 1 ; par5 = 12 ; par6 = MA ; par7 = 0.95 ;
R code (references can be found in the software module):
if (par1 == 'Default') {
par1 = 10*log10(length(x))
} else {
par1 <- as.numeric(par1)
}
par2 <- as.numeric(par2)
par3 <- as.numeric(par3)
par4 <- as.numeric(par4)
par5 <- as.numeric(par5)
if (par6 == 'White Noise') par6 <- 'white' else par6 <- 'ma'
par7 <- as.numeric(par7)
if (par2 == 0) {
x <- log(x)
} else {
x <- (x ^ par2 - 1) / par2
}
if (par3 > 0) x <- diff(x,lag=1,difference=par3)
if (par4 > 0) x <- diff(x,lag=par5,difference=par4)
bitmap(file='pic1.png')
racf <- acf(x, par1, main='Autocorrelation', xlab='time lag', ylab='ACF', ci.type=par6, ci=par7, sub=paste('(lambda=',par2,', d=',par3,', D=',par4,', CI=', par7, ', CI type=',par6,')',sep=''))
dev.off()
bitmap(file='pic2.png')
rpacf <- pacf(x,par1,main='Partial Autocorrelation',xlab='lags',ylab='PACF')
dev.off()
(myacf <- c(racf$acf))
(mypacf <- c(rpacf$acf))
lengthx <- length(x)
sqrtn <- sqrt(lengthx)
load(file='createtable')
a<-table.start()
a<-table.row.start(a)
a<-table.element(a,'Autocorrelation Function',4,TRUE)
a<-table.row.end(a)
a<-table.row.start(a)
a<-table.element(a,'Time lag k',header=TRUE)
a<-table.element(a,hyperlink('basics.htm','ACF(k)','click here for more information about the Autocorrelation Function'),header=TRUE)
a<-table.element(a,'T-STAT',header=TRUE)
a<-table.element(a,'P-value',header=TRUE)
a<-table.row.end(a)
for (i in 2:(par1+1)) {
a<-table.row.start(a)
a<-table.element(a,i-1,header=TRUE)
a<-table.element(a,round(myacf[i],6))
mytstat <- myacf[i]*sqrtn
a<-table.element(a,round(mytstat,4))
a<-table.element(a,round(1-pt(abs(mytstat),lengthx),6))
a<-table.row.end(a)
}
a<-table.end(a)
table.save(a,file='mytable.tab')
a<-table.start()
a<-table.row.start(a)
a<-table.element(a,'Partial Autocorrelation Function',4,TRUE)
a<-table.row.end(a)
a<-table.row.start(a)
a<-table.element(a,'Time lag k',header=TRUE)
a<-table.element(a,hyperlink('basics.htm','PACF(k)','click here for more information about the Partial Autocorrelation Function'),header=TRUE)
a<-table.element(a,'T-STAT',header=TRUE)
a<-table.element(a,'P-value',header=TRUE)
a<-table.row.end(a)
for (i in 1:par1) {
a<-table.row.start(a)
a<-table.element(a,i,header=TRUE)
a<-table.element(a,round(mypacf[i],6))
mytstat <- mypacf[i]*sqrtn
a<-table.element(a,round(mytstat,4))
a<-table.element(a,round(1-pt(abs(mytstat),lengthx),6))
a<-table.row.end(a)
}
a<-table.end(a)
table.save(a,file='mytable1.tab')