Free Statistics

of Irreproducible Research!

Author's title

Author*The author of this computation has been verified*
R Software Modulerwasp_arimabackwardselection.wasp
Title produced by softwareARIMA Backward Selection
Date of computationThu, 17 Dec 2009 02:35:44 -0700
Cite this page as followsStatistical Computations at FreeStatistics.org, Office for Research Development and Education, URL https://freestatistics.org/blog/index.php?v=date/2009/Dec/17/t12610425865jcb14l9p8sp6a6.htm/, Retrieved Tue, 30 Apr 2024 06:56:41 +0000
Statistical Computations at FreeStatistics.org, Office for Research Development and Education, URL https://freestatistics.org/blog/index.php?pk=68666, Retrieved Tue, 30 Apr 2024 06:56:41 +0000
QR Codes:

Original text written by user:
IsPrivate?No (this computation is public)
User-defined keywords
Estimated Impact135
Family? (F = Feedback message, R = changed R code, M = changed R Module, P = changed Parameters, D = changed Data)
-     [ARIMA Backward Selection] [Workshop 4, Q2] [2007-12-06 12:56:31] [c3fe85a72944c2c83ce86133657c8afd]
- R  D  [ARIMA Backward Selection] [ARIMA backward se...] [2008-12-22 12:58:13] [072df11bdb18ed8d65d8164df87f26f2]
-  MPD      [ARIMA Backward Selection] [] [2009-12-17 09:35:44] [66ffaa9e54a90d3ae4874684602d24e9] [Current]
Feedback Forum

Post a new message
Dataseries X:
17823.2
17872
17420.4
16704.4
15991.2
16583.6
19123.5
17838.7
17209.4
18586.5
16258.1
15141.6
19202.1
17746.5
19090.1
18040.3
17515.5
17751.8
21072.4
17170
19439.5
19795.4
17574.9
16165.4
19464.6
19932.1
19961.2
17343.4
18924.2
18574.1
21350.6
18594.6
19823.1
20844.4
19640.2
17735.4
19813.6
22160
20664.3
17877.4
20906.5
21164.1
21374.4
22952.3
21343.5
23899.3
22392.9
18274.1
22786.7
22321.5
17842.2
16373.5
15993.8
16446.1
17729
16643
16196.7
18252.1
17570.4
15836.8


Summary of computational transaction
Raw Inputview raw input (R code)
Raw Outputview raw output of R engine
Computing time14 seconds
R Server'Gwilym Jenkins' @ 72.249.127.135

\begin{tabular}{lllllllll}
\hline
Summary of computational transaction \tabularnewline
Raw Input & view raw input (R code)  \tabularnewline
Raw Output & view raw output of R engine  \tabularnewline
Computing time & 14 seconds \tabularnewline
R Server & 'Gwilym Jenkins' @ 72.249.127.135 \tabularnewline
\hline
\end{tabular}
%Source: https://freestatistics.org/blog/index.php?pk=68666&T=0

[TABLE]
[ROW][C]Summary of computational transaction[/C][/ROW]
[ROW][C]Raw Input[/C][C]view raw input (R code) [/C][/ROW]
[ROW][C]Raw Output[/C][C]view raw output of R engine [/C][/ROW]
[ROW][C]Computing time[/C][C]14 seconds[/C][/ROW]
[ROW][C]R Server[/C][C]'Gwilym Jenkins' @ 72.249.127.135[/C][/ROW]
[/TABLE]
Source: https://freestatistics.org/blog/index.php?pk=68666&T=0

Globally Unique Identifier (entire table): ba.freestatistics.org/blog/index.php?pk=68666&T=0

As an alternative you can also use a QR Code:  

The GUIDs for individual cells are displayed in the table below:

Summary of computational transaction
Raw Inputview raw input (R code)
Raw Outputview raw output of R engine
Computing time14 seconds
R Server'Gwilym Jenkins' @ 72.249.127.135


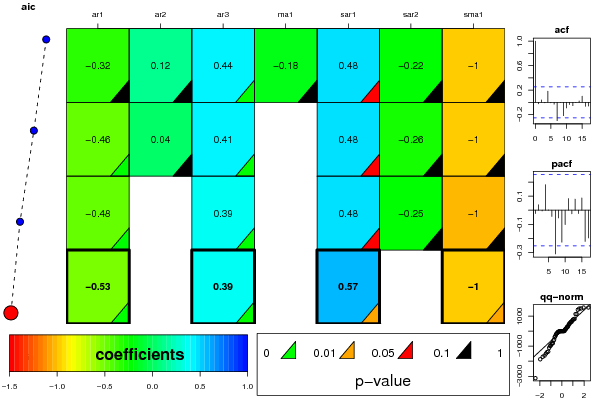
ARIMA Parameter Estimation and Backward Selection
Iterationar1ar2ar3ma1sar1sar2sma1
Estimates ( 1 )-0.32450.11710.4425-0.17730.4835-0.2175-1
(p-val)(0.2524 )(0.5455 )(0.0021 )(0.5732 )(0.06 )(0.455 )(0.2222 )
Estimates ( 2 )-0.45770.04070.411600.4755-0.2622-0.9997
(p-val)(0.0062 )(0.7994 )(0.0035 )(NA )(0.056 )(0.3346 )(0.2584 )
Estimates ( 3 )-0.478600.392600.4766-0.2467-1.0007
(p-val)(0.0011 )(NA )(9e-04 )(NA )(0.06 )(0.3595 )(0.2842 )
Estimates ( 4 )-0.526400.39500.56680-0.9999
(p-val)(0 )(NA )(6e-04 )(NA )(0.0195 )(NA )(0.0336 )
Estimates ( 5 )NANANANANANANA
(p-val)(NA )(NA )(NA )(NA )(NA )(NA )(NA )
Estimates ( 6 )NANANANANANANA
(p-val)(NA )(NA )(NA )(NA )(NA )(NA )(NA )
Estimates ( 7 )NANANANANANANA
(p-val)(NA )(NA )(NA )(NA )(NA )(NA )(NA )
Estimates ( 8 )NANANANANANANA
(p-val)(NA )(NA )(NA )(NA )(NA )(NA )(NA )
Estimates ( 9 )NANANANANANANA
(p-val)(NA )(NA )(NA )(NA )(NA )(NA )(NA )
Estimates ( 10 )NANANANANANANA
(p-val)(NA )(NA )(NA )(NA )(NA )(NA )(NA )
Estimates ( 11 )NANANANANANANA
(p-val)(NA )(NA )(NA )(NA )(NA )(NA )(NA )
Estimates ( 12 )NANANANANANANA
(p-val)(NA )(NA )(NA )(NA )(NA )(NA )(NA )
Estimates ( 13 )NANANANANANANA
(p-val)(NA )(NA )(NA )(NA )(NA )(NA )(NA )

\begin{tabular}{lllllllll}
\hline
ARIMA Parameter Estimation and Backward Selection \tabularnewline
Iteration & ar1 & ar2 & ar3 & ma1 & sar1 & sar2 & sma1 \tabularnewline
Estimates ( 1 ) & -0.3245 & 0.1171 & 0.4425 & -0.1773 & 0.4835 & -0.2175 & -1 \tabularnewline
(p-val) & (0.2524 ) & (0.5455 ) & (0.0021 ) & (0.5732 ) & (0.06 ) & (0.455 ) & (0.2222 ) \tabularnewline
Estimates ( 2 ) & -0.4577 & 0.0407 & 0.4116 & 0 & 0.4755 & -0.2622 & -0.9997 \tabularnewline
(p-val) & (0.0062 ) & (0.7994 ) & (0.0035 ) & (NA ) & (0.056 ) & (0.3346 ) & (0.2584 ) \tabularnewline
Estimates ( 3 ) & -0.4786 & 0 & 0.3926 & 0 & 0.4766 & -0.2467 & -1.0007 \tabularnewline
(p-val) & (0.0011 ) & (NA ) & (9e-04 ) & (NA ) & (0.06 ) & (0.3595 ) & (0.2842 ) \tabularnewline
Estimates ( 4 ) & -0.5264 & 0 & 0.395 & 0 & 0.5668 & 0 & -0.9999 \tabularnewline
(p-val) & (0 ) & (NA ) & (6e-04 ) & (NA ) & (0.0195 ) & (NA ) & (0.0336 ) \tabularnewline
Estimates ( 5 ) & NA & NA & NA & NA & NA & NA & NA \tabularnewline
(p-val) & (NA ) & (NA ) & (NA ) & (NA ) & (NA ) & (NA ) & (NA ) \tabularnewline
Estimates ( 6 ) & NA & NA & NA & NA & NA & NA & NA \tabularnewline
(p-val) & (NA ) & (NA ) & (NA ) & (NA ) & (NA ) & (NA ) & (NA ) \tabularnewline
Estimates ( 7 ) & NA & NA & NA & NA & NA & NA & NA \tabularnewline
(p-val) & (NA ) & (NA ) & (NA ) & (NA ) & (NA ) & (NA ) & (NA ) \tabularnewline
Estimates ( 8 ) & NA & NA & NA & NA & NA & NA & NA \tabularnewline
(p-val) & (NA ) & (NA ) & (NA ) & (NA ) & (NA ) & (NA ) & (NA ) \tabularnewline
Estimates ( 9 ) & NA & NA & NA & NA & NA & NA & NA \tabularnewline
(p-val) & (NA ) & (NA ) & (NA ) & (NA ) & (NA ) & (NA ) & (NA ) \tabularnewline
Estimates ( 10 ) & NA & NA & NA & NA & NA & NA & NA \tabularnewline
(p-val) & (NA ) & (NA ) & (NA ) & (NA ) & (NA ) & (NA ) & (NA ) \tabularnewline
Estimates ( 11 ) & NA & NA & NA & NA & NA & NA & NA \tabularnewline
(p-val) & (NA ) & (NA ) & (NA ) & (NA ) & (NA ) & (NA ) & (NA ) \tabularnewline
Estimates ( 12 ) & NA & NA & NA & NA & NA & NA & NA \tabularnewline
(p-val) & (NA ) & (NA ) & (NA ) & (NA ) & (NA ) & (NA ) & (NA ) \tabularnewline
Estimates ( 13 ) & NA & NA & NA & NA & NA & NA & NA \tabularnewline
(p-val) & (NA ) & (NA ) & (NA ) & (NA ) & (NA ) & (NA ) & (NA ) \tabularnewline
\hline
\end{tabular}
%Source: https://freestatistics.org/blog/index.php?pk=68666&T=1

[TABLE]
[ROW][C]ARIMA Parameter Estimation and Backward Selection[/C][/ROW]
[ROW][C]Iteration[/C][C]ar1[/C][C]ar2[/C][C]ar3[/C][C]ma1[/C][C]sar1[/C][C]sar2[/C][C]sma1[/C][/ROW]
[ROW][C]Estimates ( 1 )[/C][C]-0.3245[/C][C]0.1171[/C][C]0.4425[/C][C]-0.1773[/C][C]0.4835[/C][C]-0.2175[/C][C]-1[/C][/ROW]
[ROW][C](p-val)[/C][C](0.2524 )[/C][C](0.5455 )[/C][C](0.0021 )[/C][C](0.5732 )[/C][C](0.06 )[/C][C](0.455 )[/C][C](0.2222 )[/C][/ROW]
[ROW][C]Estimates ( 2 )[/C][C]-0.4577[/C][C]0.0407[/C][C]0.4116[/C][C]0[/C][C]0.4755[/C][C]-0.2622[/C][C]-0.9997[/C][/ROW]
[ROW][C](p-val)[/C][C](0.0062 )[/C][C](0.7994 )[/C][C](0.0035 )[/C][C](NA )[/C][C](0.056 )[/C][C](0.3346 )[/C][C](0.2584 )[/C][/ROW]
[ROW][C]Estimates ( 3 )[/C][C]-0.4786[/C][C]0[/C][C]0.3926[/C][C]0[/C][C]0.4766[/C][C]-0.2467[/C][C]-1.0007[/C][/ROW]
[ROW][C](p-val)[/C][C](0.0011 )[/C][C](NA )[/C][C](9e-04 )[/C][C](NA )[/C][C](0.06 )[/C][C](0.3595 )[/C][C](0.2842 )[/C][/ROW]
[ROW][C]Estimates ( 4 )[/C][C]-0.5264[/C][C]0[/C][C]0.395[/C][C]0[/C][C]0.5668[/C][C]0[/C][C]-0.9999[/C][/ROW]
[ROW][C](p-val)[/C][C](0 )[/C][C](NA )[/C][C](6e-04 )[/C][C](NA )[/C][C](0.0195 )[/C][C](NA )[/C][C](0.0336 )[/C][/ROW]
[ROW][C]Estimates ( 5 )[/C][C]NA[/C][C]NA[/C][C]NA[/C][C]NA[/C][C]NA[/C][C]NA[/C][C]NA[/C][/ROW]
[ROW][C](p-val)[/C][C](NA )[/C][C](NA )[/C][C](NA )[/C][C](NA )[/C][C](NA )[/C][C](NA )[/C][C](NA )[/C][/ROW]
[ROW][C]Estimates ( 6 )[/C][C]NA[/C][C]NA[/C][C]NA[/C][C]NA[/C][C]NA[/C][C]NA[/C][C]NA[/C][/ROW]
[ROW][C](p-val)[/C][C](NA )[/C][C](NA )[/C][C](NA )[/C][C](NA )[/C][C](NA )[/C][C](NA )[/C][C](NA )[/C][/ROW]
[ROW][C]Estimates ( 7 )[/C][C]NA[/C][C]NA[/C][C]NA[/C][C]NA[/C][C]NA[/C][C]NA[/C][C]NA[/C][/ROW]
[ROW][C](p-val)[/C][C](NA )[/C][C](NA )[/C][C](NA )[/C][C](NA )[/C][C](NA )[/C][C](NA )[/C][C](NA )[/C][/ROW]
[ROW][C]Estimates ( 8 )[/C][C]NA[/C][C]NA[/C][C]NA[/C][C]NA[/C][C]NA[/C][C]NA[/C][C]NA[/C][/ROW]
[ROW][C](p-val)[/C][C](NA )[/C][C](NA )[/C][C](NA )[/C][C](NA )[/C][C](NA )[/C][C](NA )[/C][C](NA )[/C][/ROW]
[ROW][C]Estimates ( 9 )[/C][C]NA[/C][C]NA[/C][C]NA[/C][C]NA[/C][C]NA[/C][C]NA[/C][C]NA[/C][/ROW]
[ROW][C](p-val)[/C][C](NA )[/C][C](NA )[/C][C](NA )[/C][C](NA )[/C][C](NA )[/C][C](NA )[/C][C](NA )[/C][/ROW]
[ROW][C]Estimates ( 10 )[/C][C]NA[/C][C]NA[/C][C]NA[/C][C]NA[/C][C]NA[/C][C]NA[/C][C]NA[/C][/ROW]
[ROW][C](p-val)[/C][C](NA )[/C][C](NA )[/C][C](NA )[/C][C](NA )[/C][C](NA )[/C][C](NA )[/C][C](NA )[/C][/ROW]
[ROW][C]Estimates ( 11 )[/C][C]NA[/C][C]NA[/C][C]NA[/C][C]NA[/C][C]NA[/C][C]NA[/C][C]NA[/C][/ROW]
[ROW][C](p-val)[/C][C](NA )[/C][C](NA )[/C][C](NA )[/C][C](NA )[/C][C](NA )[/C][C](NA )[/C][C](NA )[/C][/ROW]
[ROW][C]Estimates ( 12 )[/C][C]NA[/C][C]NA[/C][C]NA[/C][C]NA[/C][C]NA[/C][C]NA[/C][C]NA[/C][/ROW]
[ROW][C](p-val)[/C][C](NA )[/C][C](NA )[/C][C](NA )[/C][C](NA )[/C][C](NA )[/C][C](NA )[/C][C](NA )[/C][/ROW]
[ROW][C]Estimates ( 13 )[/C][C]NA[/C][C]NA[/C][C]NA[/C][C]NA[/C][C]NA[/C][C]NA[/C][C]NA[/C][/ROW]
[ROW][C](p-val)[/C][C](NA )[/C][C](NA )[/C][C](NA )[/C][C](NA )[/C][C](NA )[/C][C](NA )[/C][C](NA )[/C][/ROW]
[/TABLE]
Source: https://freestatistics.org/blog/index.php?pk=68666&T=1

Globally Unique Identifier (entire table): ba.freestatistics.org/blog/index.php?pk=68666&T=1

As an alternative you can also use a QR Code:  

The GUIDs for individual cells are displayed in the table below:

ARIMA Parameter Estimation and Backward Selection
Iterationar1ar2ar3ma1sar1sar2sma1
Estimates ( 1 )-0.32450.11710.4425-0.17730.4835-0.2175-1
(p-val)(0.2524 )(0.5455 )(0.0021 )(0.5732 )(0.06 )(0.455 )(0.2222 )
Estimates ( 2 )-0.45770.04070.411600.4755-0.2622-0.9997
(p-val)(0.0062 )(0.7994 )(0.0035 )(NA )(0.056 )(0.3346 )(0.2584 )
Estimates ( 3 )-0.478600.392600.4766-0.2467-1.0007
(p-val)(0.0011 )(NA )(9e-04 )(NA )(0.06 )(0.3595 )(0.2842 )
Estimates ( 4 )-0.526400.39500.56680-0.9999
(p-val)(0 )(NA )(6e-04 )(NA )(0.0195 )(NA )(0.0336 )
Estimates ( 5 )NANANANANANANA
(p-val)(NA )(NA )(NA )(NA )(NA )(NA )(NA )
Estimates ( 6 )NANANANANANANA
(p-val)(NA )(NA )(NA )(NA )(NA )(NA )(NA )
Estimates ( 7 )NANANANANANANA
(p-val)(NA )(NA )(NA )(NA )(NA )(NA )(NA )
Estimates ( 8 )NANANANANANANA
(p-val)(NA )(NA )(NA )(NA )(NA )(NA )(NA )
Estimates ( 9 )NANANANANANANA
(p-val)(NA )(NA )(NA )(NA )(NA )(NA )(NA )
Estimates ( 10 )NANANANANANANA
(p-val)(NA )(NA )(NA )(NA )(NA )(NA )(NA )
Estimates ( 11 )NANANANANANANA
(p-val)(NA )(NA )(NA )(NA )(NA )(NA )(NA )
Estimates ( 12 )NANANANANANANA
(p-val)(NA )(NA )(NA )(NA )(NA )(NA )(NA )
Estimates ( 13 )NANANANANANANA
(p-val)(NA )(NA )(NA )(NA )(NA )(NA )(NA )


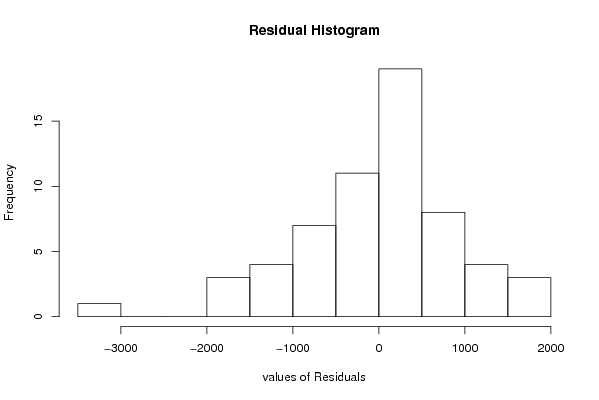
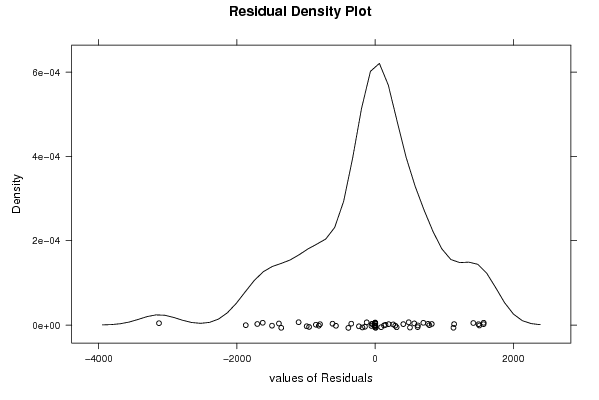
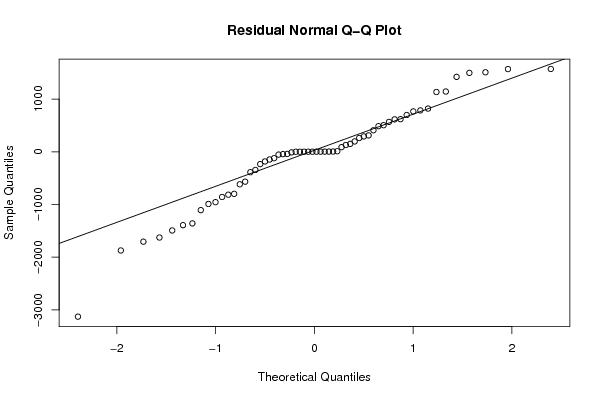
Estimated ARIMA Residuals
Value
-53.691041642481
-956.038737741658
784.966813979029
261.08812454808
504.250400635337
-797.549006897268
615.159153830158
-1872.01800710714
1420.84015255526
87.576148172622
485.673427592755
-1107.28368813339
-345.063542981823
1142.75728215268
-146.991582176823
-1492.53933929314
566.069713036562
617.987379765858
-41.211672989147
-234.233128414752
-44.4048382381846
407.973764927968
697.71363227073
196.201588248311
-1358.69568887242
765.861533747486
-183.725630206960
-566.871972815612
819.532899116255
1496.40772202339
-1705.10509868898
1507.91807803124
-387.318220243987
1133.71012596957
-814.291409467433
-1391.85212039824
291.140250371666
-857.681186318743
-3127.48505446733
-1626.58088736611
-990.248073454437
310.879970504109
150.332098332375
-616.639440417395
-121.940328000835
128.564991754316
1568.86937222919
1571.00397584026

\begin{tabular}{lllllllll}
\hline
Estimated ARIMA Residuals \tabularnewline
Value \tabularnewline
-53.691041642481 \tabularnewline
-956.038737741658 \tabularnewline
784.966813979029 \tabularnewline
261.08812454808 \tabularnewline
504.250400635337 \tabularnewline
-797.549006897268 \tabularnewline
615.159153830158 \tabularnewline
-1872.01800710714 \tabularnewline
1420.84015255526 \tabularnewline
87.576148172622 \tabularnewline
485.673427592755 \tabularnewline
-1107.28368813339 \tabularnewline
-345.063542981823 \tabularnewline
1142.75728215268 \tabularnewline
-146.991582176823 \tabularnewline
-1492.53933929314 \tabularnewline
566.069713036562 \tabularnewline
617.987379765858 \tabularnewline
-41.211672989147 \tabularnewline
-234.233128414752 \tabularnewline
-44.4048382381846 \tabularnewline
407.973764927968 \tabularnewline
697.71363227073 \tabularnewline
196.201588248311 \tabularnewline
-1358.69568887242 \tabularnewline
765.861533747486 \tabularnewline
-183.725630206960 \tabularnewline
-566.871972815612 \tabularnewline
819.532899116255 \tabularnewline
1496.40772202339 \tabularnewline
-1705.10509868898 \tabularnewline
1507.91807803124 \tabularnewline
-387.318220243987 \tabularnewline
1133.71012596957 \tabularnewline
-814.291409467433 \tabularnewline
-1391.85212039824 \tabularnewline
291.140250371666 \tabularnewline
-857.681186318743 \tabularnewline
-3127.48505446733 \tabularnewline
-1626.58088736611 \tabularnewline
-990.248073454437 \tabularnewline
310.879970504109 \tabularnewline
150.332098332375 \tabularnewline
-616.639440417395 \tabularnewline
-121.940328000835 \tabularnewline
128.564991754316 \tabularnewline
1568.86937222919 \tabularnewline
1571.00397584026 \tabularnewline
\hline
\end{tabular}
%Source: https://freestatistics.org/blog/index.php?pk=68666&T=2

[TABLE]
[ROW][C]Estimated ARIMA Residuals[/C][/ROW]
[ROW][C]Value[/C][/ROW]
[ROW][C]-53.691041642481[/C][/ROW]
[ROW][C]-956.038737741658[/C][/ROW]
[ROW][C]784.966813979029[/C][/ROW]
[ROW][C]261.08812454808[/C][/ROW]
[ROW][C]504.250400635337[/C][/ROW]
[ROW][C]-797.549006897268[/C][/ROW]
[ROW][C]615.159153830158[/C][/ROW]
[ROW][C]-1872.01800710714[/C][/ROW]
[ROW][C]1420.84015255526[/C][/ROW]
[ROW][C]87.576148172622[/C][/ROW]
[ROW][C]485.673427592755[/C][/ROW]
[ROW][C]-1107.28368813339[/C][/ROW]
[ROW][C]-345.063542981823[/C][/ROW]
[ROW][C]1142.75728215268[/C][/ROW]
[ROW][C]-146.991582176823[/C][/ROW]
[ROW][C]-1492.53933929314[/C][/ROW]
[ROW][C]566.069713036562[/C][/ROW]
[ROW][C]617.987379765858[/C][/ROW]
[ROW][C]-41.211672989147[/C][/ROW]
[ROW][C]-234.233128414752[/C][/ROW]
[ROW][C]-44.4048382381846[/C][/ROW]
[ROW][C]407.973764927968[/C][/ROW]
[ROW][C]697.71363227073[/C][/ROW]
[ROW][C]196.201588248311[/C][/ROW]
[ROW][C]-1358.69568887242[/C][/ROW]
[ROW][C]765.861533747486[/C][/ROW]
[ROW][C]-183.725630206960[/C][/ROW]
[ROW][C]-566.871972815612[/C][/ROW]
[ROW][C]819.532899116255[/C][/ROW]
[ROW][C]1496.40772202339[/C][/ROW]
[ROW][C]-1705.10509868898[/C][/ROW]
[ROW][C]1507.91807803124[/C][/ROW]
[ROW][C]-387.318220243987[/C][/ROW]
[ROW][C]1133.71012596957[/C][/ROW]
[ROW][C]-814.291409467433[/C][/ROW]
[ROW][C]-1391.85212039824[/C][/ROW]
[ROW][C]291.140250371666[/C][/ROW]
[ROW][C]-857.681186318743[/C][/ROW]
[ROW][C]-3127.48505446733[/C][/ROW]
[ROW][C]-1626.58088736611[/C][/ROW]
[ROW][C]-990.248073454437[/C][/ROW]
[ROW][C]310.879970504109[/C][/ROW]
[ROW][C]150.332098332375[/C][/ROW]
[ROW][C]-616.639440417395[/C][/ROW]
[ROW][C]-121.940328000835[/C][/ROW]
[ROW][C]128.564991754316[/C][/ROW]
[ROW][C]1568.86937222919[/C][/ROW]
[ROW][C]1571.00397584026[/C][/ROW]
[/TABLE]
Source: https://freestatistics.org/blog/index.php?pk=68666&T=2

Globally Unique Identifier (entire table): ba.freestatistics.org/blog/index.php?pk=68666&T=2

As an alternative you can also use a QR Code:  

The GUIDs for individual cells are displayed in the table below:

Estimated ARIMA Residuals
Value
-53.691041642481
-956.038737741658
784.966813979029
261.08812454808
504.250400635337
-797.549006897268
615.159153830158
-1872.01800710714
1420.84015255526
87.576148172622
485.673427592755
-1107.28368813339
-345.063542981823
1142.75728215268
-146.991582176823
-1492.53933929314
566.069713036562
617.987379765858
-41.211672989147
-234.233128414752
-44.4048382381846
407.973764927968
697.71363227073
196.201588248311
-1358.69568887242
765.861533747486
-183.725630206960
-566.871972815612
819.532899116255
1496.40772202339
-1705.10509868898
1507.91807803124
-387.318220243987
1133.71012596957
-814.291409467433
-1391.85212039824
291.140250371666
-857.681186318743
-3127.48505446733
-1626.58088736611
-990.248073454437
310.879970504109
150.332098332375
-616.639440417395
-121.940328000835
128.564991754316
1568.86937222919
1571.00397584026


Parameters (Session):
par1 = FALSE ; par2 = 1 ; par3 = 1 ; par4 = 1 ; par5 = 12 ; par6 = 3 ; par7 = 1 ; par8 = 2 ; par9 = 1 ;
Parameters (R input):
par1 = FALSE ; par2 = 1 ; par3 = 1 ; par4 = 1 ; par5 = 12 ; par6 = 3 ; par7 = 1 ; par8 = 2 ; par9 = 1 ;
R code (references can be found in the software module):
library(lattice)
if (par1 == 'TRUE') par1 <- TRUE
if (par1 == 'FALSE') par1 <- FALSE
par2 <- as.numeric(par2) #Box-Cox lambda transformation parameter
par3 <- as.numeric(par3) #degree of non-seasonal differencing
par4 <- as.numeric(par4) #degree of seasonal differencing
par5 <- as.numeric(par5) #seasonal period
par6 <- as.numeric(par6) #degree (p) of the non-seasonal AR(p) polynomial
par7 <- as.numeric(par7) #degree (q) of the non-seasonal MA(q) polynomial
par8 <- as.numeric(par8) #degree (P) of the seasonal AR(P) polynomial
par9 <- as.numeric(par9) #degree (Q) of the seasonal MA(Q) polynomial
armaGR <- function(arima.out, names, n){
try1 <- arima.out$coef
try2 <- sqrt(diag(arima.out$var.coef))
try.data.frame <- data.frame(matrix(NA,ncol=4,nrow=length(names)))
dimnames(try.data.frame) <- list(names,c('coef','std','tstat','pv'))
try.data.frame[,1] <- try1
for(i in 1:length(try2)) try.data.frame[which(rownames(try.data.frame)==names(try2)[i]),2] <- try2[i]
try.data.frame[,3] <- try.data.frame[,1] / try.data.frame[,2]
try.data.frame[,4] <- round((1-pt(abs(try.data.frame[,3]),df=n-(length(try2)+1)))*2,5)
vector <- rep(NA,length(names))
vector[is.na(try.data.frame[,4])] <- 0
maxi <- which.max(try.data.frame[,4])
continue <- max(try.data.frame[,4],na.rm=TRUE) > .05
vector[maxi] <- 0
list(summary=try.data.frame,next.vector=vector,continue=continue)
}
arimaSelect <- function(series, order=c(13,0,0), seasonal=list(order=c(2,0,0),period=12), include.mean=F){
nrc <- order[1]+order[3]+seasonal$order[1]+seasonal$order[3]
coeff <- matrix(NA, nrow=nrc*2, ncol=nrc)
pval <- matrix(NA, nrow=nrc*2, ncol=nrc)
mylist <- rep(list(NULL), nrc)
names <- NULL
if(order[1] > 0) names <- paste('ar',1:order[1],sep='')
if(order[3] > 0) names <- c( names , paste('ma',1:order[3],sep='') )
if(seasonal$order[1] > 0) names <- c(names, paste('sar',1:seasonal$order[1],sep=''))
if(seasonal$order[3] > 0) names <- c(names, paste('sma',1:seasonal$order[3],sep=''))
arima.out <- arima(series, order=order, seasonal=seasonal, include.mean=include.mean, method='ML')
mylist[[1]] <- arima.out
last.arma <- armaGR(arima.out, names, length(series))
mystop <- FALSE
i <- 1
coeff[i,] <- last.arma[[1]][,1]
pval [i,] <- last.arma[[1]][,4]
i <- 2
aic <- arima.out$aic
while(!mystop){
mylist[[i]] <- arima.out
arima.out <- arima(series, order=order, seasonal=seasonal, include.mean=include.mean, method='ML', fixed=last.arma$next.vector)
aic <- c(aic, arima.out$aic)
last.arma <- armaGR(arima.out, names, length(series))
mystop <- !last.arma$continue
coeff[i,] <- last.arma[[1]][,1]
pval [i,] <- last.arma[[1]][,4]
i <- i+1
}
list(coeff, pval, mylist, aic=aic)
}
arimaSelectplot <- function(arimaSelect.out,noms,choix){
noms <- names(arimaSelect.out[[3]][[1]]$coef)
coeff <- arimaSelect.out[[1]]
k <- min(which(is.na(coeff[,1])))-1
coeff <- coeff[1:k,]
pval <- arimaSelect.out[[2]][1:k,]
aic <- arimaSelect.out$aic[1:k]
coeff[coeff==0] <- NA
n <- ncol(coeff)
if(missing(choix)) choix <- k
layout(matrix(c(1,1,1,2,
3,3,3,2,
3,3,3,4,
5,6,7,7),nr=4),
widths=c(10,35,45,15),
heights=c(30,30,15,15))
couleurs <- rainbow(75)[1:50]#(50)
ticks <- pretty(coeff)
par(mar=c(1,1,3,1))
plot(aic,k:1-.5,type='o',pch=21,bg='blue',cex=2,axes=F,lty=2,xpd=NA)
points(aic[choix],k-choix+.5,pch=21,cex=4,bg=2,xpd=NA)
title('aic',line=2)
par(mar=c(3,0,0,0))
plot(0,axes=F,xlab='',ylab='',xlim=range(ticks),ylim=c(.1,1))
rect(xleft = min(ticks) + (0:49)/50*(max(ticks)-min(ticks)),
xright = min(ticks) + (1:50)/50*(max(ticks)-min(ticks)),
ytop = rep(1,50),
ybottom= rep(0,50),col=couleurs,border=NA)
axis(1,ticks)
rect(xleft=min(ticks),xright=max(ticks),ytop=1,ybottom=0)
text(mean(coeff,na.rm=T),.5,'coefficients',cex=2,font=2)
par(mar=c(1,1,3,1))
image(1:n,1:k,t(coeff[k:1,]),axes=F,col=couleurs,zlim=range(ticks))
for(i in 1:n) for(j in 1:k) if(!is.na(coeff[j,i])) {
if(pval[j,i]<.01) symb = 'green'
else if( (pval[j,i]<.05) & (pval[j,i]>=.01)) symb = 'orange'
else if( (pval[j,i]<.1) & (pval[j,i]>=.05)) symb = 'red'
else symb = 'black'
polygon(c(i+.5 ,i+.2 ,i+.5 ,i+.5),
c(k-j+0.5,k-j+0.5,k-j+0.8,k-j+0.5),
col=symb)
if(j==choix) {
rect(xleft=i-.5,
xright=i+.5,
ybottom=k-j+1.5,
ytop=k-j+.5,
lwd=4)
text(i,
k-j+1,
round(coeff[j,i],2),
cex=1.2,
font=2)
}
else{
rect(xleft=i-.5,xright=i+.5,ybottom=k-j+1.5,ytop=k-j+.5)
text(i,k-j+1,round(coeff[j,i],2),cex=1.2,font=1)
}
}
axis(3,1:n,noms)
par(mar=c(0.5,0,0,0.5))
plot(0,axes=F,xlab='',ylab='',type='n',xlim=c(0,8),ylim=c(-.2,.8))
cols <- c('green','orange','red','black')
niv <- c('0','0.01','0.05','0.1')
for(i in 0:3){
polygon(c(1+2*i ,1+2*i ,1+2*i-.5 ,1+2*i),
c(.4 ,.7 , .4 , .4),
col=cols[i+1])
text(2*i,0.5,niv[i+1],cex=1.5)
}
text(8,.5,1,cex=1.5)
text(4,0,'p-value',cex=2)
box()
residus <- arimaSelect.out[[3]][[choix]]$res
par(mar=c(1,2,4,1))
acf(residus,main='')
title('acf',line=.5)
par(mar=c(1,2,4,1))
pacf(residus,main='')
title('pacf',line=.5)
par(mar=c(2,2,4,1))
qqnorm(residus,main='')
title('qq-norm',line=.5)
qqline(residus)
residus
}
if (par2 == 0) x <- log(x)
if (par2 != 0) x <- x^par2
(selection <- arimaSelect(x, order=c(par6,par3,par7), seasonal=list(order=c(par8,par4,par9), period=par5)))
bitmap(file='test1.png')
resid <- arimaSelectplot(selection)
dev.off()
resid
bitmap(file='test2.png')
acf(resid,length(resid)/2, main='Residual Autocorrelation Function')
dev.off()
bitmap(file='test3.png')
pacf(resid,length(resid)/2, main='Residual Partial Autocorrelation Function')
dev.off()
bitmap(file='test4.png')
cpgram(resid, main='Residual Cumulative Periodogram')
dev.off()
bitmap(file='test5.png')
hist(resid, main='Residual Histogram', xlab='values of Residuals')
dev.off()
bitmap(file='test6.png')
densityplot(~resid,col='black',main='Residual Density Plot', xlab='values of Residuals')
dev.off()
bitmap(file='test7.png')
qqnorm(resid, main='Residual Normal Q-Q Plot')
qqline(resid)
dev.off()
ncols <- length(selection[[1]][1,])
nrows <- length(selection[[2]][,1])-1
load(file='createtable')
a<-table.start()
a<-table.row.start(a)
a<-table.element(a,'ARIMA Parameter Estimation and Backward Selection', ncols+1,TRUE)
a<-table.row.end(a)
a<-table.row.start(a)
a<-table.element(a,'Iteration', header=TRUE)
for (i in 1:ncols) {
a<-table.element(a,names(selection[[3]][[1]]$coef)[i],header=TRUE)
}
a<-table.row.end(a)
for (j in 1:nrows) {
a<-table.row.start(a)
mydum <- 'Estimates ('
mydum <- paste(mydum,j)
mydum <- paste(mydum,')')
a<-table.element(a,mydum, header=TRUE)
for (i in 1:ncols) {
a<-table.element(a,round(selection[[1]][j,i],4))
}
a<-table.row.end(a)
a<-table.row.start(a)
a<-table.element(a,'(p-val)', header=TRUE)
for (i in 1:ncols) {
mydum <- '('
mydum <- paste(mydum,round(selection[[2]][j,i],4),sep='')
mydum <- paste(mydum,')')
a<-table.element(a,mydum)
}
a<-table.row.end(a)
}
a<-table.end(a)
table.save(a,file='mytable.tab')
a<-table.start()
a<-table.row.start(a)
a<-table.element(a,'Estimated ARIMA Residuals', 1,TRUE)
a<-table.row.end(a)
a<-table.row.start(a)
a<-table.element(a,'Value', 1,TRUE)
a<-table.row.end(a)
for (i in (par4*par5+par3):length(resid)) {
a<-table.row.start(a)
a<-table.element(a,resid[i])
a<-table.row.end(a)
}
a<-table.end(a)
table.save(a,file='mytable1.tab')