Free Statistics
of Irreproducible Research!
Description of Statistical Computation | |||||||||||||||||||||||||||||||||||||||||||||||||||||||||||||||||||||
|---|---|---|---|---|---|---|---|---|---|---|---|---|---|---|---|---|---|---|---|---|---|---|---|---|---|---|---|---|---|---|---|---|---|---|---|---|---|---|---|---|---|---|---|---|---|---|---|---|---|---|---|---|---|---|---|---|---|---|---|---|---|---|---|---|---|---|---|---|---|
| Author's title | |||||||||||||||||||||||||||||||||||||||||||||||||||||||||||||||||||||
| Author | *The author of this computation has been verified* | ||||||||||||||||||||||||||||||||||||||||||||||||||||||||||||||||||||
| R Software Module | rwasp_pairs.wasp | ||||||||||||||||||||||||||||||||||||||||||||||||||||||||||||||||||||
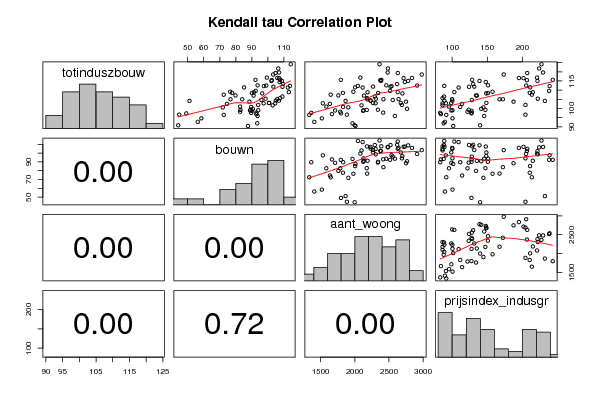
| Title produced by software | Kendall tau Correlation Matrix | ||||||||||||||||||||||||||||||||||||||||||||||||||||||||||||||||||||
| Date of computation | Thu, 17 Dec 2009 03:06:10 -0700 | ||||||||||||||||||||||||||||||||||||||||||||||||||||||||||||||||||||
| Cite this page as follows | Statistical Computations at FreeStatistics.org, Office for Research Development and Education, URL https://freestatistics.org/blog/index.php?v=date/2009/Dec/17/t12610444300e8i6ikypuod02p.htm/, Retrieved Tue, 30 Apr 2024 07:35:29 +0000 | ||||||||||||||||||||||||||||||||||||||||||||||||||||||||||||||||||||
| Statistical Computations at FreeStatistics.org, Office for Research Development and Education, URL https://freestatistics.org/blog/index.php?pk=68689, Retrieved Tue, 30 Apr 2024 07:35:29 +0000 | |||||||||||||||||||||||||||||||||||||||||||||||||||||||||||||||||||||
| QR Codes: | |||||||||||||||||||||||||||||||||||||||||||||||||||||||||||||||||||||
|
| |||||||||||||||||||||||||||||||||||||||||||||||||||||||||||||||||||||
| Original text written by user: | |||||||||||||||||||||||||||||||||||||||||||||||||||||||||||||||||||||
| IsPrivate? | No (this computation is public) | ||||||||||||||||||||||||||||||||||||||||||||||||||||||||||||||||||||
| User-defined keywords | |||||||||||||||||||||||||||||||||||||||||||||||||||||||||||||||||||||
| Estimated Impact | 147 | ||||||||||||||||||||||||||||||||||||||||||||||||||||||||||||||||||||
Tree of Dependent Computations | |||||||||||||||||||||||||||||||||||||||||||||||||||||||||||||||||||||
| Family? (F = Feedback message, R = changed R code, M = changed R Module, P = changed Parameters, D = changed Data) | |||||||||||||||||||||||||||||||||||||||||||||||||||||||||||||||||||||
| - [Kendall tau Correlation Matrix] [3/11/2009] [2009-11-02 21:25:00] [b98453cac15ba1066b407e146608df68] - D [Kendall tau Correlation Matrix] [Kendall tau corre...] [2009-12-17 10:06:10] [b1ac221d009d6e5c29a4ef1869874933] [Current] | |||||||||||||||||||||||||||||||||||||||||||||||||||||||||||||||||||||
| Feedback Forum | |||||||||||||||||||||||||||||||||||||||||||||||||||||||||||||||||||||
Post a new message | |||||||||||||||||||||||||||||||||||||||||||||||||||||||||||||||||||||
Dataset | |||||||||||||||||||||||||||||||||||||||||||||||||||||||||||||||||||||
| Dataseries X: | |||||||||||||||||||||||||||||||||||||||||||||||||||||||||||||||||||||
97.6 89.6 1363 82.9 96.9 92.8 1664 83.8 105.6 107.6 2179 86.2 102.8 104.6 2305 86.1 101.7 103 2098 86.2 104.2 106.9 2231 88.8 92.7 56.3 1407 89.6 91.9 93.4 1966 87.8 106.5 109.1 2293 88.3 112.3 113.8 2045 88.6 102.8 97.4 1532 91 96.5 72.5 1333 91.5 101 82.7 1583 95.4 98.9 88.9 1712 98.7 105.1 105.9 2641 99.9 103 100.8 2267 98.6 99 94 2126 100.3 104.3 105 2231 100.2 94.6 58.5 1517 100.4 90.4 87.6 2010 101.4 108.9 113.1 2628 103 111.4 112.5 2115 109.1 100.8 89.6 1829 111.4 102.5 74.5 1636 114.1 98.2 82.7 1787 121.8 98.7 90.1 2122 127.6 113.3 109.4 2620 129.9 104.6 96 2555 128 99.3 89.2 2338 123.5 111.8 109.1 2523 124 97.3 49.1 1798 127.4 97.7 92.9 2415 127.6 115.6 107.7 2388 128.4 111.9 103.5 2267 131.4 107 91.1 2134 135.1 107.1 79.8 1759 134 100.6 71.9 1905 144.5 99.2 82.9 2175 147.3 108.4 90.1 2341 150.9 103 100.7 2673 148.7 99.8 90.7 2765 141.4 115 108.8 2781 138.9 90.8 44.1 1998 139.8 95.9 93.6 2587 145.6 114.4 107.4 2732 147.9 108.2 96.5 2696 148.5 112.6 93.6 2461 151.1 109.1 76.5 1979 157.5 105 76.7 2181 167.5 105 84 2419 172.3 118.5 103.3 2980 173.5 103.7 88.5 2750 187.5 112.5 99 2913 205.5 116.6 105.9 2838 195.1 96.6 44.7 1884 204.5 101.9 94 2690 204.5 116.5 107.1 2715 201.7 119.3 104.8 2629 207 115.4 102.5 2373 206.6 108.5 77.7 1827 210.6 111.5 85.2 2004 211.1 108.8 91.3 2187 215 121.8 106.5 2485 223.9 109.6 92.4 2517 238.2 112.2 97.5 2538 238.9 119.6 107 2481 229.6 104.1 51.1 1865 232.2 105.3 98.6 2307 222.1 115 102.2 2383 221.6 124.1 114.3 2362 227.3 116.8 99.4 2081 221 107.5 72.5 1648 213.6 115.6 92.3 1795 243.4 | |||||||||||||||||||||||||||||||||||||||||||||||||||||||||||||||||||||
Tables (Output of Computation) | |||||||||||||||||||||||||||||||||||||||||||||||||||||||||||||||||||||
| |||||||||||||||||||||||||||||||||||||||||||||||||||||||||||||||||||||
Figures (Output of Computation) | |||||||||||||||||||||||||||||||||||||||||||||||||||||||||||||||||||||
Input Parameters & R Code | |||||||||||||||||||||||||||||||||||||||||||||||||||||||||||||||||||||
| Parameters (Session): | |||||||||||||||||||||||||||||||||||||||||||||||||||||||||||||||||||||
| Parameters (R input): | |||||||||||||||||||||||||||||||||||||||||||||||||||||||||||||||||||||
| R code (references can be found in the software module): | |||||||||||||||||||||||||||||||||||||||||||||||||||||||||||||||||||||
panel.tau <- function(x, y, digits=2, prefix='', cex.cor) | |||||||||||||||||||||||||||||||||||||||||||||||||||||||||||||||||||||