Free Statistics

of Irreproducible Research!

Author's title

Author*The author of this computation has been verified*
R Software Modulerwasp_autocorrelation.wasp
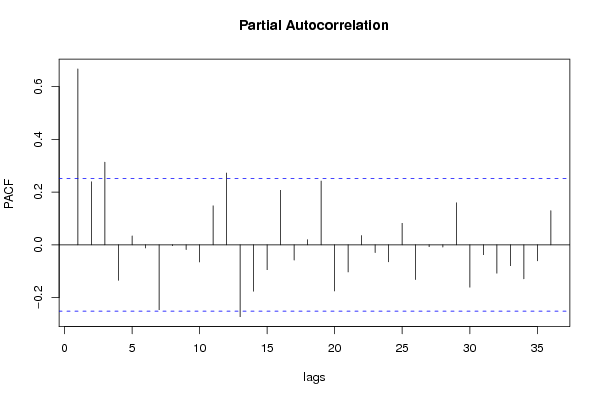
Title produced by software(Partial) Autocorrelation Function
Date of computationThu, 17 Dec 2009 03:41:38 -0700
Cite this page as followsStatistical Computations at FreeStatistics.org, Office for Research Development and Education, URL https://freestatistics.org/blog/index.php?v=date/2009/Dec/17/t1261046564k2d11pqh7di54vt.htm/, Retrieved Tue, 30 Apr 2024 00:26:24 +0000
Statistical Computations at FreeStatistics.org, Office for Research Development and Education, URL https://freestatistics.org/blog/index.php?pk=68705, Retrieved Tue, 30 Apr 2024 00:26:24 +0000
QR Codes:

Original text written by user:
IsPrivate?No (this computation is public)
User-defined keywordsshwpaper11
Estimated Impact127
Family? (F = Feedback message, R = changed R code, M = changed R Module, P = changed Parameters, D = changed Data)
-       [(Partial) Autocorrelation Function] [] [2009-12-17 10:41:38] [4407d6264e55b051ec65750e6dca2820] [Current]
-    D    [(Partial) Autocorrelation Function] [] [2010-12-25 05:18:47] [6e5489189f7de5cfbcc25dd35ae15009]
Feedback Forum

Post a new message
Dataseries X:
14497
14398.3
16629.6
16670.7
16614.8
16869.2
15663.9
16359.9
18447.7
16889
16505
18320.9
15052.1
15699.8
18135.3
16768.7
18883
19021
18101.9
17776.1
21489.9
17065.3
18690
18953.1
16398.9
16895.6
18553
19270
19422.1
17579.4
18637.3
18076.7
20438.6
18075.2
19563
19899.2
19227.5
17789.6
19220.8
21968.9
21131.5
19484.6
22168.7
20866.8
22176.2
23533.8
21479.6
24347.7
22751.6
20328.3
23650.4
23335.7
19614.9
18042.3
17282.5
16847.2
18159.5
16540.9
15952.7
18357.8
16394.3


Summary of computational transaction
Raw Inputview raw input (R code)
Raw Outputview raw output of R engine
Computing time1 seconds
R Server'Gwilym Jenkins' @ 72.249.127.135

\begin{tabular}{lllllllll}
\hline
Summary of computational transaction \tabularnewline
Raw Input & view raw input (R code)  \tabularnewline
Raw Output & view raw output of R engine  \tabularnewline
Computing time & 1 seconds \tabularnewline
R Server & 'Gwilym Jenkins' @ 72.249.127.135 \tabularnewline
\hline
\end{tabular}
%Source: https://freestatistics.org/blog/index.php?pk=68705&T=0

[TABLE]
[ROW][C]Summary of computational transaction[/C][/ROW]
[ROW][C]Raw Input[/C][C]view raw input (R code) [/C][/ROW]
[ROW][C]Raw Output[/C][C]view raw output of R engine [/C][/ROW]
[ROW][C]Computing time[/C][C]1 seconds[/C][/ROW]
[ROW][C]R Server[/C][C]'Gwilym Jenkins' @ 72.249.127.135[/C][/ROW]
[/TABLE]
Source: https://freestatistics.org/blog/index.php?pk=68705&T=0

Globally Unique Identifier (entire table): ba.freestatistics.org/blog/index.php?pk=68705&T=0

As an alternative you can also use a QR Code:  

The GUIDs for individual cells are displayed in the table below:

Summary of computational transaction
Raw Inputview raw input (R code)
Raw Outputview raw output of R engine
Computing time1 seconds
R Server'Gwilym Jenkins' @ 72.249.127.135


Autocorrelation Function
Time lag kACF(k)T-STATP-value
10.6672765.21161e-06
20.5780234.51451.5e-05
30.6171334.825e-06
40.4591663.58620.000334
50.4148563.24010.000968
60.3923773.06460.001622
70.2001721.56340.061567
80.1741411.36010.089404
90.1499521.17120.123044
100.0200190.15640.438137
110.071020.55470.29057
120.1601691.2510.107863
13-0.037044-0.28930.386658
14-0.064428-0.50320.308318
15-0.048137-0.3760.354126
16-0.052822-0.41260.340689
17-0.050631-0.39540.346948
18-0.054879-0.42860.334854
19-0.041639-0.32520.373066
20-0.073304-0.57250.284537
21-0.075316-0.58820.279271
22-0.056777-0.44340.329508
23-0.05017-0.39180.348271
24-0.000941-0.00730.497081
25-0.039193-0.30610.380283
26-0.157925-1.23340.111073
27-0.107834-0.84220.201481
28-0.064581-0.50440.307901
29-0.104055-0.81270.209777
30-0.111076-0.86750.194526
31-0.08438-0.6590.256178
32-0.202302-1.580.059636
33-0.187008-1.46060.074632
34-0.190879-1.49080.070582
35-0.264733-2.06760.021462
36-0.205441-1.60450.05688

\begin{tabular}{lllllllll}
\hline
Autocorrelation Function \tabularnewline
Time lag k & ACF(k) & T-STAT & P-value \tabularnewline
1 & 0.667276 & 5.2116 & 1e-06 \tabularnewline
2 & 0.578023 & 4.5145 & 1.5e-05 \tabularnewline
3 & 0.617133 & 4.82 & 5e-06 \tabularnewline
4 & 0.459166 & 3.5862 & 0.000334 \tabularnewline
5 & 0.414856 & 3.2401 & 0.000968 \tabularnewline
6 & 0.392377 & 3.0646 & 0.001622 \tabularnewline
7 & 0.200172 & 1.5634 & 0.061567 \tabularnewline
8 & 0.174141 & 1.3601 & 0.089404 \tabularnewline
9 & 0.149952 & 1.1712 & 0.123044 \tabularnewline
10 & 0.020019 & 0.1564 & 0.438137 \tabularnewline
11 & 0.07102 & 0.5547 & 0.29057 \tabularnewline
12 & 0.160169 & 1.251 & 0.107863 \tabularnewline
13 & -0.037044 & -0.2893 & 0.386658 \tabularnewline
14 & -0.064428 & -0.5032 & 0.308318 \tabularnewline
15 & -0.048137 & -0.376 & 0.354126 \tabularnewline
16 & -0.052822 & -0.4126 & 0.340689 \tabularnewline
17 & -0.050631 & -0.3954 & 0.346948 \tabularnewline
18 & -0.054879 & -0.4286 & 0.334854 \tabularnewline
19 & -0.041639 & -0.3252 & 0.373066 \tabularnewline
20 & -0.073304 & -0.5725 & 0.284537 \tabularnewline
21 & -0.075316 & -0.5882 & 0.279271 \tabularnewline
22 & -0.056777 & -0.4434 & 0.329508 \tabularnewline
23 & -0.05017 & -0.3918 & 0.348271 \tabularnewline
24 & -0.000941 & -0.0073 & 0.497081 \tabularnewline
25 & -0.039193 & -0.3061 & 0.380283 \tabularnewline
26 & -0.157925 & -1.2334 & 0.111073 \tabularnewline
27 & -0.107834 & -0.8422 & 0.201481 \tabularnewline
28 & -0.064581 & -0.5044 & 0.307901 \tabularnewline
29 & -0.104055 & -0.8127 & 0.209777 \tabularnewline
30 & -0.111076 & -0.8675 & 0.194526 \tabularnewline
31 & -0.08438 & -0.659 & 0.256178 \tabularnewline
32 & -0.202302 & -1.58 & 0.059636 \tabularnewline
33 & -0.187008 & -1.4606 & 0.074632 \tabularnewline
34 & -0.190879 & -1.4908 & 0.070582 \tabularnewline
35 & -0.264733 & -2.0676 & 0.021462 \tabularnewline
36 & -0.205441 & -1.6045 & 0.05688 \tabularnewline
\hline
\end{tabular}
%Source: https://freestatistics.org/blog/index.php?pk=68705&T=1

[TABLE]
[ROW][C]Autocorrelation Function[/C][/ROW]
[ROW][C]Time lag k[/C][C]ACF(k)[/C][C]T-STAT[/C][C]P-value[/C][/ROW]
[ROW][C]1[/C][C]0.667276[/C][C]5.2116[/C][C]1e-06[/C][/ROW]
[ROW][C]2[/C][C]0.578023[/C][C]4.5145[/C][C]1.5e-05[/C][/ROW]
[ROW][C]3[/C][C]0.617133[/C][C]4.82[/C][C]5e-06[/C][/ROW]
[ROW][C]4[/C][C]0.459166[/C][C]3.5862[/C][C]0.000334[/C][/ROW]
[ROW][C]5[/C][C]0.414856[/C][C]3.2401[/C][C]0.000968[/C][/ROW]
[ROW][C]6[/C][C]0.392377[/C][C]3.0646[/C][C]0.001622[/C][/ROW]
[ROW][C]7[/C][C]0.200172[/C][C]1.5634[/C][C]0.061567[/C][/ROW]
[ROW][C]8[/C][C]0.174141[/C][C]1.3601[/C][C]0.089404[/C][/ROW]
[ROW][C]9[/C][C]0.149952[/C][C]1.1712[/C][C]0.123044[/C][/ROW]
[ROW][C]10[/C][C]0.020019[/C][C]0.1564[/C][C]0.438137[/C][/ROW]
[ROW][C]11[/C][C]0.07102[/C][C]0.5547[/C][C]0.29057[/C][/ROW]
[ROW][C]12[/C][C]0.160169[/C][C]1.251[/C][C]0.107863[/C][/ROW]
[ROW][C]13[/C][C]-0.037044[/C][C]-0.2893[/C][C]0.386658[/C][/ROW]
[ROW][C]14[/C][C]-0.064428[/C][C]-0.5032[/C][C]0.308318[/C][/ROW]
[ROW][C]15[/C][C]-0.048137[/C][C]-0.376[/C][C]0.354126[/C][/ROW]
[ROW][C]16[/C][C]-0.052822[/C][C]-0.4126[/C][C]0.340689[/C][/ROW]
[ROW][C]17[/C][C]-0.050631[/C][C]-0.3954[/C][C]0.346948[/C][/ROW]
[ROW][C]18[/C][C]-0.054879[/C][C]-0.4286[/C][C]0.334854[/C][/ROW]
[ROW][C]19[/C][C]-0.041639[/C][C]-0.3252[/C][C]0.373066[/C][/ROW]
[ROW][C]20[/C][C]-0.073304[/C][C]-0.5725[/C][C]0.284537[/C][/ROW]
[ROW][C]21[/C][C]-0.075316[/C][C]-0.5882[/C][C]0.279271[/C][/ROW]
[ROW][C]22[/C][C]-0.056777[/C][C]-0.4434[/C][C]0.329508[/C][/ROW]
[ROW][C]23[/C][C]-0.05017[/C][C]-0.3918[/C][C]0.348271[/C][/ROW]
[ROW][C]24[/C][C]-0.000941[/C][C]-0.0073[/C][C]0.497081[/C][/ROW]
[ROW][C]25[/C][C]-0.039193[/C][C]-0.3061[/C][C]0.380283[/C][/ROW]
[ROW][C]26[/C][C]-0.157925[/C][C]-1.2334[/C][C]0.111073[/C][/ROW]
[ROW][C]27[/C][C]-0.107834[/C][C]-0.8422[/C][C]0.201481[/C][/ROW]
[ROW][C]28[/C][C]-0.064581[/C][C]-0.5044[/C][C]0.307901[/C][/ROW]
[ROW][C]29[/C][C]-0.104055[/C][C]-0.8127[/C][C]0.209777[/C][/ROW]
[ROW][C]30[/C][C]-0.111076[/C][C]-0.8675[/C][C]0.194526[/C][/ROW]
[ROW][C]31[/C][C]-0.08438[/C][C]-0.659[/C][C]0.256178[/C][/ROW]
[ROW][C]32[/C][C]-0.202302[/C][C]-1.58[/C][C]0.059636[/C][/ROW]
[ROW][C]33[/C][C]-0.187008[/C][C]-1.4606[/C][C]0.074632[/C][/ROW]
[ROW][C]34[/C][C]-0.190879[/C][C]-1.4908[/C][C]0.070582[/C][/ROW]
[ROW][C]35[/C][C]-0.264733[/C][C]-2.0676[/C][C]0.021462[/C][/ROW]
[ROW][C]36[/C][C]-0.205441[/C][C]-1.6045[/C][C]0.05688[/C][/ROW]
[/TABLE]
Source: https://freestatistics.org/blog/index.php?pk=68705&T=1

Globally Unique Identifier (entire table): ba.freestatistics.org/blog/index.php?pk=68705&T=1

As an alternative you can also use a QR Code:  

The GUIDs for individual cells are displayed in the table below:

Autocorrelation Function
Time lag kACF(k)T-STATP-value
10.6672765.21161e-06
20.5780234.51451.5e-05
30.6171334.825e-06
40.4591663.58620.000334
50.4148563.24010.000968
60.3923773.06460.001622
70.2001721.56340.061567
80.1741411.36010.089404
90.1499521.17120.123044
100.0200190.15640.438137
110.071020.55470.29057
120.1601691.2510.107863
13-0.037044-0.28930.386658
14-0.064428-0.50320.308318
15-0.048137-0.3760.354126
16-0.052822-0.41260.340689
17-0.050631-0.39540.346948
18-0.054879-0.42860.334854
19-0.041639-0.32520.373066
20-0.073304-0.57250.284537
21-0.075316-0.58820.279271
22-0.056777-0.44340.329508
23-0.05017-0.39180.348271
24-0.000941-0.00730.497081
25-0.039193-0.30610.380283
26-0.157925-1.23340.111073
27-0.107834-0.84220.201481
28-0.064581-0.50440.307901
29-0.104055-0.81270.209777
30-0.111076-0.86750.194526
31-0.08438-0.6590.256178
32-0.202302-1.580.059636
33-0.187008-1.46060.074632
34-0.190879-1.49080.070582
35-0.264733-2.06760.021462
36-0.205441-1.60450.05688


Partial Autocorrelation Function
Time lag kPACF(k)T-STATP-value
10.6672765.21161e-06
20.2393291.86920.033198
30.3136782.44990.008587
4-0.134386-1.04960.149023
50.0336670.26290.396739
6-0.011911-0.0930.463093
7-0.245874-1.92030.029747
8-0.003007-0.02350.490669
9-0.017907-0.13990.444616
10-0.064825-0.50630.307235
110.1480381.15620.126051
120.2722862.12660.018753
13-0.272349-2.12710.018731
14-0.175683-1.37210.087525
15-0.094347-0.73690.232013
160.2070941.61750.05547
17-0.057715-0.45080.326877
180.0195750.15290.439496
190.2419291.88950.031788
20-0.174898-1.3660.088478
21-0.102765-0.80260.212655
220.0354550.27690.391392
23-0.029413-0.22970.409538
24-0.064191-0.50130.308967
250.0817850.63880.262686
26-0.131712-1.02870.15384
27-0.007058-0.05510.478109
28-0.00841-0.06570.473921
290.1593011.24420.109097
30-0.160679-1.25490.107143
31-0.037192-0.29050.386218
32-0.107609-0.84050.201968
33-0.078968-0.61680.269845
34-0.128637-1.00470.159509
35-0.060457-0.47220.319239
360.1294651.01120.157968

\begin{tabular}{lllllllll}
\hline
Partial Autocorrelation Function \tabularnewline
Time lag k & PACF(k) & T-STAT & P-value \tabularnewline
1 & 0.667276 & 5.2116 & 1e-06 \tabularnewline
2 & 0.239329 & 1.8692 & 0.033198 \tabularnewline
3 & 0.313678 & 2.4499 & 0.008587 \tabularnewline
4 & -0.134386 & -1.0496 & 0.149023 \tabularnewline
5 & 0.033667 & 0.2629 & 0.396739 \tabularnewline
6 & -0.011911 & -0.093 & 0.463093 \tabularnewline
7 & -0.245874 & -1.9203 & 0.029747 \tabularnewline
8 & -0.003007 & -0.0235 & 0.490669 \tabularnewline
9 & -0.017907 & -0.1399 & 0.444616 \tabularnewline
10 & -0.064825 & -0.5063 & 0.307235 \tabularnewline
11 & 0.148038 & 1.1562 & 0.126051 \tabularnewline
12 & 0.272286 & 2.1266 & 0.018753 \tabularnewline
13 & -0.272349 & -2.1271 & 0.018731 \tabularnewline
14 & -0.175683 & -1.3721 & 0.087525 \tabularnewline
15 & -0.094347 & -0.7369 & 0.232013 \tabularnewline
16 & 0.207094 & 1.6175 & 0.05547 \tabularnewline
17 & -0.057715 & -0.4508 & 0.326877 \tabularnewline
18 & 0.019575 & 0.1529 & 0.439496 \tabularnewline
19 & 0.241929 & 1.8895 & 0.031788 \tabularnewline
20 & -0.174898 & -1.366 & 0.088478 \tabularnewline
21 & -0.102765 & -0.8026 & 0.212655 \tabularnewline
22 & 0.035455 & 0.2769 & 0.391392 \tabularnewline
23 & -0.029413 & -0.2297 & 0.409538 \tabularnewline
24 & -0.064191 & -0.5013 & 0.308967 \tabularnewline
25 & 0.081785 & 0.6388 & 0.262686 \tabularnewline
26 & -0.131712 & -1.0287 & 0.15384 \tabularnewline
27 & -0.007058 & -0.0551 & 0.478109 \tabularnewline
28 & -0.00841 & -0.0657 & 0.473921 \tabularnewline
29 & 0.159301 & 1.2442 & 0.109097 \tabularnewline
30 & -0.160679 & -1.2549 & 0.107143 \tabularnewline
31 & -0.037192 & -0.2905 & 0.386218 \tabularnewline
32 & -0.107609 & -0.8405 & 0.201968 \tabularnewline
33 & -0.078968 & -0.6168 & 0.269845 \tabularnewline
34 & -0.128637 & -1.0047 & 0.159509 \tabularnewline
35 & -0.060457 & -0.4722 & 0.319239 \tabularnewline
36 & 0.129465 & 1.0112 & 0.157968 \tabularnewline
\hline
\end{tabular}
%Source: https://freestatistics.org/blog/index.php?pk=68705&T=2

[TABLE]
[ROW][C]Partial Autocorrelation Function[/C][/ROW]
[ROW][C]Time lag k[/C][C]PACF(k)[/C][C]T-STAT[/C][C]P-value[/C][/ROW]
[ROW][C]1[/C][C]0.667276[/C][C]5.2116[/C][C]1e-06[/C][/ROW]
[ROW][C]2[/C][C]0.239329[/C][C]1.8692[/C][C]0.033198[/C][/ROW]
[ROW][C]3[/C][C]0.313678[/C][C]2.4499[/C][C]0.008587[/C][/ROW]
[ROW][C]4[/C][C]-0.134386[/C][C]-1.0496[/C][C]0.149023[/C][/ROW]
[ROW][C]5[/C][C]0.033667[/C][C]0.2629[/C][C]0.396739[/C][/ROW]
[ROW][C]6[/C][C]-0.011911[/C][C]-0.093[/C][C]0.463093[/C][/ROW]
[ROW][C]7[/C][C]-0.245874[/C][C]-1.9203[/C][C]0.029747[/C][/ROW]
[ROW][C]8[/C][C]-0.003007[/C][C]-0.0235[/C][C]0.490669[/C][/ROW]
[ROW][C]9[/C][C]-0.017907[/C][C]-0.1399[/C][C]0.444616[/C][/ROW]
[ROW][C]10[/C][C]-0.064825[/C][C]-0.5063[/C][C]0.307235[/C][/ROW]
[ROW][C]11[/C][C]0.148038[/C][C]1.1562[/C][C]0.126051[/C][/ROW]
[ROW][C]12[/C][C]0.272286[/C][C]2.1266[/C][C]0.018753[/C][/ROW]
[ROW][C]13[/C][C]-0.272349[/C][C]-2.1271[/C][C]0.018731[/C][/ROW]
[ROW][C]14[/C][C]-0.175683[/C][C]-1.3721[/C][C]0.087525[/C][/ROW]
[ROW][C]15[/C][C]-0.094347[/C][C]-0.7369[/C][C]0.232013[/C][/ROW]
[ROW][C]16[/C][C]0.207094[/C][C]1.6175[/C][C]0.05547[/C][/ROW]
[ROW][C]17[/C][C]-0.057715[/C][C]-0.4508[/C][C]0.326877[/C][/ROW]
[ROW][C]18[/C][C]0.019575[/C][C]0.1529[/C][C]0.439496[/C][/ROW]
[ROW][C]19[/C][C]0.241929[/C][C]1.8895[/C][C]0.031788[/C][/ROW]
[ROW][C]20[/C][C]-0.174898[/C][C]-1.366[/C][C]0.088478[/C][/ROW]
[ROW][C]21[/C][C]-0.102765[/C][C]-0.8026[/C][C]0.212655[/C][/ROW]
[ROW][C]22[/C][C]0.035455[/C][C]0.2769[/C][C]0.391392[/C][/ROW]
[ROW][C]23[/C][C]-0.029413[/C][C]-0.2297[/C][C]0.409538[/C][/ROW]
[ROW][C]24[/C][C]-0.064191[/C][C]-0.5013[/C][C]0.308967[/C][/ROW]
[ROW][C]25[/C][C]0.081785[/C][C]0.6388[/C][C]0.262686[/C][/ROW]
[ROW][C]26[/C][C]-0.131712[/C][C]-1.0287[/C][C]0.15384[/C][/ROW]
[ROW][C]27[/C][C]-0.007058[/C][C]-0.0551[/C][C]0.478109[/C][/ROW]
[ROW][C]28[/C][C]-0.00841[/C][C]-0.0657[/C][C]0.473921[/C][/ROW]
[ROW][C]29[/C][C]0.159301[/C][C]1.2442[/C][C]0.109097[/C][/ROW]
[ROW][C]30[/C][C]-0.160679[/C][C]-1.2549[/C][C]0.107143[/C][/ROW]
[ROW][C]31[/C][C]-0.037192[/C][C]-0.2905[/C][C]0.386218[/C][/ROW]
[ROW][C]32[/C][C]-0.107609[/C][C]-0.8405[/C][C]0.201968[/C][/ROW]
[ROW][C]33[/C][C]-0.078968[/C][C]-0.6168[/C][C]0.269845[/C][/ROW]
[ROW][C]34[/C][C]-0.128637[/C][C]-1.0047[/C][C]0.159509[/C][/ROW]
[ROW][C]35[/C][C]-0.060457[/C][C]-0.4722[/C][C]0.319239[/C][/ROW]
[ROW][C]36[/C][C]0.129465[/C][C]1.0112[/C][C]0.157968[/C][/ROW]
[/TABLE]
Source: https://freestatistics.org/blog/index.php?pk=68705&T=2

Globally Unique Identifier (entire table): ba.freestatistics.org/blog/index.php?pk=68705&T=2

As an alternative you can also use a QR Code:  

The GUIDs for individual cells are displayed in the table below:

Partial Autocorrelation Function
Time lag kPACF(k)T-STATP-value
10.6672765.21161e-06
20.2393291.86920.033198
30.3136782.44990.008587
4-0.134386-1.04960.149023
50.0336670.26290.396739
6-0.011911-0.0930.463093
7-0.245874-1.92030.029747
8-0.003007-0.02350.490669
9-0.017907-0.13990.444616
10-0.064825-0.50630.307235
110.1480381.15620.126051
120.2722862.12660.018753
13-0.272349-2.12710.018731
14-0.175683-1.37210.087525
15-0.094347-0.73690.232013
160.2070941.61750.05547
17-0.057715-0.45080.326877
180.0195750.15290.439496
190.2419291.88950.031788
20-0.174898-1.3660.088478
21-0.102765-0.80260.212655
220.0354550.27690.391392
23-0.029413-0.22970.409538
24-0.064191-0.50130.308967
250.0817850.63880.262686
26-0.131712-1.02870.15384
27-0.007058-0.05510.478109
28-0.00841-0.06570.473921
290.1593011.24420.109097
30-0.160679-1.25490.107143
31-0.037192-0.29050.386218
32-0.107609-0.84050.201968
33-0.078968-0.61680.269845
34-0.128637-1.00470.159509
35-0.060457-0.47220.319239
360.1294651.01120.157968


Parameters (Session):
par1 = 36 ; par2 = 1 ; par3 = 0 ; par4 = 0 ; par5 = 12 ; par6 = MA ; par7 = 0.95 ;
Parameters (R input):
par1 = 36 ; par2 = 1 ; par3 = 0 ; par4 = 0 ; par5 = 12 ; par6 = MA ; par7 = 0.95 ;
R code (references can be found in the software module):
if (par1 == 'Default') {
par1 = 10*log10(length(x))
} else {
par1 <- as.numeric(par1)
}
par2 <- as.numeric(par2)
par3 <- as.numeric(par3)
par4 <- as.numeric(par4)
par5 <- as.numeric(par5)
if (par6 == 'White Noise') par6 <- 'white' else par6 <- 'ma'
par7 <- as.numeric(par7)
if (par2 == 0) {
x <- log(x)
} else {
x <- (x ^ par2 - 1) / par2
}
if (par3 > 0) x <- diff(x,lag=1,difference=par3)
if (par4 > 0) x <- diff(x,lag=par5,difference=par4)
bitmap(file='pic1.png')
racf <- acf(x, par1, main='Autocorrelation', xlab='time lag', ylab='ACF', ci.type=par6, ci=par7, sub=paste('(lambda=',par2,', d=',par3,', D=',par4,', CI=', par7, ', CI type=',par6,')',sep=''))
dev.off()
bitmap(file='pic2.png')
rpacf <- pacf(x,par1,main='Partial Autocorrelation',xlab='lags',ylab='PACF')
dev.off()
(myacf <- c(racf$acf))
(mypacf <- c(rpacf$acf))
lengthx <- length(x)
sqrtn <- sqrt(lengthx)
load(file='createtable')
a<-table.start()
a<-table.row.start(a)
a<-table.element(a,'Autocorrelation Function',4,TRUE)
a<-table.row.end(a)
a<-table.row.start(a)
a<-table.element(a,'Time lag k',header=TRUE)
a<-table.element(a,hyperlink('basics.htm','ACF(k)','click here for more information about the Autocorrelation Function'),header=TRUE)
a<-table.element(a,'T-STAT',header=TRUE)
a<-table.element(a,'P-value',header=TRUE)
a<-table.row.end(a)
for (i in 2:(par1+1)) {
a<-table.row.start(a)
a<-table.element(a,i-1,header=TRUE)
a<-table.element(a,round(myacf[i],6))
mytstat <- myacf[i]*sqrtn
a<-table.element(a,round(mytstat,4))
a<-table.element(a,round(1-pt(abs(mytstat),lengthx),6))
a<-table.row.end(a)
}
a<-table.end(a)
table.save(a,file='mytable.tab')
a<-table.start()
a<-table.row.start(a)
a<-table.element(a,'Partial Autocorrelation Function',4,TRUE)
a<-table.row.end(a)
a<-table.row.start(a)
a<-table.element(a,'Time lag k',header=TRUE)
a<-table.element(a,hyperlink('basics.htm','PACF(k)','click here for more information about the Partial Autocorrelation Function'),header=TRUE)
a<-table.element(a,'T-STAT',header=TRUE)
a<-table.element(a,'P-value',header=TRUE)
a<-table.row.end(a)
for (i in 1:par1) {
a<-table.row.start(a)
a<-table.element(a,i,header=TRUE)
a<-table.element(a,round(mypacf[i],6))
mytstat <- mypacf[i]*sqrtn
a<-table.element(a,round(mytstat,4))
a<-table.element(a,round(1-pt(abs(mytstat),lengthx),6))
a<-table.row.end(a)
}
a<-table.end(a)
table.save(a,file='mytable1.tab')