Free Statistics

of Irreproducible Research!

Author's title

Author*The author of this computation has been verified*
R Software Modulerwasp_autocorrelation.wasp
Title produced by software(Partial) Autocorrelation Function
Date of computationThu, 17 Dec 2009 03:46:57 -0700
Cite this page as followsStatistical Computations at FreeStatistics.org, Office for Research Development and Education, URL https://freestatistics.org/blog/index.php?v=date/2009/Dec/17/t1261046873dmgaonb3zup80zd.htm/, Retrieved Tue, 30 Apr 2024 06:04:56 +0000
Statistical Computations at FreeStatistics.org, Office for Research Development and Education, URL https://freestatistics.org/blog/index.php?pk=68710, Retrieved Tue, 30 Apr 2024 06:04:56 +0000
QR Codes:

Original text written by user:
IsPrivate?No (this computation is public)
User-defined keywordsshwpaper11
Estimated Impact88
Family? (F = Feedback message, R = changed R code, M = changed R Module, P = changed Parameters, D = changed Data)
-       [(Partial) Autocorrelation Function] [] [2009-12-17 10:46:57] [4407d6264e55b051ec65750e6dca2820] [Current]
Feedback Forum

Post a new message
Dataseries X:
14497
14398.3
16629.6
16670.7
16614.8
16869.2
15663.9
16359.9
18447.7
16889
16505
18320.9
15052.1
15699.8
18135.3
16768.7
18883
19021
18101.9
17776.1
21489.9
17065.3
18690
18953.1
16398.9
16895.6
18553
19270
19422.1
17579.4
18637.3
18076.7
20438.6
18075.2
19563
19899.2
19227.5
17789.6
19220.8
21968.9
21131.5
19484.6
22168.7
20866.8
22176.2
23533.8
21479.6
24347.7
22751.6
20328.3
23650.4
23335.7
19614.9
18042.3
17282.5
16847.2
18159.5
16540.9
15952.7
18357.8
16394.3


Summary of computational transaction
Raw Inputview raw input (R code)
Raw Outputview raw output of R engine
Computing time1 seconds
R Server'Gwilym Jenkins' @ 72.249.127.135

\begin{tabular}{lllllllll}
\hline
Summary of computational transaction \tabularnewline
Raw Input & view raw input (R code)  \tabularnewline
Raw Output & view raw output of R engine  \tabularnewline
Computing time & 1 seconds \tabularnewline
R Server & 'Gwilym Jenkins' @ 72.249.127.135 \tabularnewline
\hline
\end{tabular}
%Source: https://freestatistics.org/blog/index.php?pk=68710&T=0

[TABLE]
[ROW][C]Summary of computational transaction[/C][/ROW]
[ROW][C]Raw Input[/C][C]view raw input (R code) [/C][/ROW]
[ROW][C]Raw Output[/C][C]view raw output of R engine [/C][/ROW]
[ROW][C]Computing time[/C][C]1 seconds[/C][/ROW]
[ROW][C]R Server[/C][C]'Gwilym Jenkins' @ 72.249.127.135[/C][/ROW]
[/TABLE]
Source: https://freestatistics.org/blog/index.php?pk=68710&T=0

Globally Unique Identifier (entire table): ba.freestatistics.org/blog/index.php?pk=68710&T=0

As an alternative you can also use a QR Code:  

The GUIDs for individual cells are displayed in the table below:

Summary of computational transaction
Raw Inputview raw input (R code)
Raw Outputview raw output of R engine
Computing time1 seconds
R Server'Gwilym Jenkins' @ 72.249.127.135


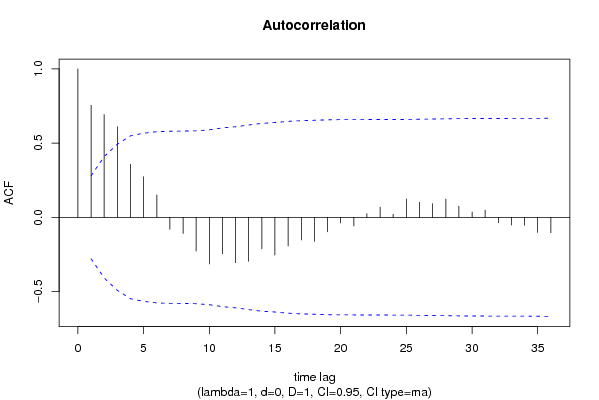
Autocorrelation Function
Time lag kACF(k)T-STATP-value
10.7549335.28451e-06
20.6925144.84767e-06
30.6108574.2764.4e-05
40.3570152.49910.007926
50.2726991.90890.031071
60.1505431.05380.148571
7-0.080902-0.56630.286883
8-0.109291-0.7650.22396
9-0.22743-1.5920.058907
10-0.314698-2.20290.016168
11-0.245362-1.71750.046098
12-0.306298-2.14410.018507
13-0.296444-2.07510.021624
14-0.212305-1.48610.071825
15-0.254398-1.78080.040574
16-0.192905-1.35030.091557
17-0.152719-1.0690.145147
18-0.162647-1.13850.130217
19-0.098181-0.68730.247578
20-0.038456-0.26920.394456
21-0.0587-0.41090.341469
220.0240090.16810.433612
230.0681910.47730.317623
240.0211250.14790.441523
250.1235840.86510.195602
260.1010940.70770.241255
270.0918330.64280.261665
280.1229160.86040.196876
290.0751570.52610.300596
300.0357910.25050.401609
310.0481030.33670.368883
32-0.036911-0.25840.398599
33-0.052182-0.36530.358239
34-0.053156-0.37210.355715
35-0.102129-0.71490.239031
36-0.103455-0.72420.236199

\begin{tabular}{lllllllll}
\hline
Autocorrelation Function \tabularnewline
Time lag k & ACF(k) & T-STAT & P-value \tabularnewline
1 & 0.754933 & 5.2845 & 1e-06 \tabularnewline
2 & 0.692514 & 4.8476 & 7e-06 \tabularnewline
3 & 0.610857 & 4.276 & 4.4e-05 \tabularnewline
4 & 0.357015 & 2.4991 & 0.007926 \tabularnewline
5 & 0.272699 & 1.9089 & 0.031071 \tabularnewline
6 & 0.150543 & 1.0538 & 0.148571 \tabularnewline
7 & -0.080902 & -0.5663 & 0.286883 \tabularnewline
8 & -0.109291 & -0.765 & 0.22396 \tabularnewline
9 & -0.22743 & -1.592 & 0.058907 \tabularnewline
10 & -0.314698 & -2.2029 & 0.016168 \tabularnewline
11 & -0.245362 & -1.7175 & 0.046098 \tabularnewline
12 & -0.306298 & -2.1441 & 0.018507 \tabularnewline
13 & -0.296444 & -2.0751 & 0.021624 \tabularnewline
14 & -0.212305 & -1.4861 & 0.071825 \tabularnewline
15 & -0.254398 & -1.7808 & 0.040574 \tabularnewline
16 & -0.192905 & -1.3503 & 0.091557 \tabularnewline
17 & -0.152719 & -1.069 & 0.145147 \tabularnewline
18 & -0.162647 & -1.1385 & 0.130217 \tabularnewline
19 & -0.098181 & -0.6873 & 0.247578 \tabularnewline
20 & -0.038456 & -0.2692 & 0.394456 \tabularnewline
21 & -0.0587 & -0.4109 & 0.341469 \tabularnewline
22 & 0.024009 & 0.1681 & 0.433612 \tabularnewline
23 & 0.068191 & 0.4773 & 0.317623 \tabularnewline
24 & 0.021125 & 0.1479 & 0.441523 \tabularnewline
25 & 0.123584 & 0.8651 & 0.195602 \tabularnewline
26 & 0.101094 & 0.7077 & 0.241255 \tabularnewline
27 & 0.091833 & 0.6428 & 0.261665 \tabularnewline
28 & 0.122916 & 0.8604 & 0.196876 \tabularnewline
29 & 0.075157 & 0.5261 & 0.300596 \tabularnewline
30 & 0.035791 & 0.2505 & 0.401609 \tabularnewline
31 & 0.048103 & 0.3367 & 0.368883 \tabularnewline
32 & -0.036911 & -0.2584 & 0.398599 \tabularnewline
33 & -0.052182 & -0.3653 & 0.358239 \tabularnewline
34 & -0.053156 & -0.3721 & 0.355715 \tabularnewline
35 & -0.102129 & -0.7149 & 0.239031 \tabularnewline
36 & -0.103455 & -0.7242 & 0.236199 \tabularnewline
\hline
\end{tabular}
%Source: https://freestatistics.org/blog/index.php?pk=68710&T=1

[TABLE]
[ROW][C]Autocorrelation Function[/C][/ROW]
[ROW][C]Time lag k[/C][C]ACF(k)[/C][C]T-STAT[/C][C]P-value[/C][/ROW]
[ROW][C]1[/C][C]0.754933[/C][C]5.2845[/C][C]1e-06[/C][/ROW]
[ROW][C]2[/C][C]0.692514[/C][C]4.8476[/C][C]7e-06[/C][/ROW]
[ROW][C]3[/C][C]0.610857[/C][C]4.276[/C][C]4.4e-05[/C][/ROW]
[ROW][C]4[/C][C]0.357015[/C][C]2.4991[/C][C]0.007926[/C][/ROW]
[ROW][C]5[/C][C]0.272699[/C][C]1.9089[/C][C]0.031071[/C][/ROW]
[ROW][C]6[/C][C]0.150543[/C][C]1.0538[/C][C]0.148571[/C][/ROW]
[ROW][C]7[/C][C]-0.080902[/C][C]-0.5663[/C][C]0.286883[/C][/ROW]
[ROW][C]8[/C][C]-0.109291[/C][C]-0.765[/C][C]0.22396[/C][/ROW]
[ROW][C]9[/C][C]-0.22743[/C][C]-1.592[/C][C]0.058907[/C][/ROW]
[ROW][C]10[/C][C]-0.314698[/C][C]-2.2029[/C][C]0.016168[/C][/ROW]
[ROW][C]11[/C][C]-0.245362[/C][C]-1.7175[/C][C]0.046098[/C][/ROW]
[ROW][C]12[/C][C]-0.306298[/C][C]-2.1441[/C][C]0.018507[/C][/ROW]
[ROW][C]13[/C][C]-0.296444[/C][C]-2.0751[/C][C]0.021624[/C][/ROW]
[ROW][C]14[/C][C]-0.212305[/C][C]-1.4861[/C][C]0.071825[/C][/ROW]
[ROW][C]15[/C][C]-0.254398[/C][C]-1.7808[/C][C]0.040574[/C][/ROW]
[ROW][C]16[/C][C]-0.192905[/C][C]-1.3503[/C][C]0.091557[/C][/ROW]
[ROW][C]17[/C][C]-0.152719[/C][C]-1.069[/C][C]0.145147[/C][/ROW]
[ROW][C]18[/C][C]-0.162647[/C][C]-1.1385[/C][C]0.130217[/C][/ROW]
[ROW][C]19[/C][C]-0.098181[/C][C]-0.6873[/C][C]0.247578[/C][/ROW]
[ROW][C]20[/C][C]-0.038456[/C][C]-0.2692[/C][C]0.394456[/C][/ROW]
[ROW][C]21[/C][C]-0.0587[/C][C]-0.4109[/C][C]0.341469[/C][/ROW]
[ROW][C]22[/C][C]0.024009[/C][C]0.1681[/C][C]0.433612[/C][/ROW]
[ROW][C]23[/C][C]0.068191[/C][C]0.4773[/C][C]0.317623[/C][/ROW]
[ROW][C]24[/C][C]0.021125[/C][C]0.1479[/C][C]0.441523[/C][/ROW]
[ROW][C]25[/C][C]0.123584[/C][C]0.8651[/C][C]0.195602[/C][/ROW]
[ROW][C]26[/C][C]0.101094[/C][C]0.7077[/C][C]0.241255[/C][/ROW]
[ROW][C]27[/C][C]0.091833[/C][C]0.6428[/C][C]0.261665[/C][/ROW]
[ROW][C]28[/C][C]0.122916[/C][C]0.8604[/C][C]0.196876[/C][/ROW]
[ROW][C]29[/C][C]0.075157[/C][C]0.5261[/C][C]0.300596[/C][/ROW]
[ROW][C]30[/C][C]0.035791[/C][C]0.2505[/C][C]0.401609[/C][/ROW]
[ROW][C]31[/C][C]0.048103[/C][C]0.3367[/C][C]0.368883[/C][/ROW]
[ROW][C]32[/C][C]-0.036911[/C][C]-0.2584[/C][C]0.398599[/C][/ROW]
[ROW][C]33[/C][C]-0.052182[/C][C]-0.3653[/C][C]0.358239[/C][/ROW]
[ROW][C]34[/C][C]-0.053156[/C][C]-0.3721[/C][C]0.355715[/C][/ROW]
[ROW][C]35[/C][C]-0.102129[/C][C]-0.7149[/C][C]0.239031[/C][/ROW]
[ROW][C]36[/C][C]-0.103455[/C][C]-0.7242[/C][C]0.236199[/C][/ROW]
[/TABLE]
Source: https://freestatistics.org/blog/index.php?pk=68710&T=1

Globally Unique Identifier (entire table): ba.freestatistics.org/blog/index.php?pk=68710&T=1

As an alternative you can also use a QR Code:  

The GUIDs for individual cells are displayed in the table below:

Autocorrelation Function
Time lag kACF(k)T-STATP-value
10.7549335.28451e-06
20.6925144.84767e-06
30.6108574.2764.4e-05
40.3570152.49910.007926
50.2726991.90890.031071
60.1505431.05380.148571
7-0.080902-0.56630.286883
8-0.109291-0.7650.22396
9-0.22743-1.5920.058907
10-0.314698-2.20290.016168
11-0.245362-1.71750.046098
12-0.306298-2.14410.018507
13-0.296444-2.07510.021624
14-0.212305-1.48610.071825
15-0.254398-1.78080.040574
16-0.192905-1.35030.091557
17-0.152719-1.0690.145147
18-0.162647-1.13850.130217
19-0.098181-0.68730.247578
20-0.038456-0.26920.394456
21-0.0587-0.41090.341469
220.0240090.16810.433612
230.0681910.47730.317623
240.0211250.14790.441523
250.1235840.86510.195602
260.1010940.70770.241255
270.0918330.64280.261665
280.1229160.86040.196876
290.0751570.52610.300596
300.0357910.25050.401609
310.0481030.33670.368883
32-0.036911-0.25840.398599
33-0.052182-0.36530.358239
34-0.053156-0.37210.355715
35-0.102129-0.71490.239031
36-0.103455-0.72420.236199


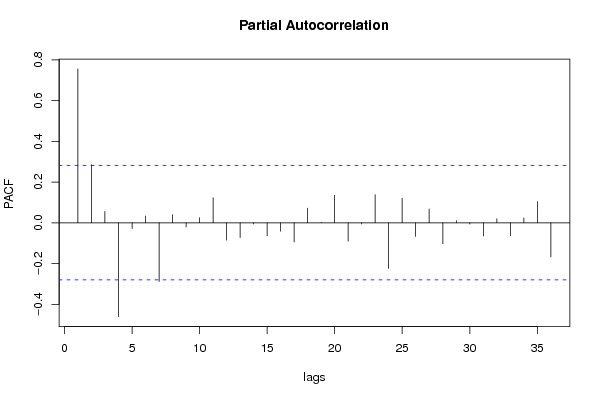
Partial Autocorrelation Function
Time lag kPACF(k)T-STATP-value
10.7549335.28451e-06
20.2850421.99530.025793
30.0553930.38770.349941
4-0.460896-3.22630.001118
5-0.028413-0.19890.421584
60.0328360.22990.409582
7-0.287926-2.01550.024678
80.0389740.27280.393071
9-0.020298-0.14210.443798
100.0245850.17210.432035
110.1225940.85820.197491
12-0.084842-0.59390.277657
13-0.071953-0.50370.308376
14-0.005522-0.03870.484662
15-0.063759-0.44630.32867
16-0.041155-0.28810.387249
17-0.094133-0.65890.256513
180.0715830.50110.30928
190.0016640.01160.495376
200.1350880.94560.174493
21-0.090292-0.6320.265149
22-0.005837-0.04090.483786
230.1376580.96360.169988
24-0.223938-1.56760.061709
250.1205750.8440.201378
26-0.066889-0.46820.32085
270.0675650.4730.319173
28-0.102821-0.71970.23755
290.0100490.07030.472105
30-0.006504-0.04550.481937
31-0.06501-0.45510.325534
320.0199780.13980.444677
33-0.063991-0.44790.328086
340.0237320.16610.43437
350.1033020.72310.236525
36-0.167799-1.17460.122918

\begin{tabular}{lllllllll}
\hline
Partial Autocorrelation Function \tabularnewline
Time lag k & PACF(k) & T-STAT & P-value \tabularnewline
1 & 0.754933 & 5.2845 & 1e-06 \tabularnewline
2 & 0.285042 & 1.9953 & 0.025793 \tabularnewline
3 & 0.055393 & 0.3877 & 0.349941 \tabularnewline
4 & -0.460896 & -3.2263 & 0.001118 \tabularnewline
5 & -0.028413 & -0.1989 & 0.421584 \tabularnewline
6 & 0.032836 & 0.2299 & 0.409582 \tabularnewline
7 & -0.287926 & -2.0155 & 0.024678 \tabularnewline
8 & 0.038974 & 0.2728 & 0.393071 \tabularnewline
9 & -0.020298 & -0.1421 & 0.443798 \tabularnewline
10 & 0.024585 & 0.1721 & 0.432035 \tabularnewline
11 & 0.122594 & 0.8582 & 0.197491 \tabularnewline
12 & -0.084842 & -0.5939 & 0.277657 \tabularnewline
13 & -0.071953 & -0.5037 & 0.308376 \tabularnewline
14 & -0.005522 & -0.0387 & 0.484662 \tabularnewline
15 & -0.063759 & -0.4463 & 0.32867 \tabularnewline
16 & -0.041155 & -0.2881 & 0.387249 \tabularnewline
17 & -0.094133 & -0.6589 & 0.256513 \tabularnewline
18 & 0.071583 & 0.5011 & 0.30928 \tabularnewline
19 & 0.001664 & 0.0116 & 0.495376 \tabularnewline
20 & 0.135088 & 0.9456 & 0.174493 \tabularnewline
21 & -0.090292 & -0.632 & 0.265149 \tabularnewline
22 & -0.005837 & -0.0409 & 0.483786 \tabularnewline
23 & 0.137658 & 0.9636 & 0.169988 \tabularnewline
24 & -0.223938 & -1.5676 & 0.061709 \tabularnewline
25 & 0.120575 & 0.844 & 0.201378 \tabularnewline
26 & -0.066889 & -0.4682 & 0.32085 \tabularnewline
27 & 0.067565 & 0.473 & 0.319173 \tabularnewline
28 & -0.102821 & -0.7197 & 0.23755 \tabularnewline
29 & 0.010049 & 0.0703 & 0.472105 \tabularnewline
30 & -0.006504 & -0.0455 & 0.481937 \tabularnewline
31 & -0.06501 & -0.4551 & 0.325534 \tabularnewline
32 & 0.019978 & 0.1398 & 0.444677 \tabularnewline
33 & -0.063991 & -0.4479 & 0.328086 \tabularnewline
34 & 0.023732 & 0.1661 & 0.43437 \tabularnewline
35 & 0.103302 & 0.7231 & 0.236525 \tabularnewline
36 & -0.167799 & -1.1746 & 0.122918 \tabularnewline
\hline
\end{tabular}
%Source: https://freestatistics.org/blog/index.php?pk=68710&T=2

[TABLE]
[ROW][C]Partial Autocorrelation Function[/C][/ROW]
[ROW][C]Time lag k[/C][C]PACF(k)[/C][C]T-STAT[/C][C]P-value[/C][/ROW]
[ROW][C]1[/C][C]0.754933[/C][C]5.2845[/C][C]1e-06[/C][/ROW]
[ROW][C]2[/C][C]0.285042[/C][C]1.9953[/C][C]0.025793[/C][/ROW]
[ROW][C]3[/C][C]0.055393[/C][C]0.3877[/C][C]0.349941[/C][/ROW]
[ROW][C]4[/C][C]-0.460896[/C][C]-3.2263[/C][C]0.001118[/C][/ROW]
[ROW][C]5[/C][C]-0.028413[/C][C]-0.1989[/C][C]0.421584[/C][/ROW]
[ROW][C]6[/C][C]0.032836[/C][C]0.2299[/C][C]0.409582[/C][/ROW]
[ROW][C]7[/C][C]-0.287926[/C][C]-2.0155[/C][C]0.024678[/C][/ROW]
[ROW][C]8[/C][C]0.038974[/C][C]0.2728[/C][C]0.393071[/C][/ROW]
[ROW][C]9[/C][C]-0.020298[/C][C]-0.1421[/C][C]0.443798[/C][/ROW]
[ROW][C]10[/C][C]0.024585[/C][C]0.1721[/C][C]0.432035[/C][/ROW]
[ROW][C]11[/C][C]0.122594[/C][C]0.8582[/C][C]0.197491[/C][/ROW]
[ROW][C]12[/C][C]-0.084842[/C][C]-0.5939[/C][C]0.277657[/C][/ROW]
[ROW][C]13[/C][C]-0.071953[/C][C]-0.5037[/C][C]0.308376[/C][/ROW]
[ROW][C]14[/C][C]-0.005522[/C][C]-0.0387[/C][C]0.484662[/C][/ROW]
[ROW][C]15[/C][C]-0.063759[/C][C]-0.4463[/C][C]0.32867[/C][/ROW]
[ROW][C]16[/C][C]-0.041155[/C][C]-0.2881[/C][C]0.387249[/C][/ROW]
[ROW][C]17[/C][C]-0.094133[/C][C]-0.6589[/C][C]0.256513[/C][/ROW]
[ROW][C]18[/C][C]0.071583[/C][C]0.5011[/C][C]0.30928[/C][/ROW]
[ROW][C]19[/C][C]0.001664[/C][C]0.0116[/C][C]0.495376[/C][/ROW]
[ROW][C]20[/C][C]0.135088[/C][C]0.9456[/C][C]0.174493[/C][/ROW]
[ROW][C]21[/C][C]-0.090292[/C][C]-0.632[/C][C]0.265149[/C][/ROW]
[ROW][C]22[/C][C]-0.005837[/C][C]-0.0409[/C][C]0.483786[/C][/ROW]
[ROW][C]23[/C][C]0.137658[/C][C]0.9636[/C][C]0.169988[/C][/ROW]
[ROW][C]24[/C][C]-0.223938[/C][C]-1.5676[/C][C]0.061709[/C][/ROW]
[ROW][C]25[/C][C]0.120575[/C][C]0.844[/C][C]0.201378[/C][/ROW]
[ROW][C]26[/C][C]-0.066889[/C][C]-0.4682[/C][C]0.32085[/C][/ROW]
[ROW][C]27[/C][C]0.067565[/C][C]0.473[/C][C]0.319173[/C][/ROW]
[ROW][C]28[/C][C]-0.102821[/C][C]-0.7197[/C][C]0.23755[/C][/ROW]
[ROW][C]29[/C][C]0.010049[/C][C]0.0703[/C][C]0.472105[/C][/ROW]
[ROW][C]30[/C][C]-0.006504[/C][C]-0.0455[/C][C]0.481937[/C][/ROW]
[ROW][C]31[/C][C]-0.06501[/C][C]-0.4551[/C][C]0.325534[/C][/ROW]
[ROW][C]32[/C][C]0.019978[/C][C]0.1398[/C][C]0.444677[/C][/ROW]
[ROW][C]33[/C][C]-0.063991[/C][C]-0.4479[/C][C]0.328086[/C][/ROW]
[ROW][C]34[/C][C]0.023732[/C][C]0.1661[/C][C]0.43437[/C][/ROW]
[ROW][C]35[/C][C]0.103302[/C][C]0.7231[/C][C]0.236525[/C][/ROW]
[ROW][C]36[/C][C]-0.167799[/C][C]-1.1746[/C][C]0.122918[/C][/ROW]
[/TABLE]
Source: https://freestatistics.org/blog/index.php?pk=68710&T=2

Globally Unique Identifier (entire table): ba.freestatistics.org/blog/index.php?pk=68710&T=2

As an alternative you can also use a QR Code:  

The GUIDs for individual cells are displayed in the table below:

Partial Autocorrelation Function
Time lag kPACF(k)T-STATP-value
10.7549335.28451e-06
20.2850421.99530.025793
30.0553930.38770.349941
4-0.460896-3.22630.001118
5-0.028413-0.19890.421584
60.0328360.22990.409582
7-0.287926-2.01550.024678
80.0389740.27280.393071
9-0.020298-0.14210.443798
100.0245850.17210.432035
110.1225940.85820.197491
12-0.084842-0.59390.277657
13-0.071953-0.50370.308376
14-0.005522-0.03870.484662
15-0.063759-0.44630.32867
16-0.041155-0.28810.387249
17-0.094133-0.65890.256513
180.0715830.50110.30928
190.0016640.01160.495376
200.1350880.94560.174493
21-0.090292-0.6320.265149
22-0.005837-0.04090.483786
230.1376580.96360.169988
24-0.223938-1.56760.061709
250.1205750.8440.201378
26-0.066889-0.46820.32085
270.0675650.4730.319173
28-0.102821-0.71970.23755
290.0100490.07030.472105
30-0.006504-0.04550.481937
31-0.06501-0.45510.325534
320.0199780.13980.444677
33-0.063991-0.44790.328086
340.0237320.16610.43437
350.1033020.72310.236525
36-0.167799-1.17460.122918


Parameters (Session):
par1 = 36 ; par2 = 1 ; par3 = 0 ; par4 = 1 ; par5 = 12 ; par6 = MA ; par7 = 0.95 ;
Parameters (R input):
par1 = 36 ; par2 = 1 ; par3 = 0 ; par4 = 1 ; par5 = 12 ; par6 = MA ; par7 = 0.95 ;
R code (references can be found in the software module):
if (par1 == 'Default') {
par1 = 10*log10(length(x))
} else {
par1 <- as.numeric(par1)
}
par2 <- as.numeric(par2)
par3 <- as.numeric(par3)
par4 <- as.numeric(par4)
par5 <- as.numeric(par5)
if (par6 == 'White Noise') par6 <- 'white' else par6 <- 'ma'
par7 <- as.numeric(par7)
if (par2 == 0) {
x <- log(x)
} else {
x <- (x ^ par2 - 1) / par2
}
if (par3 > 0) x <- diff(x,lag=1,difference=par3)
if (par4 > 0) x <- diff(x,lag=par5,difference=par4)
bitmap(file='pic1.png')
racf <- acf(x, par1, main='Autocorrelation', xlab='time lag', ylab='ACF', ci.type=par6, ci=par7, sub=paste('(lambda=',par2,', d=',par3,', D=',par4,', CI=', par7, ', CI type=',par6,')',sep=''))
dev.off()
bitmap(file='pic2.png')
rpacf <- pacf(x,par1,main='Partial Autocorrelation',xlab='lags',ylab='PACF')
dev.off()
(myacf <- c(racf$acf))
(mypacf <- c(rpacf$acf))
lengthx <- length(x)
sqrtn <- sqrt(lengthx)
load(file='createtable')
a<-table.start()
a<-table.row.start(a)
a<-table.element(a,'Autocorrelation Function',4,TRUE)
a<-table.row.end(a)
a<-table.row.start(a)
a<-table.element(a,'Time lag k',header=TRUE)
a<-table.element(a,hyperlink('basics.htm','ACF(k)','click here for more information about the Autocorrelation Function'),header=TRUE)
a<-table.element(a,'T-STAT',header=TRUE)
a<-table.element(a,'P-value',header=TRUE)
a<-table.row.end(a)
for (i in 2:(par1+1)) {
a<-table.row.start(a)
a<-table.element(a,i-1,header=TRUE)
a<-table.element(a,round(myacf[i],6))
mytstat <- myacf[i]*sqrtn
a<-table.element(a,round(mytstat,4))
a<-table.element(a,round(1-pt(abs(mytstat),lengthx),6))
a<-table.row.end(a)
}
a<-table.end(a)
table.save(a,file='mytable.tab')
a<-table.start()
a<-table.row.start(a)
a<-table.element(a,'Partial Autocorrelation Function',4,TRUE)
a<-table.row.end(a)
a<-table.row.start(a)
a<-table.element(a,'Time lag k',header=TRUE)
a<-table.element(a,hyperlink('basics.htm','PACF(k)','click here for more information about the Partial Autocorrelation Function'),header=TRUE)
a<-table.element(a,'T-STAT',header=TRUE)
a<-table.element(a,'P-value',header=TRUE)
a<-table.row.end(a)
for (i in 1:par1) {
a<-table.row.start(a)
a<-table.element(a,i,header=TRUE)
a<-table.element(a,round(mypacf[i],6))
mytstat <- mypacf[i]*sqrtn
a<-table.element(a,round(mytstat,4))
a<-table.element(a,round(1-pt(abs(mytstat),lengthx),6))
a<-table.row.end(a)
}
a<-table.end(a)
table.save(a,file='mytable1.tab')