Free Statistics

of Irreproducible Research!

Author's title

Author*The author of this computation has been verified*
R Software Modulerwasp_autocorrelation.wasp
Title produced by software(Partial) Autocorrelation Function
Date of computationThu, 17 Dec 2009 03:50:32 -0700
Cite this page as followsStatistical Computations at FreeStatistics.org, Office for Research Development and Education, URL https://freestatistics.org/blog/index.php?v=date/2009/Dec/17/t1261047073yo535vq0o3btxi8.htm/, Retrieved Tue, 30 Apr 2024 04:52:01 +0000
Statistical Computations at FreeStatistics.org, Office for Research Development and Education, URL https://freestatistics.org/blog/index.php?pk=68714, Retrieved Tue, 30 Apr 2024 04:52:01 +0000
QR Codes:

Original text written by user:
IsPrivate?No (this computation is public)
User-defined keywordsshwpaper13
Estimated Impact128
Family? (F = Feedback message, R = changed R code, M = changed R Module, P = changed Parameters, D = changed Data)
-       [(Partial) Autocorrelation Function] [] [2009-12-17 10:50:32] [4407d6264e55b051ec65750e6dca2820] [Current]
Feedback Forum

Post a new message
Dataseries X:
14497
14398.3
16629.6
16670.7
16614.8
16869.2
15663.9
16359.9
18447.7
16889
16505
18320.9
15052.1
15699.8
18135.3
16768.7
18883
19021
18101.9
17776.1
21489.9
17065.3
18690
18953.1
16398.9
16895.6
18553
19270
19422.1
17579.4
18637.3
18076.7
20438.6
18075.2
19563
19899.2
19227.5
17789.6
19220.8
21968.9
21131.5
19484.6
22168.7
20866.8
22176.2
23533.8
21479.6
24347.7
22751.6
20328.3
23650.4
23335.7
19614.9
18042.3
17282.5
16847.2
18159.5
16540.9
15952.7
18357.8
16394.3


Summary of computational transaction
Raw Inputview raw input (R code)
Raw Outputview raw output of R engine
Computing time1 seconds
R Server'Gwilym Jenkins' @ 72.249.127.135

\begin{tabular}{lllllllll}
\hline
Summary of computational transaction \tabularnewline
Raw Input & view raw input (R code)  \tabularnewline
Raw Output & view raw output of R engine  \tabularnewline
Computing time & 1 seconds \tabularnewline
R Server & 'Gwilym Jenkins' @ 72.249.127.135 \tabularnewline
\hline
\end{tabular}
%Source: https://freestatistics.org/blog/index.php?pk=68714&T=0

[TABLE]
[ROW][C]Summary of computational transaction[/C][/ROW]
[ROW][C]Raw Input[/C][C]view raw input (R code) [/C][/ROW]
[ROW][C]Raw Output[/C][C]view raw output of R engine [/C][/ROW]
[ROW][C]Computing time[/C][C]1 seconds[/C][/ROW]
[ROW][C]R Server[/C][C]'Gwilym Jenkins' @ 72.249.127.135[/C][/ROW]
[/TABLE]
Source: https://freestatistics.org/blog/index.php?pk=68714&T=0

Globally Unique Identifier (entire table): ba.freestatistics.org/blog/index.php?pk=68714&T=0

As an alternative you can also use a QR Code:  

The GUIDs for individual cells are displayed in the table below:

Summary of computational transaction
Raw Inputview raw input (R code)
Raw Outputview raw output of R engine
Computing time1 seconds
R Server'Gwilym Jenkins' @ 72.249.127.135


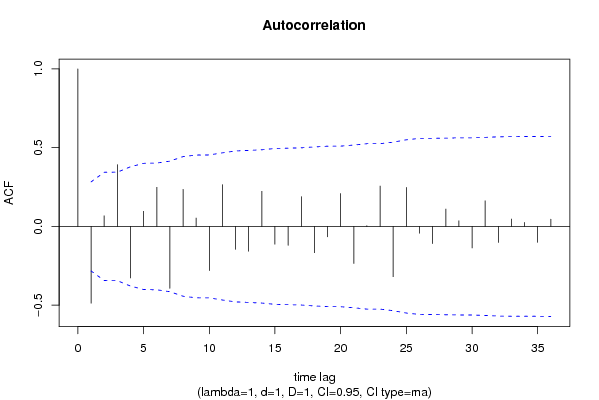
Autocorrelation Function
Time lag kACF(k)T-STATP-value
1-0.487788-3.37950.000725
20.0672170.46570.321771
30.3920452.71620.004577
4-0.327154-2.26660.01398
50.0961540.66620.254244
60.2483981.7210.04585
7-0.393011-2.72290.004498
80.235281.63010.054816
90.0534820.37050.356307
10-0.280161-1.9410.029071
110.2653571.83840.036094
12-0.145572-1.00860.159124
13-0.157012-1.08780.141055
140.2228791.54410.06456
15-0.112807-0.78160.219158
16-0.120318-0.83360.204322
170.1887251.30750.098632
18-0.167186-1.15830.126236
19-0.065734-0.45540.325432
200.2086251.44540.077422
21-0.234928-1.62760.055076
220.004810.03330.486777
230.2561491.77470.041148
24-0.318896-2.20940.015977
250.2474281.71420.046469
26-0.043049-0.29820.3834
27-0.10915-0.75620.226608
280.1099260.76160.225016
290.0358240.24820.402522
30-0.137071-0.94970.173523
310.1624091.12520.133049
32-0.10134-0.70210.243003
330.0466380.32310.374006
340.0253860.17590.430565
35-0.101221-0.70130.243257
360.04630.32080.374886

\begin{tabular}{lllllllll}
\hline
Autocorrelation Function \tabularnewline
Time lag k & ACF(k) & T-STAT & P-value \tabularnewline
1 & -0.487788 & -3.3795 & 0.000725 \tabularnewline
2 & 0.067217 & 0.4657 & 0.321771 \tabularnewline
3 & 0.392045 & 2.7162 & 0.004577 \tabularnewline
4 & -0.327154 & -2.2666 & 0.01398 \tabularnewline
5 & 0.096154 & 0.6662 & 0.254244 \tabularnewline
6 & 0.248398 & 1.721 & 0.04585 \tabularnewline
7 & -0.393011 & -2.7229 & 0.004498 \tabularnewline
8 & 0.23528 & 1.6301 & 0.054816 \tabularnewline
9 & 0.053482 & 0.3705 & 0.356307 \tabularnewline
10 & -0.280161 & -1.941 & 0.029071 \tabularnewline
11 & 0.265357 & 1.8384 & 0.036094 \tabularnewline
12 & -0.145572 & -1.0086 & 0.159124 \tabularnewline
13 & -0.157012 & -1.0878 & 0.141055 \tabularnewline
14 & 0.222879 & 1.5441 & 0.06456 \tabularnewline
15 & -0.112807 & -0.7816 & 0.219158 \tabularnewline
16 & -0.120318 & -0.8336 & 0.204322 \tabularnewline
17 & 0.188725 & 1.3075 & 0.098632 \tabularnewline
18 & -0.167186 & -1.1583 & 0.126236 \tabularnewline
19 & -0.065734 & -0.4554 & 0.325432 \tabularnewline
20 & 0.208625 & 1.4454 & 0.077422 \tabularnewline
21 & -0.234928 & -1.6276 & 0.055076 \tabularnewline
22 & 0.00481 & 0.0333 & 0.486777 \tabularnewline
23 & 0.256149 & 1.7747 & 0.041148 \tabularnewline
24 & -0.318896 & -2.2094 & 0.015977 \tabularnewline
25 & 0.247428 & 1.7142 & 0.046469 \tabularnewline
26 & -0.043049 & -0.2982 & 0.3834 \tabularnewline
27 & -0.10915 & -0.7562 & 0.226608 \tabularnewline
28 & 0.109926 & 0.7616 & 0.225016 \tabularnewline
29 & 0.035824 & 0.2482 & 0.402522 \tabularnewline
30 & -0.137071 & -0.9497 & 0.173523 \tabularnewline
31 & 0.162409 & 1.1252 & 0.133049 \tabularnewline
32 & -0.10134 & -0.7021 & 0.243003 \tabularnewline
33 & 0.046638 & 0.3231 & 0.374006 \tabularnewline
34 & 0.025386 & 0.1759 & 0.430565 \tabularnewline
35 & -0.101221 & -0.7013 & 0.243257 \tabularnewline
36 & 0.0463 & 0.3208 & 0.374886 \tabularnewline
\hline
\end{tabular}
%Source: https://freestatistics.org/blog/index.php?pk=68714&T=1

[TABLE]
[ROW][C]Autocorrelation Function[/C][/ROW]
[ROW][C]Time lag k[/C][C]ACF(k)[/C][C]T-STAT[/C][C]P-value[/C][/ROW]
[ROW][C]1[/C][C]-0.487788[/C][C]-3.3795[/C][C]0.000725[/C][/ROW]
[ROW][C]2[/C][C]0.067217[/C][C]0.4657[/C][C]0.321771[/C][/ROW]
[ROW][C]3[/C][C]0.392045[/C][C]2.7162[/C][C]0.004577[/C][/ROW]
[ROW][C]4[/C][C]-0.327154[/C][C]-2.2666[/C][C]0.01398[/C][/ROW]
[ROW][C]5[/C][C]0.096154[/C][C]0.6662[/C][C]0.254244[/C][/ROW]
[ROW][C]6[/C][C]0.248398[/C][C]1.721[/C][C]0.04585[/C][/ROW]
[ROW][C]7[/C][C]-0.393011[/C][C]-2.7229[/C][C]0.004498[/C][/ROW]
[ROW][C]8[/C][C]0.23528[/C][C]1.6301[/C][C]0.054816[/C][/ROW]
[ROW][C]9[/C][C]0.053482[/C][C]0.3705[/C][C]0.356307[/C][/ROW]
[ROW][C]10[/C][C]-0.280161[/C][C]-1.941[/C][C]0.029071[/C][/ROW]
[ROW][C]11[/C][C]0.265357[/C][C]1.8384[/C][C]0.036094[/C][/ROW]
[ROW][C]12[/C][C]-0.145572[/C][C]-1.0086[/C][C]0.159124[/C][/ROW]
[ROW][C]13[/C][C]-0.157012[/C][C]-1.0878[/C][C]0.141055[/C][/ROW]
[ROW][C]14[/C][C]0.222879[/C][C]1.5441[/C][C]0.06456[/C][/ROW]
[ROW][C]15[/C][C]-0.112807[/C][C]-0.7816[/C][C]0.219158[/C][/ROW]
[ROW][C]16[/C][C]-0.120318[/C][C]-0.8336[/C][C]0.204322[/C][/ROW]
[ROW][C]17[/C][C]0.188725[/C][C]1.3075[/C][C]0.098632[/C][/ROW]
[ROW][C]18[/C][C]-0.167186[/C][C]-1.1583[/C][C]0.126236[/C][/ROW]
[ROW][C]19[/C][C]-0.065734[/C][C]-0.4554[/C][C]0.325432[/C][/ROW]
[ROW][C]20[/C][C]0.208625[/C][C]1.4454[/C][C]0.077422[/C][/ROW]
[ROW][C]21[/C][C]-0.234928[/C][C]-1.6276[/C][C]0.055076[/C][/ROW]
[ROW][C]22[/C][C]0.00481[/C][C]0.0333[/C][C]0.486777[/C][/ROW]
[ROW][C]23[/C][C]0.256149[/C][C]1.7747[/C][C]0.041148[/C][/ROW]
[ROW][C]24[/C][C]-0.318896[/C][C]-2.2094[/C][C]0.015977[/C][/ROW]
[ROW][C]25[/C][C]0.247428[/C][C]1.7142[/C][C]0.046469[/C][/ROW]
[ROW][C]26[/C][C]-0.043049[/C][C]-0.2982[/C][C]0.3834[/C][/ROW]
[ROW][C]27[/C][C]-0.10915[/C][C]-0.7562[/C][C]0.226608[/C][/ROW]
[ROW][C]28[/C][C]0.109926[/C][C]0.7616[/C][C]0.225016[/C][/ROW]
[ROW][C]29[/C][C]0.035824[/C][C]0.2482[/C][C]0.402522[/C][/ROW]
[ROW][C]30[/C][C]-0.137071[/C][C]-0.9497[/C][C]0.173523[/C][/ROW]
[ROW][C]31[/C][C]0.162409[/C][C]1.1252[/C][C]0.133049[/C][/ROW]
[ROW][C]32[/C][C]-0.10134[/C][C]-0.7021[/C][C]0.243003[/C][/ROW]
[ROW][C]33[/C][C]0.046638[/C][C]0.3231[/C][C]0.374006[/C][/ROW]
[ROW][C]34[/C][C]0.025386[/C][C]0.1759[/C][C]0.430565[/C][/ROW]
[ROW][C]35[/C][C]-0.101221[/C][C]-0.7013[/C][C]0.243257[/C][/ROW]
[ROW][C]36[/C][C]0.0463[/C][C]0.3208[/C][C]0.374886[/C][/ROW]
[/TABLE]
Source: https://freestatistics.org/blog/index.php?pk=68714&T=1

Globally Unique Identifier (entire table): ba.freestatistics.org/blog/index.php?pk=68714&T=1

As an alternative you can also use a QR Code:  

The GUIDs for individual cells are displayed in the table below:

Autocorrelation Function
Time lag kACF(k)T-STATP-value
1-0.487788-3.37950.000725
20.0672170.46570.321771
30.3920452.71620.004577
4-0.327154-2.26660.01398
50.0961540.66620.254244
60.2483981.7210.04585
7-0.393011-2.72290.004498
80.235281.63010.054816
90.0534820.37050.356307
10-0.280161-1.9410.029071
110.2653571.83840.036094
12-0.145572-1.00860.159124
13-0.157012-1.08780.141055
140.2228791.54410.06456
15-0.112807-0.78160.219158
16-0.120318-0.83360.204322
170.1887251.30750.098632
18-0.167186-1.15830.126236
19-0.065734-0.45540.325432
200.2086251.44540.077422
21-0.234928-1.62760.055076
220.004810.03330.486777
230.2561491.77470.041148
24-0.318896-2.20940.015977
250.2474281.71420.046469
26-0.043049-0.29820.3834
27-0.10915-0.75620.226608
280.1099260.76160.225016
290.0358240.24820.402522
30-0.137071-0.94970.173523
310.1624091.12520.133049
32-0.10134-0.70210.243003
330.0466380.32310.374006
340.0253860.17590.430565
35-0.101221-0.70130.243257
360.04630.32080.374886


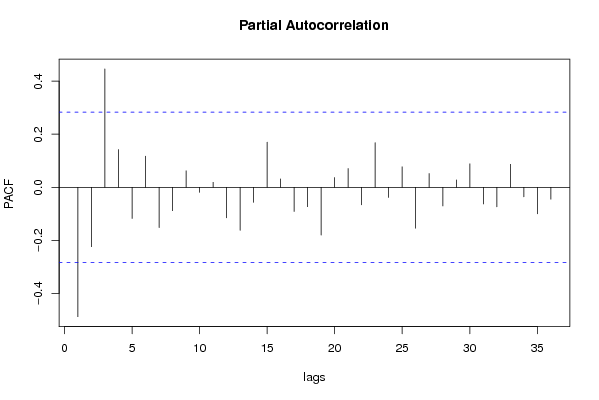
Partial Autocorrelation Function
Time lag kPACF(k)T-STATP-value
1-0.487788-3.37950.000725
2-0.224024-1.55210.063606
30.4461083.09070.00166
40.1423020.98590.164564
5-0.117622-0.81490.209575
60.1171970.8120.210411
7-0.152036-1.05330.14873
8-0.088388-0.61240.271593
90.0621450.43060.33436
10-0.018788-0.13020.448488
110.0186160.1290.448957
12-0.114959-0.79650.214844
13-0.162133-1.12330.13345
14-0.056676-0.39270.348155
150.1699951.17780.122349
160.0312090.21620.414866
17-0.091025-0.63060.265633
18-0.072986-0.50570.307704
19-0.180196-1.24840.108964
200.0364950.25280.400733
210.070650.48950.313367
22-0.066058-0.45770.32463
230.1679811.16380.125127
24-0.038236-0.26490.396108
250.0773870.53620.297165
26-0.154411-1.06980.145032
270.0518540.35930.360489
28-0.070238-0.48660.314371
290.0278630.1930.42387
300.0883360.6120.27171
31-0.062989-0.43640.332252
32-0.073631-0.51010.30615
330.086810.60140.27519
34-0.035839-0.24830.402482
35-0.100184-0.69410.245484
36-0.044972-0.31160.378358

\begin{tabular}{lllllllll}
\hline
Partial Autocorrelation Function \tabularnewline
Time lag k & PACF(k) & T-STAT & P-value \tabularnewline
1 & -0.487788 & -3.3795 & 0.000725 \tabularnewline
2 & -0.224024 & -1.5521 & 0.063606 \tabularnewline
3 & 0.446108 & 3.0907 & 0.00166 \tabularnewline
4 & 0.142302 & 0.9859 & 0.164564 \tabularnewline
5 & -0.117622 & -0.8149 & 0.209575 \tabularnewline
6 & 0.117197 & 0.812 & 0.210411 \tabularnewline
7 & -0.152036 & -1.0533 & 0.14873 \tabularnewline
8 & -0.088388 & -0.6124 & 0.271593 \tabularnewline
9 & 0.062145 & 0.4306 & 0.33436 \tabularnewline
10 & -0.018788 & -0.1302 & 0.448488 \tabularnewline
11 & 0.018616 & 0.129 & 0.448957 \tabularnewline
12 & -0.114959 & -0.7965 & 0.214844 \tabularnewline
13 & -0.162133 & -1.1233 & 0.13345 \tabularnewline
14 & -0.056676 & -0.3927 & 0.348155 \tabularnewline
15 & 0.169995 & 1.1778 & 0.122349 \tabularnewline
16 & 0.031209 & 0.2162 & 0.414866 \tabularnewline
17 & -0.091025 & -0.6306 & 0.265633 \tabularnewline
18 & -0.072986 & -0.5057 & 0.307704 \tabularnewline
19 & -0.180196 & -1.2484 & 0.108964 \tabularnewline
20 & 0.036495 & 0.2528 & 0.400733 \tabularnewline
21 & 0.07065 & 0.4895 & 0.313367 \tabularnewline
22 & -0.066058 & -0.4577 & 0.32463 \tabularnewline
23 & 0.167981 & 1.1638 & 0.125127 \tabularnewline
24 & -0.038236 & -0.2649 & 0.396108 \tabularnewline
25 & 0.077387 & 0.5362 & 0.297165 \tabularnewline
26 & -0.154411 & -1.0698 & 0.145032 \tabularnewline
27 & 0.051854 & 0.3593 & 0.360489 \tabularnewline
28 & -0.070238 & -0.4866 & 0.314371 \tabularnewline
29 & 0.027863 & 0.193 & 0.42387 \tabularnewline
30 & 0.088336 & 0.612 & 0.27171 \tabularnewline
31 & -0.062989 & -0.4364 & 0.332252 \tabularnewline
32 & -0.073631 & -0.5101 & 0.30615 \tabularnewline
33 & 0.08681 & 0.6014 & 0.27519 \tabularnewline
34 & -0.035839 & -0.2483 & 0.402482 \tabularnewline
35 & -0.100184 & -0.6941 & 0.245484 \tabularnewline
36 & -0.044972 & -0.3116 & 0.378358 \tabularnewline
\hline
\end{tabular}
%Source: https://freestatistics.org/blog/index.php?pk=68714&T=2

[TABLE]
[ROW][C]Partial Autocorrelation Function[/C][/ROW]
[ROW][C]Time lag k[/C][C]PACF(k)[/C][C]T-STAT[/C][C]P-value[/C][/ROW]
[ROW][C]1[/C][C]-0.487788[/C][C]-3.3795[/C][C]0.000725[/C][/ROW]
[ROW][C]2[/C][C]-0.224024[/C][C]-1.5521[/C][C]0.063606[/C][/ROW]
[ROW][C]3[/C][C]0.446108[/C][C]3.0907[/C][C]0.00166[/C][/ROW]
[ROW][C]4[/C][C]0.142302[/C][C]0.9859[/C][C]0.164564[/C][/ROW]
[ROW][C]5[/C][C]-0.117622[/C][C]-0.8149[/C][C]0.209575[/C][/ROW]
[ROW][C]6[/C][C]0.117197[/C][C]0.812[/C][C]0.210411[/C][/ROW]
[ROW][C]7[/C][C]-0.152036[/C][C]-1.0533[/C][C]0.14873[/C][/ROW]
[ROW][C]8[/C][C]-0.088388[/C][C]-0.6124[/C][C]0.271593[/C][/ROW]
[ROW][C]9[/C][C]0.062145[/C][C]0.4306[/C][C]0.33436[/C][/ROW]
[ROW][C]10[/C][C]-0.018788[/C][C]-0.1302[/C][C]0.448488[/C][/ROW]
[ROW][C]11[/C][C]0.018616[/C][C]0.129[/C][C]0.448957[/C][/ROW]
[ROW][C]12[/C][C]-0.114959[/C][C]-0.7965[/C][C]0.214844[/C][/ROW]
[ROW][C]13[/C][C]-0.162133[/C][C]-1.1233[/C][C]0.13345[/C][/ROW]
[ROW][C]14[/C][C]-0.056676[/C][C]-0.3927[/C][C]0.348155[/C][/ROW]
[ROW][C]15[/C][C]0.169995[/C][C]1.1778[/C][C]0.122349[/C][/ROW]
[ROW][C]16[/C][C]0.031209[/C][C]0.2162[/C][C]0.414866[/C][/ROW]
[ROW][C]17[/C][C]-0.091025[/C][C]-0.6306[/C][C]0.265633[/C][/ROW]
[ROW][C]18[/C][C]-0.072986[/C][C]-0.5057[/C][C]0.307704[/C][/ROW]
[ROW][C]19[/C][C]-0.180196[/C][C]-1.2484[/C][C]0.108964[/C][/ROW]
[ROW][C]20[/C][C]0.036495[/C][C]0.2528[/C][C]0.400733[/C][/ROW]
[ROW][C]21[/C][C]0.07065[/C][C]0.4895[/C][C]0.313367[/C][/ROW]
[ROW][C]22[/C][C]-0.066058[/C][C]-0.4577[/C][C]0.32463[/C][/ROW]
[ROW][C]23[/C][C]0.167981[/C][C]1.1638[/C][C]0.125127[/C][/ROW]
[ROW][C]24[/C][C]-0.038236[/C][C]-0.2649[/C][C]0.396108[/C][/ROW]
[ROW][C]25[/C][C]0.077387[/C][C]0.5362[/C][C]0.297165[/C][/ROW]
[ROW][C]26[/C][C]-0.154411[/C][C]-1.0698[/C][C]0.145032[/C][/ROW]
[ROW][C]27[/C][C]0.051854[/C][C]0.3593[/C][C]0.360489[/C][/ROW]
[ROW][C]28[/C][C]-0.070238[/C][C]-0.4866[/C][C]0.314371[/C][/ROW]
[ROW][C]29[/C][C]0.027863[/C][C]0.193[/C][C]0.42387[/C][/ROW]
[ROW][C]30[/C][C]0.088336[/C][C]0.612[/C][C]0.27171[/C][/ROW]
[ROW][C]31[/C][C]-0.062989[/C][C]-0.4364[/C][C]0.332252[/C][/ROW]
[ROW][C]32[/C][C]-0.073631[/C][C]-0.5101[/C][C]0.30615[/C][/ROW]
[ROW][C]33[/C][C]0.08681[/C][C]0.6014[/C][C]0.27519[/C][/ROW]
[ROW][C]34[/C][C]-0.035839[/C][C]-0.2483[/C][C]0.402482[/C][/ROW]
[ROW][C]35[/C][C]-0.100184[/C][C]-0.6941[/C][C]0.245484[/C][/ROW]
[ROW][C]36[/C][C]-0.044972[/C][C]-0.3116[/C][C]0.378358[/C][/ROW]
[/TABLE]
Source: https://freestatistics.org/blog/index.php?pk=68714&T=2

Globally Unique Identifier (entire table): ba.freestatistics.org/blog/index.php?pk=68714&T=2

As an alternative you can also use a QR Code:  

The GUIDs for individual cells are displayed in the table below:

Partial Autocorrelation Function
Time lag kPACF(k)T-STATP-value
1-0.487788-3.37950.000725
2-0.224024-1.55210.063606
30.4461083.09070.00166
40.1423020.98590.164564
5-0.117622-0.81490.209575
60.1171970.8120.210411
7-0.152036-1.05330.14873
8-0.088388-0.61240.271593
90.0621450.43060.33436
10-0.018788-0.13020.448488
110.0186160.1290.448957
12-0.114959-0.79650.214844
13-0.162133-1.12330.13345
14-0.056676-0.39270.348155
150.1699951.17780.122349
160.0312090.21620.414866
17-0.091025-0.63060.265633
18-0.072986-0.50570.307704
19-0.180196-1.24840.108964
200.0364950.25280.400733
210.070650.48950.313367
22-0.066058-0.45770.32463
230.1679811.16380.125127
24-0.038236-0.26490.396108
250.0773870.53620.297165
26-0.154411-1.06980.145032
270.0518540.35930.360489
28-0.070238-0.48660.314371
290.0278630.1930.42387
300.0883360.6120.27171
31-0.062989-0.43640.332252
32-0.073631-0.51010.30615
330.086810.60140.27519
34-0.035839-0.24830.402482
35-0.100184-0.69410.245484
36-0.044972-0.31160.378358


Parameters (Session):
par1 = 36 ; par2 = 1 ; par3 = 1 ; par4 = 1 ; par5 = 12 ; par6 = MA ; par7 = 0.95 ;
Parameters (R input):
par1 = 36 ; par2 = 1 ; par3 = 1 ; par4 = 1 ; par5 = 12 ; par6 = MA ; par7 = 0.95 ;
R code (references can be found in the software module):
if (par1 == 'Default') {
par1 = 10*log10(length(x))
} else {
par1 <- as.numeric(par1)
}
par2 <- as.numeric(par2)
par3 <- as.numeric(par3)
par4 <- as.numeric(par4)
par5 <- as.numeric(par5)
if (par6 == 'White Noise') par6 <- 'white' else par6 <- 'ma'
par7 <- as.numeric(par7)
if (par2 == 0) {
x <- log(x)
} else {
x <- (x ^ par2 - 1) / par2
}
if (par3 > 0) x <- diff(x,lag=1,difference=par3)
if (par4 > 0) x <- diff(x,lag=par5,difference=par4)
bitmap(file='pic1.png')
racf <- acf(x, par1, main='Autocorrelation', xlab='time lag', ylab='ACF', ci.type=par6, ci=par7, sub=paste('(lambda=',par2,', d=',par3,', D=',par4,', CI=', par7, ', CI type=',par6,')',sep=''))
dev.off()
bitmap(file='pic2.png')
rpacf <- pacf(x,par1,main='Partial Autocorrelation',xlab='lags',ylab='PACF')
dev.off()
(myacf <- c(racf$acf))
(mypacf <- c(rpacf$acf))
lengthx <- length(x)
sqrtn <- sqrt(lengthx)
load(file='createtable')
a<-table.start()
a<-table.row.start(a)
a<-table.element(a,'Autocorrelation Function',4,TRUE)
a<-table.row.end(a)
a<-table.row.start(a)
a<-table.element(a,'Time lag k',header=TRUE)
a<-table.element(a,hyperlink('basics.htm','ACF(k)','click here for more information about the Autocorrelation Function'),header=TRUE)
a<-table.element(a,'T-STAT',header=TRUE)
a<-table.element(a,'P-value',header=TRUE)
a<-table.row.end(a)
for (i in 2:(par1+1)) {
a<-table.row.start(a)
a<-table.element(a,i-1,header=TRUE)
a<-table.element(a,round(myacf[i],6))
mytstat <- myacf[i]*sqrtn
a<-table.element(a,round(mytstat,4))
a<-table.element(a,round(1-pt(abs(mytstat),lengthx),6))
a<-table.row.end(a)
}
a<-table.end(a)
table.save(a,file='mytable.tab')
a<-table.start()
a<-table.row.start(a)
a<-table.element(a,'Partial Autocorrelation Function',4,TRUE)
a<-table.row.end(a)
a<-table.row.start(a)
a<-table.element(a,'Time lag k',header=TRUE)
a<-table.element(a,hyperlink('basics.htm','PACF(k)','click here for more information about the Partial Autocorrelation Function'),header=TRUE)
a<-table.element(a,'T-STAT',header=TRUE)
a<-table.element(a,'P-value',header=TRUE)
a<-table.row.end(a)
for (i in 1:par1) {
a<-table.row.start(a)
a<-table.element(a,i,header=TRUE)
a<-table.element(a,round(mypacf[i],6))
mytstat <- mypacf[i]*sqrtn
a<-table.element(a,round(mytstat,4))
a<-table.element(a,round(1-pt(abs(mytstat),lengthx),6))
a<-table.row.end(a)
}
a<-table.end(a)
table.save(a,file='mytable1.tab')