Free Statistics

of Irreproducible Research!

Author's title

Author*The author of this computation has been verified*
R Software Modulerwasp_smp.wasp
Title produced by softwareStandard Deviation-Mean Plot
Date of computationThu, 17 Dec 2009 03:55:11 -0700
Cite this page as followsStatistical Computations at FreeStatistics.org, Office for Research Development and Education, URL https://freestatistics.org/blog/index.php?v=date/2009/Dec/17/t12610474426tnm3yfuja6ime2.htm/, Retrieved Tue, 30 Apr 2024 06:00:09 +0000
Statistical Computations at FreeStatistics.org, Office for Research Development and Education, URL https://freestatistics.org/blog/index.php?pk=68721, Retrieved Tue, 30 Apr 2024 06:00:09 +0000
QR Codes:

Original text written by user:
IsPrivate?No (this computation is public)
User-defined keywords
Estimated Impact92
Family? (F = Feedback message, R = changed R code, M = changed R Module, P = changed Parameters, D = changed Data)
-     [Univariate Data Series] [data set] [2008-12-01 19:54:57] [b98453cac15ba1066b407e146608df68]
- RMP   [Standard Deviation-Mean Plot] [] [2009-11-27 14:40:44] [b98453cac15ba1066b407e146608df68]
-    D      [Standard Deviation-Mean Plot] [] [2009-12-17 10:55:11] [e76c6d261190c0179bc6006a5cdb804c] [Current]
Feedback Forum

Post a new message
Dataseries X:
359640
364080
364080
359640
359640
359640
359640
359640
364080
368520
372960
377400
406780
402050
392590
368940
368940
378400
406780
420970
420970
406780
392590
392590
394250
399000
403750
399000
408500
403750
403750
399000
403750
403750
403750
403750
405450
405450
405450
405450
410220
400680
386370
381600
381600
381600
381600
376830
381420
381420
386310
396090
391200
371640
356970
342300
332520
342300
347190
352080
357130
347070
337010
337010
331980


Summary of computational transaction
Raw Inputview raw input (R code)
Raw Outputview raw output of R engine
Computing time1 seconds
R Server'Gwilym Jenkins' @ 72.249.127.135

\begin{tabular}{lllllllll}
\hline
Summary of computational transaction \tabularnewline
Raw Input & view raw input (R code)  \tabularnewline
Raw Output & view raw output of R engine  \tabularnewline
Computing time & 1 seconds \tabularnewline
R Server & 'Gwilym Jenkins' @ 72.249.127.135 \tabularnewline
\hline
\end{tabular}
%Source: https://freestatistics.org/blog/index.php?pk=68721&T=0

[TABLE]
[ROW][C]Summary of computational transaction[/C][/ROW]
[ROW][C]Raw Input[/C][C]view raw input (R code) [/C][/ROW]
[ROW][C]Raw Output[/C][C]view raw output of R engine [/C][/ROW]
[ROW][C]Computing time[/C][C]1 seconds[/C][/ROW]
[ROW][C]R Server[/C][C]'Gwilym Jenkins' @ 72.249.127.135[/C][/ROW]
[/TABLE]
Source: https://freestatistics.org/blog/index.php?pk=68721&T=0

Globally Unique Identifier (entire table): ba.freestatistics.org/blog/index.php?pk=68721&T=0

As an alternative you can also use a QR Code:  

The GUIDs for individual cells are displayed in the table below:

Summary of computational transaction
Raw Inputview raw input (R code)
Raw Outputview raw output of R engine
Computing time1 seconds
R Server'Gwilym Jenkins' @ 72.249.127.135


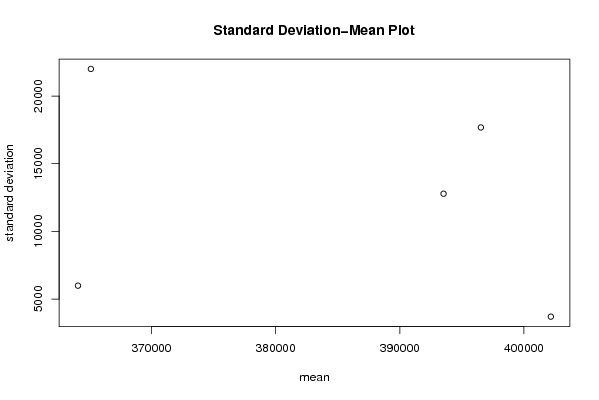
Standard Deviation-Mean Plot
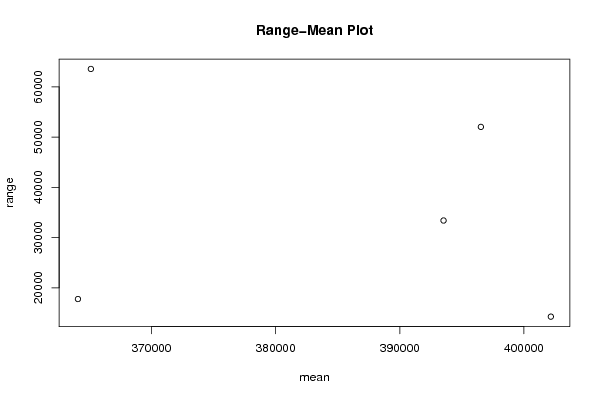
SectionMeanStandard DeviationRange
13640805986.8947786735917760
2396531.66666666717678.875341303152030
3402166.6666666673697.8699847672314250
439352512783.082214751333390
536512022000.883453336063570

\begin{tabular}{lllllllll}
\hline
Standard Deviation-Mean Plot \tabularnewline
Section & Mean & Standard Deviation & Range \tabularnewline
1 & 364080 & 5986.89477867359 & 17760 \tabularnewline
2 & 396531.666666667 & 17678.8753413031 & 52030 \tabularnewline
3 & 402166.666666667 & 3697.86998476723 & 14250 \tabularnewline
4 & 393525 & 12783.0822147513 & 33390 \tabularnewline
5 & 365120 & 22000.8834533360 & 63570 \tabularnewline
\hline
\end{tabular}
%Source: https://freestatistics.org/blog/index.php?pk=68721&T=1

[TABLE]
[ROW][C]Standard Deviation-Mean Plot[/C][/ROW]
[ROW][C]Section[/C][C]Mean[/C][C]Standard Deviation[/C][C]Range[/C][/ROW]
[ROW][C]1[/C][C]364080[/C][C]5986.89477867359[/C][C]17760[/C][/ROW]
[ROW][C]2[/C][C]396531.666666667[/C][C]17678.8753413031[/C][C]52030[/C][/ROW]
[ROW][C]3[/C][C]402166.666666667[/C][C]3697.86998476723[/C][C]14250[/C][/ROW]
[ROW][C]4[/C][C]393525[/C][C]12783.0822147513[/C][C]33390[/C][/ROW]
[ROW][C]5[/C][C]365120[/C][C]22000.8834533360[/C][C]63570[/C][/ROW]
[/TABLE]
Source: https://freestatistics.org/blog/index.php?pk=68721&T=1

Globally Unique Identifier (entire table): ba.freestatistics.org/blog/index.php?pk=68721&T=1

As an alternative you can also use a QR Code:  

The GUIDs for individual cells are displayed in the table below:

Standard Deviation-Mean Plot
SectionMeanStandard DeviationRange
13640805986.8947786735917760
2396531.66666666717678.875341303152030
3402166.6666666673697.8699847672314250
439352512783.082214751333390
536512022000.883453336063570


Regression: S.E.(k) = alpha + beta * Mean(k)
alpha53393.3719935625
beta-0.106597671966258
S.D.0.235779462714002
T-STAT-0.452107536166372
p-value0.681880058451579

\begin{tabular}{lllllllll}
\hline
Regression: S.E.(k) = alpha + beta * Mean(k) \tabularnewline
alpha & 53393.3719935625 \tabularnewline
beta & -0.106597671966258 \tabularnewline
S.D. & 0.235779462714002 \tabularnewline
T-STAT & -0.452107536166372 \tabularnewline
p-value & 0.681880058451579 \tabularnewline
\hline
\end{tabular}
%Source: https://freestatistics.org/blog/index.php?pk=68721&T=2

[TABLE]
[ROW][C]Regression: S.E.(k) = alpha + beta * Mean(k)[/C][/ROW]
[ROW][C]alpha[/C][C]53393.3719935625[/C][/ROW]
[ROW][C]beta[/C][C]-0.106597671966258[/C][/ROW]
[ROW][C]S.D.[/C][C]0.235779462714002[/C][/ROW]
[ROW][C]T-STAT[/C][C]-0.452107536166372[/C][/ROW]
[ROW][C]p-value[/C][C]0.681880058451579[/C][/ROW]
[/TABLE]
Source: https://freestatistics.org/blog/index.php?pk=68721&T=2

Globally Unique Identifier (entire table): ba.freestatistics.org/blog/index.php?pk=68721&T=2

As an alternative you can also use a QR Code:  

The GUIDs for individual cells are displayed in the table below:

Regression: S.E.(k) = alpha + beta * Mean(k)
alpha53393.3719935625
beta-0.106597671966258
S.D.0.235779462714002
T-STAT-0.452107536166372
p-value0.681880058451579


Regression: ln S.E.(k) = alpha + beta * ln Mean(k)
alpha57.1347832845299
beta-3.72564901896933
S.D.8.81151753123403
T-STAT-0.422815820971029
p-value0.700907013330326
Lambda4.72564901896933

\begin{tabular}{lllllllll}
\hline
Regression: ln S.E.(k) = alpha + beta * ln Mean(k) \tabularnewline
alpha & 57.1347832845299 \tabularnewline
beta & -3.72564901896933 \tabularnewline
S.D. & 8.81151753123403 \tabularnewline
T-STAT & -0.422815820971029 \tabularnewline
p-value & 0.700907013330326 \tabularnewline
Lambda & 4.72564901896933 \tabularnewline
\hline
\end{tabular}
%Source: https://freestatistics.org/blog/index.php?pk=68721&T=3

[TABLE]
[ROW][C]Regression: ln S.E.(k) = alpha + beta * ln Mean(k)[/C][/ROW]
[ROW][C]alpha[/C][C]57.1347832845299[/C][/ROW]
[ROW][C]beta[/C][C]-3.72564901896933[/C][/ROW]
[ROW][C]S.D.[/C][C]8.81151753123403[/C][/ROW]
[ROW][C]T-STAT[/C][C]-0.422815820971029[/C][/ROW]
[ROW][C]p-value[/C][C]0.700907013330326[/C][/ROW]
[ROW][C]Lambda[/C][C]4.72564901896933[/C][/ROW]
[/TABLE]
Source: https://freestatistics.org/blog/index.php?pk=68721&T=3

Globally Unique Identifier (entire table): ba.freestatistics.org/blog/index.php?pk=68721&T=3

As an alternative you can also use a QR Code:  

The GUIDs for individual cells are displayed in the table below:

Regression: ln S.E.(k) = alpha + beta * ln Mean(k)
alpha57.1347832845299
beta-3.72564901896933
S.D.8.81151753123403
T-STAT-0.422815820971029
p-value0.700907013330326
Lambda4.72564901896933


Parameters (Session):
par1 = 12 ;
Parameters (R input):
par1 = 12 ;
R code (references can be found in the software module):
par1 <- as.numeric(par1)
(n <- length(x))
(np <- floor(n / par1))
arr <- array(NA,dim=c(par1,np))
j <- 0
k <- 1
for (i in 1:(np*par1))
{
j = j + 1
arr[j,k] <- x[i]
if (j == par1) {
j = 0
k=k+1
}
}
arr
arr.mean <- array(NA,dim=np)
arr.sd <- array(NA,dim=np)
arr.range <- array(NA,dim=np)
for (j in 1:np)
{
arr.mean[j] <- mean(arr[,j],na.rm=TRUE)
arr.sd[j] <- sd(arr[,j],na.rm=TRUE)
arr.range[j] <- max(arr[,j],na.rm=TRUE) - min(arr[,j],na.rm=TRUE)
}
arr.mean
arr.sd
arr.range
(lm1 <- lm(arr.sd~arr.mean))
(lnlm1 <- lm(log(arr.sd)~log(arr.mean)))
(lm2 <- lm(arr.range~arr.mean))
bitmap(file='test1.png')
plot(arr.mean,arr.sd,main='Standard Deviation-Mean Plot',xlab='mean',ylab='standard deviation')
dev.off()
bitmap(file='test2.png')
plot(arr.mean,arr.range,main='Range-Mean Plot',xlab='mean',ylab='range')
dev.off()
load(file='createtable')
a<-table.start()
a<-table.row.start(a)
a<-table.element(a,'Standard Deviation-Mean Plot',4,TRUE)
a<-table.row.end(a)
a<-table.row.start(a)
a<-table.element(a,'Section',header=TRUE)
a<-table.element(a,'Mean',header=TRUE)
a<-table.element(a,'Standard Deviation',header=TRUE)
a<-table.element(a,'Range',header=TRUE)
a<-table.row.end(a)
for (j in 1:np) {
a<-table.row.start(a)
a<-table.element(a,j,header=TRUE)
a<-table.element(a,arr.mean[j])
a<-table.element(a,arr.sd[j] )
a<-table.element(a,arr.range[j] )
a<-table.row.end(a)
}
a<-table.end(a)
table.save(a,file='mytable.tab')
a<-table.start()
a<-table.row.start(a)
a<-table.element(a,'Regression: S.E.(k) = alpha + beta * Mean(k)',2,TRUE)
a<-table.row.end(a)
a<-table.row.start(a)
a<-table.element(a,'alpha',header=TRUE)
a<-table.element(a,lm1$coefficients[[1]])
a<-table.row.end(a)
a<-table.row.start(a)
a<-table.element(a,'beta',header=TRUE)
a<-table.element(a,lm1$coefficients[[2]])
a<-table.row.end(a)
a<-table.row.start(a)
a<-table.element(a,'S.D.',header=TRUE)
a<-table.element(a,summary(lm1)$coefficients[2,2])
a<-table.row.end(a)
a<-table.row.start(a)
a<-table.element(a,'T-STAT',header=TRUE)
a<-table.element(a,summary(lm1)$coefficients[2,3])
a<-table.row.end(a)
a<-table.row.start(a)
a<-table.element(a,'p-value',header=TRUE)
a<-table.element(a,summary(lm1)$coefficients[2,4])
a<-table.row.end(a)
a<-table.end(a)
table.save(a,file='mytable1.tab')
a<-table.start()
a<-table.row.start(a)
a<-table.element(a,'Regression: ln S.E.(k) = alpha + beta * ln Mean(k)',2,TRUE)
a<-table.row.end(a)
a<-table.row.start(a)
a<-table.element(a,'alpha',header=TRUE)
a<-table.element(a,lnlm1$coefficients[[1]])
a<-table.row.end(a)
a<-table.row.start(a)
a<-table.element(a,'beta',header=TRUE)
a<-table.element(a,lnlm1$coefficients[[2]])
a<-table.row.end(a)
a<-table.row.start(a)
a<-table.element(a,'S.D.',header=TRUE)
a<-table.element(a,summary(lnlm1)$coefficients[2,2])
a<-table.row.end(a)
a<-table.row.start(a)
a<-table.element(a,'T-STAT',header=TRUE)
a<-table.element(a,summary(lnlm1)$coefficients[2,3])
a<-table.row.end(a)
a<-table.row.start(a)
a<-table.element(a,'p-value',header=TRUE)
a<-table.element(a,summary(lnlm1)$coefficients[2,4])
a<-table.row.end(a)
a<-table.row.start(a)
a<-table.element(a,'Lambda',header=TRUE)
a<-table.element(a,1-lnlm1$coefficients[[2]])
a<-table.row.end(a)
a<-table.end(a)
table.save(a,file='mytable2.tab')