Free Statistics

of Irreproducible Research!

Author's title

Author*The author of this computation has been verified*
R Software Modulerwasp_autocorrelation.wasp
Title produced by software(Partial) Autocorrelation Function
Date of computationThu, 17 Dec 2009 04:00:45 -0700
Cite this page as followsStatistical Computations at FreeStatistics.org, Office for Research Development and Education, URL https://freestatistics.org/blog/index.php?v=date/2009/Dec/17/t1261047681ho9ecuht3myjr0o.htm/, Retrieved Tue, 30 Apr 2024 06:46:53 +0000
Statistical Computations at FreeStatistics.org, Office for Research Development and Education, URL https://freestatistics.org/blog/index.php?pk=68729, Retrieved Tue, 30 Apr 2024 06:46:53 +0000
QR Codes:

Original text written by user:
IsPrivate?No (this computation is public)
User-defined keywords
Estimated Impact90
Family? (F = Feedback message, R = changed R code, M = changed R Module, P = changed Parameters, D = changed Data)
-     [Univariate Data Series] [data set] [2008-12-01 19:54:57] [b98453cac15ba1066b407e146608df68]
- RMP   [(Partial) Autocorrelation Function] [] [2009-11-27 14:46:03] [b98453cac15ba1066b407e146608df68]
-    D      [(Partial) Autocorrelation Function] [] [2009-12-17 11:00:45] [e76c6d261190c0179bc6006a5cdb804c] [Current]
Feedback Forum

Post a new message
Dataseries X:
359640
364080
364080
359640
359640
359640
359640
359640
364080
368520
372960
377400
406780
402050
392590
368940
368940
378400
406780
420970
420970
406780
392590
392590
394250
399000
403750
399000
408500
403750
403750
399000
403750
403750
403750
403750
405450
405450
405450
405450
410220
400680
386370
381600
381600
381600
381600
376830
381420
381420
386310
396090
391200
371640
356970
342300
332520
342300
347190
352080
357130
347070
337010
337010
331980


Summary of computational transaction
Raw Inputview raw input (R code)
Raw Outputview raw output of R engine
Computing time2 seconds
R Server'Gwilym Jenkins' @ 72.249.127.135

\begin{tabular}{lllllllll}
\hline
Summary of computational transaction \tabularnewline
Raw Input & view raw input (R code)  \tabularnewline
Raw Output & view raw output of R engine  \tabularnewline
Computing time & 2 seconds \tabularnewline
R Server & 'Gwilym Jenkins' @ 72.249.127.135 \tabularnewline
\hline
\end{tabular}
%Source: https://freestatistics.org/blog/index.php?pk=68729&T=0

[TABLE]
[ROW][C]Summary of computational transaction[/C][/ROW]
[ROW][C]Raw Input[/C][C]view raw input (R code) [/C][/ROW]
[ROW][C]Raw Output[/C][C]view raw output of R engine [/C][/ROW]
[ROW][C]Computing time[/C][C]2 seconds[/C][/ROW]
[ROW][C]R Server[/C][C]'Gwilym Jenkins' @ 72.249.127.135[/C][/ROW]
[/TABLE]
Source: https://freestatistics.org/blog/index.php?pk=68729&T=0

Globally Unique Identifier (entire table): ba.freestatistics.org/blog/index.php?pk=68729&T=0

As an alternative you can also use a QR Code:  

The GUIDs for individual cells are displayed in the table below:

Summary of computational transaction
Raw Inputview raw input (R code)
Raw Outputview raw output of R engine
Computing time2 seconds
R Server'Gwilym Jenkins' @ 72.249.127.135


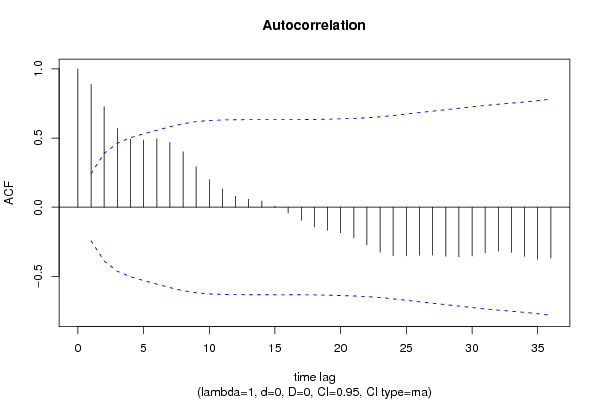
Autocorrelation Function
Time lag kACF(k)T-STATP-value
10.8868657.15010
20.7268355.85990
30.5712084.60521e-05
40.4926843.97219e-05
50.4854313.91370.00011
60.4955363.99518.4e-05
70.4686363.77830.000173
80.4005673.22950.000973
90.2928922.36140.010608
100.1988221.6030.056897
110.1308421.05490.147693
120.0787360.63480.263898
130.0576090.46450.321937
140.0446270.35980.360082
150.0077250.06230.475266
16-0.041853-0.33740.36844
17-0.094748-0.76390.223851
18-0.141976-1.14460.128276
19-0.16655-1.34280.092008
20-0.184726-1.48930.070621
21-0.221353-1.78460.039496
22-0.270905-2.18410.016284
23-0.324791-2.61850.005488
24-0.350975-2.82970.003096
25-0.351521-2.83410.003058
26-0.348021-2.80580.003307
27-0.346148-2.79070.003448
28-0.354613-2.8590.002853
29-0.358948-2.89390.002587
30-0.352411-2.84120.002998
31-0.329408-2.65580.004971
32-0.317053-2.55620.006465
33-0.326276-2.63050.005317
34-0.355675-2.86750.002786
35-0.376452-3.03510.001728
36-0.367978-2.96670.002104

\begin{tabular}{lllllllll}
\hline
Autocorrelation Function \tabularnewline
Time lag k & ACF(k) & T-STAT & P-value \tabularnewline
1 & 0.886865 & 7.1501 & 0 \tabularnewline
2 & 0.726835 & 5.8599 & 0 \tabularnewline
3 & 0.571208 & 4.6052 & 1e-05 \tabularnewline
4 & 0.492684 & 3.9721 & 9e-05 \tabularnewline
5 & 0.485431 & 3.9137 & 0.00011 \tabularnewline
6 & 0.495536 & 3.9951 & 8.4e-05 \tabularnewline
7 & 0.468636 & 3.7783 & 0.000173 \tabularnewline
8 & 0.400567 & 3.2295 & 0.000973 \tabularnewline
9 & 0.292892 & 2.3614 & 0.010608 \tabularnewline
10 & 0.198822 & 1.603 & 0.056897 \tabularnewline
11 & 0.130842 & 1.0549 & 0.147693 \tabularnewline
12 & 0.078736 & 0.6348 & 0.263898 \tabularnewline
13 & 0.057609 & 0.4645 & 0.321937 \tabularnewline
14 & 0.044627 & 0.3598 & 0.360082 \tabularnewline
15 & 0.007725 & 0.0623 & 0.475266 \tabularnewline
16 & -0.041853 & -0.3374 & 0.36844 \tabularnewline
17 & -0.094748 & -0.7639 & 0.223851 \tabularnewline
18 & -0.141976 & -1.1446 & 0.128276 \tabularnewline
19 & -0.16655 & -1.3428 & 0.092008 \tabularnewline
20 & -0.184726 & -1.4893 & 0.070621 \tabularnewline
21 & -0.221353 & -1.7846 & 0.039496 \tabularnewline
22 & -0.270905 & -2.1841 & 0.016284 \tabularnewline
23 & -0.324791 & -2.6185 & 0.005488 \tabularnewline
24 & -0.350975 & -2.8297 & 0.003096 \tabularnewline
25 & -0.351521 & -2.8341 & 0.003058 \tabularnewline
26 & -0.348021 & -2.8058 & 0.003307 \tabularnewline
27 & -0.346148 & -2.7907 & 0.003448 \tabularnewline
28 & -0.354613 & -2.859 & 0.002853 \tabularnewline
29 & -0.358948 & -2.8939 & 0.002587 \tabularnewline
30 & -0.352411 & -2.8412 & 0.002998 \tabularnewline
31 & -0.329408 & -2.6558 & 0.004971 \tabularnewline
32 & -0.317053 & -2.5562 & 0.006465 \tabularnewline
33 & -0.326276 & -2.6305 & 0.005317 \tabularnewline
34 & -0.355675 & -2.8675 & 0.002786 \tabularnewline
35 & -0.376452 & -3.0351 & 0.001728 \tabularnewline
36 & -0.367978 & -2.9667 & 0.002104 \tabularnewline
\hline
\end{tabular}
%Source: https://freestatistics.org/blog/index.php?pk=68729&T=1

[TABLE]
[ROW][C]Autocorrelation Function[/C][/ROW]
[ROW][C]Time lag k[/C][C]ACF(k)[/C][C]T-STAT[/C][C]P-value[/C][/ROW]
[ROW][C]1[/C][C]0.886865[/C][C]7.1501[/C][C]0[/C][/ROW]
[ROW][C]2[/C][C]0.726835[/C][C]5.8599[/C][C]0[/C][/ROW]
[ROW][C]3[/C][C]0.571208[/C][C]4.6052[/C][C]1e-05[/C][/ROW]
[ROW][C]4[/C][C]0.492684[/C][C]3.9721[/C][C]9e-05[/C][/ROW]
[ROW][C]5[/C][C]0.485431[/C][C]3.9137[/C][C]0.00011[/C][/ROW]
[ROW][C]6[/C][C]0.495536[/C][C]3.9951[/C][C]8.4e-05[/C][/ROW]
[ROW][C]7[/C][C]0.468636[/C][C]3.7783[/C][C]0.000173[/C][/ROW]
[ROW][C]8[/C][C]0.400567[/C][C]3.2295[/C][C]0.000973[/C][/ROW]
[ROW][C]9[/C][C]0.292892[/C][C]2.3614[/C][C]0.010608[/C][/ROW]
[ROW][C]10[/C][C]0.198822[/C][C]1.603[/C][C]0.056897[/C][/ROW]
[ROW][C]11[/C][C]0.130842[/C][C]1.0549[/C][C]0.147693[/C][/ROW]
[ROW][C]12[/C][C]0.078736[/C][C]0.6348[/C][C]0.263898[/C][/ROW]
[ROW][C]13[/C][C]0.057609[/C][C]0.4645[/C][C]0.321937[/C][/ROW]
[ROW][C]14[/C][C]0.044627[/C][C]0.3598[/C][C]0.360082[/C][/ROW]
[ROW][C]15[/C][C]0.007725[/C][C]0.0623[/C][C]0.475266[/C][/ROW]
[ROW][C]16[/C][C]-0.041853[/C][C]-0.3374[/C][C]0.36844[/C][/ROW]
[ROW][C]17[/C][C]-0.094748[/C][C]-0.7639[/C][C]0.223851[/C][/ROW]
[ROW][C]18[/C][C]-0.141976[/C][C]-1.1446[/C][C]0.128276[/C][/ROW]
[ROW][C]19[/C][C]-0.16655[/C][C]-1.3428[/C][C]0.092008[/C][/ROW]
[ROW][C]20[/C][C]-0.184726[/C][C]-1.4893[/C][C]0.070621[/C][/ROW]
[ROW][C]21[/C][C]-0.221353[/C][C]-1.7846[/C][C]0.039496[/C][/ROW]
[ROW][C]22[/C][C]-0.270905[/C][C]-2.1841[/C][C]0.016284[/C][/ROW]
[ROW][C]23[/C][C]-0.324791[/C][C]-2.6185[/C][C]0.005488[/C][/ROW]
[ROW][C]24[/C][C]-0.350975[/C][C]-2.8297[/C][C]0.003096[/C][/ROW]
[ROW][C]25[/C][C]-0.351521[/C][C]-2.8341[/C][C]0.003058[/C][/ROW]
[ROW][C]26[/C][C]-0.348021[/C][C]-2.8058[/C][C]0.003307[/C][/ROW]
[ROW][C]27[/C][C]-0.346148[/C][C]-2.7907[/C][C]0.003448[/C][/ROW]
[ROW][C]28[/C][C]-0.354613[/C][C]-2.859[/C][C]0.002853[/C][/ROW]
[ROW][C]29[/C][C]-0.358948[/C][C]-2.8939[/C][C]0.002587[/C][/ROW]
[ROW][C]30[/C][C]-0.352411[/C][C]-2.8412[/C][C]0.002998[/C][/ROW]
[ROW][C]31[/C][C]-0.329408[/C][C]-2.6558[/C][C]0.004971[/C][/ROW]
[ROW][C]32[/C][C]-0.317053[/C][C]-2.5562[/C][C]0.006465[/C][/ROW]
[ROW][C]33[/C][C]-0.326276[/C][C]-2.6305[/C][C]0.005317[/C][/ROW]
[ROW][C]34[/C][C]-0.355675[/C][C]-2.8675[/C][C]0.002786[/C][/ROW]
[ROW][C]35[/C][C]-0.376452[/C][C]-3.0351[/C][C]0.001728[/C][/ROW]
[ROW][C]36[/C][C]-0.367978[/C][C]-2.9667[/C][C]0.002104[/C][/ROW]
[/TABLE]
Source: https://freestatistics.org/blog/index.php?pk=68729&T=1

Globally Unique Identifier (entire table): ba.freestatistics.org/blog/index.php?pk=68729&T=1

As an alternative you can also use a QR Code:  

The GUIDs for individual cells are displayed in the table below:

Autocorrelation Function
Time lag kACF(k)T-STATP-value
10.8868657.15010
20.7268355.85990
30.5712084.60521e-05
40.4926843.97219e-05
50.4854313.91370.00011
60.4955363.99518.4e-05
70.4686363.77830.000173
80.4005673.22950.000973
90.2928922.36140.010608
100.1988221.6030.056897
110.1308421.05490.147693
120.0787360.63480.263898
130.0576090.46450.321937
140.0446270.35980.360082
150.0077250.06230.475266
16-0.041853-0.33740.36844
17-0.094748-0.76390.223851
18-0.141976-1.14460.128276
19-0.16655-1.34280.092008
20-0.184726-1.48930.070621
21-0.221353-1.78460.039496
22-0.270905-2.18410.016284
23-0.324791-2.61850.005488
24-0.350975-2.82970.003096
25-0.351521-2.83410.003058
26-0.348021-2.80580.003307
27-0.346148-2.79070.003448
28-0.354613-2.8590.002853
29-0.358948-2.89390.002587
30-0.352411-2.84120.002998
31-0.329408-2.65580.004971
32-0.317053-2.55620.006465
33-0.326276-2.63050.005317
34-0.355675-2.86750.002786
35-0.376452-3.03510.001728
36-0.367978-2.96670.002104


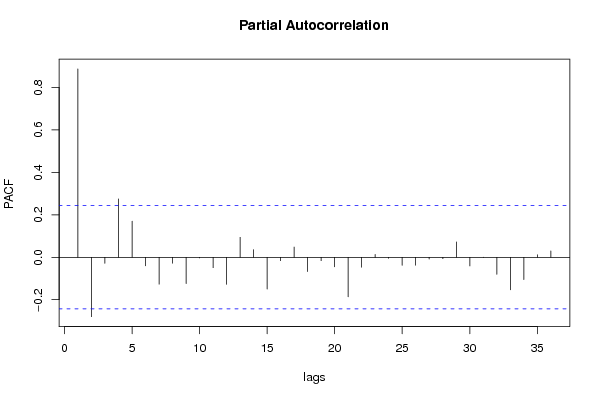
Partial Autocorrelation Function
Time lag kPACF(k)T-STATP-value
10.8868657.15010
2-0.279638-2.25450.01377
3-0.028715-0.23150.408824
40.2749352.21660.015078
50.1700451.37090.087554
6-0.040431-0.3260.372748
7-0.126655-1.02110.15549
8-0.027997-0.22570.411063
9-0.123966-0.99940.160643
10-0.002881-0.02320.490771
11-0.049321-0.39760.3461
12-0.127605-1.02880.153696
130.0940660.75840.225482
140.0358330.28890.38679
15-0.149619-1.20630.116043
16-0.016083-0.12970.448616
170.0478470.38580.35047
18-0.067469-0.5440.294168
19-0.015907-0.12820.449174
20-0.04496-0.36250.359085
21-0.186429-1.5030.068836
22-0.046803-0.37730.353577
230.0132490.10680.45763
24-0.005029-0.04050.48389
25-0.037716-0.30410.381019
26-0.037588-0.3030.381412
27-0.008277-0.06670.473501
28-0.006596-0.05320.478876
290.0724350.5840.280624
30-0.040712-0.32820.371897
310.0002190.00180.499298
32-0.080419-0.64840.25952
33-0.153034-1.23380.11086
34-0.105049-0.84690.20007
350.0115850.09340.462935
360.0299240.24130.405057

\begin{tabular}{lllllllll}
\hline
Partial Autocorrelation Function \tabularnewline
Time lag k & PACF(k) & T-STAT & P-value \tabularnewline
1 & 0.886865 & 7.1501 & 0 \tabularnewline
2 & -0.279638 & -2.2545 & 0.01377 \tabularnewline
3 & -0.028715 & -0.2315 & 0.408824 \tabularnewline
4 & 0.274935 & 2.2166 & 0.015078 \tabularnewline
5 & 0.170045 & 1.3709 & 0.087554 \tabularnewline
6 & -0.040431 & -0.326 & 0.372748 \tabularnewline
7 & -0.126655 & -1.0211 & 0.15549 \tabularnewline
8 & -0.027997 & -0.2257 & 0.411063 \tabularnewline
9 & -0.123966 & -0.9994 & 0.160643 \tabularnewline
10 & -0.002881 & -0.0232 & 0.490771 \tabularnewline
11 & -0.049321 & -0.3976 & 0.3461 \tabularnewline
12 & -0.127605 & -1.0288 & 0.153696 \tabularnewline
13 & 0.094066 & 0.7584 & 0.225482 \tabularnewline
14 & 0.035833 & 0.2889 & 0.38679 \tabularnewline
15 & -0.149619 & -1.2063 & 0.116043 \tabularnewline
16 & -0.016083 & -0.1297 & 0.448616 \tabularnewline
17 & 0.047847 & 0.3858 & 0.35047 \tabularnewline
18 & -0.067469 & -0.544 & 0.294168 \tabularnewline
19 & -0.015907 & -0.1282 & 0.449174 \tabularnewline
20 & -0.04496 & -0.3625 & 0.359085 \tabularnewline
21 & -0.186429 & -1.503 & 0.068836 \tabularnewline
22 & -0.046803 & -0.3773 & 0.353577 \tabularnewline
23 & 0.013249 & 0.1068 & 0.45763 \tabularnewline
24 & -0.005029 & -0.0405 & 0.48389 \tabularnewline
25 & -0.037716 & -0.3041 & 0.381019 \tabularnewline
26 & -0.037588 & -0.303 & 0.381412 \tabularnewline
27 & -0.008277 & -0.0667 & 0.473501 \tabularnewline
28 & -0.006596 & -0.0532 & 0.478876 \tabularnewline
29 & 0.072435 & 0.584 & 0.280624 \tabularnewline
30 & -0.040712 & -0.3282 & 0.371897 \tabularnewline
31 & 0.000219 & 0.0018 & 0.499298 \tabularnewline
32 & -0.080419 & -0.6484 & 0.25952 \tabularnewline
33 & -0.153034 & -1.2338 & 0.11086 \tabularnewline
34 & -0.105049 & -0.8469 & 0.20007 \tabularnewline
35 & 0.011585 & 0.0934 & 0.462935 \tabularnewline
36 & 0.029924 & 0.2413 & 0.405057 \tabularnewline
\hline
\end{tabular}
%Source: https://freestatistics.org/blog/index.php?pk=68729&T=2

[TABLE]
[ROW][C]Partial Autocorrelation Function[/C][/ROW]
[ROW][C]Time lag k[/C][C]PACF(k)[/C][C]T-STAT[/C][C]P-value[/C][/ROW]
[ROW][C]1[/C][C]0.886865[/C][C]7.1501[/C][C]0[/C][/ROW]
[ROW][C]2[/C][C]-0.279638[/C][C]-2.2545[/C][C]0.01377[/C][/ROW]
[ROW][C]3[/C][C]-0.028715[/C][C]-0.2315[/C][C]0.408824[/C][/ROW]
[ROW][C]4[/C][C]0.274935[/C][C]2.2166[/C][C]0.015078[/C][/ROW]
[ROW][C]5[/C][C]0.170045[/C][C]1.3709[/C][C]0.087554[/C][/ROW]
[ROW][C]6[/C][C]-0.040431[/C][C]-0.326[/C][C]0.372748[/C][/ROW]
[ROW][C]7[/C][C]-0.126655[/C][C]-1.0211[/C][C]0.15549[/C][/ROW]
[ROW][C]8[/C][C]-0.027997[/C][C]-0.2257[/C][C]0.411063[/C][/ROW]
[ROW][C]9[/C][C]-0.123966[/C][C]-0.9994[/C][C]0.160643[/C][/ROW]
[ROW][C]10[/C][C]-0.002881[/C][C]-0.0232[/C][C]0.490771[/C][/ROW]
[ROW][C]11[/C][C]-0.049321[/C][C]-0.3976[/C][C]0.3461[/C][/ROW]
[ROW][C]12[/C][C]-0.127605[/C][C]-1.0288[/C][C]0.153696[/C][/ROW]
[ROW][C]13[/C][C]0.094066[/C][C]0.7584[/C][C]0.225482[/C][/ROW]
[ROW][C]14[/C][C]0.035833[/C][C]0.2889[/C][C]0.38679[/C][/ROW]
[ROW][C]15[/C][C]-0.149619[/C][C]-1.2063[/C][C]0.116043[/C][/ROW]
[ROW][C]16[/C][C]-0.016083[/C][C]-0.1297[/C][C]0.448616[/C][/ROW]
[ROW][C]17[/C][C]0.047847[/C][C]0.3858[/C][C]0.35047[/C][/ROW]
[ROW][C]18[/C][C]-0.067469[/C][C]-0.544[/C][C]0.294168[/C][/ROW]
[ROW][C]19[/C][C]-0.015907[/C][C]-0.1282[/C][C]0.449174[/C][/ROW]
[ROW][C]20[/C][C]-0.04496[/C][C]-0.3625[/C][C]0.359085[/C][/ROW]
[ROW][C]21[/C][C]-0.186429[/C][C]-1.503[/C][C]0.068836[/C][/ROW]
[ROW][C]22[/C][C]-0.046803[/C][C]-0.3773[/C][C]0.353577[/C][/ROW]
[ROW][C]23[/C][C]0.013249[/C][C]0.1068[/C][C]0.45763[/C][/ROW]
[ROW][C]24[/C][C]-0.005029[/C][C]-0.0405[/C][C]0.48389[/C][/ROW]
[ROW][C]25[/C][C]-0.037716[/C][C]-0.3041[/C][C]0.381019[/C][/ROW]
[ROW][C]26[/C][C]-0.037588[/C][C]-0.303[/C][C]0.381412[/C][/ROW]
[ROW][C]27[/C][C]-0.008277[/C][C]-0.0667[/C][C]0.473501[/C][/ROW]
[ROW][C]28[/C][C]-0.006596[/C][C]-0.0532[/C][C]0.478876[/C][/ROW]
[ROW][C]29[/C][C]0.072435[/C][C]0.584[/C][C]0.280624[/C][/ROW]
[ROW][C]30[/C][C]-0.040712[/C][C]-0.3282[/C][C]0.371897[/C][/ROW]
[ROW][C]31[/C][C]0.000219[/C][C]0.0018[/C][C]0.499298[/C][/ROW]
[ROW][C]32[/C][C]-0.080419[/C][C]-0.6484[/C][C]0.25952[/C][/ROW]
[ROW][C]33[/C][C]-0.153034[/C][C]-1.2338[/C][C]0.11086[/C][/ROW]
[ROW][C]34[/C][C]-0.105049[/C][C]-0.8469[/C][C]0.20007[/C][/ROW]
[ROW][C]35[/C][C]0.011585[/C][C]0.0934[/C][C]0.462935[/C][/ROW]
[ROW][C]36[/C][C]0.029924[/C][C]0.2413[/C][C]0.405057[/C][/ROW]
[/TABLE]
Source: https://freestatistics.org/blog/index.php?pk=68729&T=2

Globally Unique Identifier (entire table): ba.freestatistics.org/blog/index.php?pk=68729&T=2

As an alternative you can also use a QR Code:  

The GUIDs for individual cells are displayed in the table below:

Partial Autocorrelation Function
Time lag kPACF(k)T-STATP-value
10.8868657.15010
2-0.279638-2.25450.01377
3-0.028715-0.23150.408824
40.2749352.21660.015078
50.1700451.37090.087554
6-0.040431-0.3260.372748
7-0.126655-1.02110.15549
8-0.027997-0.22570.411063
9-0.123966-0.99940.160643
10-0.002881-0.02320.490771
11-0.049321-0.39760.3461
12-0.127605-1.02880.153696
130.0940660.75840.225482
140.0358330.28890.38679
15-0.149619-1.20630.116043
16-0.016083-0.12970.448616
170.0478470.38580.35047
18-0.067469-0.5440.294168
19-0.015907-0.12820.449174
20-0.04496-0.36250.359085
21-0.186429-1.5030.068836
22-0.046803-0.37730.353577
230.0132490.10680.45763
24-0.005029-0.04050.48389
25-0.037716-0.30410.381019
26-0.037588-0.3030.381412
27-0.008277-0.06670.473501
28-0.006596-0.05320.478876
290.0724350.5840.280624
30-0.040712-0.32820.371897
310.0002190.00180.499298
32-0.080419-0.64840.25952
33-0.153034-1.23380.11086
34-0.105049-0.84690.20007
350.0115850.09340.462935
360.0299240.24130.405057


Parameters (Session):
par1 = 36 ; par2 = 1 ; par3 = 0 ; par4 = 0 ; par5 = 12 ; par6 = MA ; par7 = 0.95 ;
Parameters (R input):
par1 = 36 ; par2 = 1 ; par3 = 0 ; par4 = 0 ; par5 = 12 ; par6 = MA ; par7 = 0.95 ;
R code (references can be found in the software module):
if (par1 == 'Default') {
par1 = 10*log10(length(x))
} else {
par1 <- as.numeric(par1)
}
par2 <- as.numeric(par2)
par3 <- as.numeric(par3)
par4 <- as.numeric(par4)
par5 <- as.numeric(par5)
if (par6 == 'White Noise') par6 <- 'white' else par6 <- 'ma'
par7 <- as.numeric(par7)
if (par2 == 0) {
x <- log(x)
} else {
x <- (x ^ par2 - 1) / par2
}
if (par3 > 0) x <- diff(x,lag=1,difference=par3)
if (par4 > 0) x <- diff(x,lag=par5,difference=par4)
bitmap(file='pic1.png')
racf <- acf(x, par1, main='Autocorrelation', xlab='time lag', ylab='ACF', ci.type=par6, ci=par7, sub=paste('(lambda=',par2,', d=',par3,', D=',par4,', CI=', par7, ', CI type=',par6,')',sep=''))
dev.off()
bitmap(file='pic2.png')
rpacf <- pacf(x,par1,main='Partial Autocorrelation',xlab='lags',ylab='PACF')
dev.off()
(myacf <- c(racf$acf))
(mypacf <- c(rpacf$acf))
lengthx <- length(x)
sqrtn <- sqrt(lengthx)
load(file='createtable')
a<-table.start()
a<-table.row.start(a)
a<-table.element(a,'Autocorrelation Function',4,TRUE)
a<-table.row.end(a)
a<-table.row.start(a)
a<-table.element(a,'Time lag k',header=TRUE)
a<-table.element(a,hyperlink('basics.htm','ACF(k)','click here for more information about the Autocorrelation Function'),header=TRUE)
a<-table.element(a,'T-STAT',header=TRUE)
a<-table.element(a,'P-value',header=TRUE)
a<-table.row.end(a)
for (i in 2:(par1+1)) {
a<-table.row.start(a)
a<-table.element(a,i-1,header=TRUE)
a<-table.element(a,round(myacf[i],6))
mytstat <- myacf[i]*sqrtn
a<-table.element(a,round(mytstat,4))
a<-table.element(a,round(1-pt(abs(mytstat),lengthx),6))
a<-table.row.end(a)
}
a<-table.end(a)
table.save(a,file='mytable.tab')
a<-table.start()
a<-table.row.start(a)
a<-table.element(a,'Partial Autocorrelation Function',4,TRUE)
a<-table.row.end(a)
a<-table.row.start(a)
a<-table.element(a,'Time lag k',header=TRUE)
a<-table.element(a,hyperlink('basics.htm','PACF(k)','click here for more information about the Partial Autocorrelation Function'),header=TRUE)
a<-table.element(a,'T-STAT',header=TRUE)
a<-table.element(a,'P-value',header=TRUE)
a<-table.row.end(a)
for (i in 1:par1) {
a<-table.row.start(a)
a<-table.element(a,i,header=TRUE)
a<-table.element(a,round(mypacf[i],6))
mytstat <- mypacf[i]*sqrtn
a<-table.element(a,round(mytstat,4))
a<-table.element(a,round(1-pt(abs(mytstat),lengthx),6))
a<-table.row.end(a)
}
a<-table.end(a)
table.save(a,file='mytable1.tab')