Free Statistics

of Irreproducible Research!

Author's title

Author*The author of this computation has been verified*
R Software Modulerwasp_autocorrelation.wasp
Title produced by software(Partial) Autocorrelation Function
Date of computationThu, 17 Dec 2009 04:03:34 -0700
Cite this page as followsStatistical Computations at FreeStatistics.org, Office for Research Development and Education, URL https://freestatistics.org/blog/index.php?v=date/2009/Dec/17/t1261047856uviycmgk7gof8wb.htm/, Retrieved Tue, 30 Apr 2024 07:21:56 +0000
Statistical Computations at FreeStatistics.org, Office for Research Development and Education, URL https://freestatistics.org/blog/index.php?pk=68733, Retrieved Tue, 30 Apr 2024 07:21:56 +0000
QR Codes:

Original text written by user:
IsPrivate?No (this computation is public)
User-defined keywords
Estimated Impact83
Family? (F = Feedback message, R = changed R code, M = changed R Module, P = changed Parameters, D = changed Data)
-     [Univariate Data Series] [data set] [2008-12-01 19:54:57] [b98453cac15ba1066b407e146608df68]
- RMP   [(Partial) Autocorrelation Function] [] [2009-11-27 14:47:30] [b98453cac15ba1066b407e146608df68]
-   PD      [(Partial) Autocorrelation Function] [] [2009-12-17 11:03:34] [e76c6d261190c0179bc6006a5cdb804c] [Current]
Feedback Forum

Post a new message
Dataseries X:
359640
364080
364080
359640
359640
359640
359640
359640
364080
368520
372960
377400
406780
402050
392590
368940
368940
378400
406780
420970
420970
406780
392590
392590
394250
399000
403750
399000
408500
403750
403750
399000
403750
403750
403750
403750
405450
405450
405450
405450
410220
400680
386370
381600
381600
381600
381600
376830
381420
381420
386310
396090
391200
371640
356970
342300
332520
342300
347190
352080
357130
347070
337010
337010
331980


Summary of computational transaction
Raw Inputview raw input (R code)
Raw Outputview raw output of R engine
Computing time1 seconds
R Server'Gwilym Jenkins' @ 72.249.127.135

\begin{tabular}{lllllllll}
\hline
Summary of computational transaction \tabularnewline
Raw Input & view raw input (R code)  \tabularnewline
Raw Output & view raw output of R engine  \tabularnewline
Computing time & 1 seconds \tabularnewline
R Server & 'Gwilym Jenkins' @ 72.249.127.135 \tabularnewline
\hline
\end{tabular}
%Source: https://freestatistics.org/blog/index.php?pk=68733&T=0

[TABLE]
[ROW][C]Summary of computational transaction[/C][/ROW]
[ROW][C]Raw Input[/C][C]view raw input (R code) [/C][/ROW]
[ROW][C]Raw Output[/C][C]view raw output of R engine [/C][/ROW]
[ROW][C]Computing time[/C][C]1 seconds[/C][/ROW]
[ROW][C]R Server[/C][C]'Gwilym Jenkins' @ 72.249.127.135[/C][/ROW]
[/TABLE]
Source: https://freestatistics.org/blog/index.php?pk=68733&T=0

Globally Unique Identifier (entire table): ba.freestatistics.org/blog/index.php?pk=68733&T=0

As an alternative you can also use a QR Code:  

The GUIDs for individual cells are displayed in the table below:

Summary of computational transaction
Raw Inputview raw input (R code)
Raw Outputview raw output of R engine
Computing time1 seconds
R Server'Gwilym Jenkins' @ 72.249.127.135


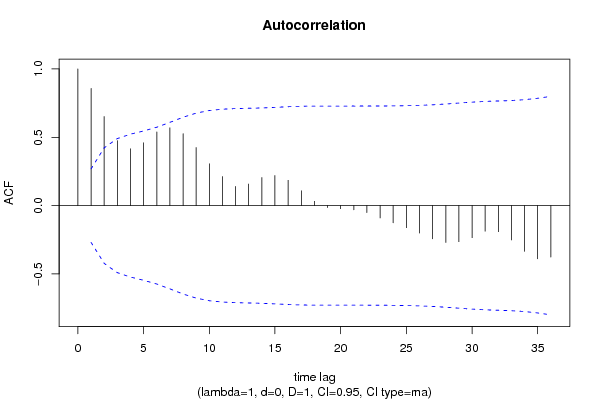
Autocorrelation Function
Time lag kACF(k)T-STATP-value
10.8575146.24280
20.6518924.74588e-06
30.4749693.45780.000541
40.4158013.02710.001903
50.4598093.34750.000753
60.5393743.92670.000125
70.5688914.14166.2e-05
80.5260523.82970.000171
90.424623.09130.001587
100.3060262.22790.015077
110.2122231.5450.064148
120.1406831.02420.1552
130.1572991.14520.128645
140.205231.49410.07054
150.2197961.60010.057756
160.1855431.35080.091253
170.108550.79030.216451
180.0316520.23040.409322
19-0.013996-0.10190.459612
20-0.022109-0.1610.43637
21-0.030925-0.22510.41137
22-0.050551-0.3680.357163
23-0.090611-0.65970.256164
24-0.126218-0.91890.181161
25-0.161443-1.17530.12256
26-0.201243-1.46510.074405
27-0.242945-1.76870.041352
28-0.26952-1.96210.027504
29-0.263593-1.9190.030189
30-0.23428-1.70560.04697
31-0.187381-1.36420.089142
32-0.190738-1.38860.085383
33-0.25091-1.82670.036693
34-0.334059-2.4320.009214
35-0.389381-2.83470.003239
36-0.376627-2.74190.004156

\begin{tabular}{lllllllll}
\hline
Autocorrelation Function \tabularnewline
Time lag k & ACF(k) & T-STAT & P-value \tabularnewline
1 & 0.857514 & 6.2428 & 0 \tabularnewline
2 & 0.651892 & 4.7458 & 8e-06 \tabularnewline
3 & 0.474969 & 3.4578 & 0.000541 \tabularnewline
4 & 0.415801 & 3.0271 & 0.001903 \tabularnewline
5 & 0.459809 & 3.3475 & 0.000753 \tabularnewline
6 & 0.539374 & 3.9267 & 0.000125 \tabularnewline
7 & 0.568891 & 4.1416 & 6.2e-05 \tabularnewline
8 & 0.526052 & 3.8297 & 0.000171 \tabularnewline
9 & 0.42462 & 3.0913 & 0.001587 \tabularnewline
10 & 0.306026 & 2.2279 & 0.015077 \tabularnewline
11 & 0.212223 & 1.545 & 0.064148 \tabularnewline
12 & 0.140683 & 1.0242 & 0.1552 \tabularnewline
13 & 0.157299 & 1.1452 & 0.128645 \tabularnewline
14 & 0.20523 & 1.4941 & 0.07054 \tabularnewline
15 & 0.219796 & 1.6001 & 0.057756 \tabularnewline
16 & 0.185543 & 1.3508 & 0.091253 \tabularnewline
17 & 0.10855 & 0.7903 & 0.216451 \tabularnewline
18 & 0.031652 & 0.2304 & 0.409322 \tabularnewline
19 & -0.013996 & -0.1019 & 0.459612 \tabularnewline
20 & -0.022109 & -0.161 & 0.43637 \tabularnewline
21 & -0.030925 & -0.2251 & 0.41137 \tabularnewline
22 & -0.050551 & -0.368 & 0.357163 \tabularnewline
23 & -0.090611 & -0.6597 & 0.256164 \tabularnewline
24 & -0.126218 & -0.9189 & 0.181161 \tabularnewline
25 & -0.161443 & -1.1753 & 0.12256 \tabularnewline
26 & -0.201243 & -1.4651 & 0.074405 \tabularnewline
27 & -0.242945 & -1.7687 & 0.041352 \tabularnewline
28 & -0.26952 & -1.9621 & 0.027504 \tabularnewline
29 & -0.263593 & -1.919 & 0.030189 \tabularnewline
30 & -0.23428 & -1.7056 & 0.04697 \tabularnewline
31 & -0.187381 & -1.3642 & 0.089142 \tabularnewline
32 & -0.190738 & -1.3886 & 0.085383 \tabularnewline
33 & -0.25091 & -1.8267 & 0.036693 \tabularnewline
34 & -0.334059 & -2.432 & 0.009214 \tabularnewline
35 & -0.389381 & -2.8347 & 0.003239 \tabularnewline
36 & -0.376627 & -2.7419 & 0.004156 \tabularnewline
\hline
\end{tabular}
%Source: https://freestatistics.org/blog/index.php?pk=68733&T=1

[TABLE]
[ROW][C]Autocorrelation Function[/C][/ROW]
[ROW][C]Time lag k[/C][C]ACF(k)[/C][C]T-STAT[/C][C]P-value[/C][/ROW]
[ROW][C]1[/C][C]0.857514[/C][C]6.2428[/C][C]0[/C][/ROW]
[ROW][C]2[/C][C]0.651892[/C][C]4.7458[/C][C]8e-06[/C][/ROW]
[ROW][C]3[/C][C]0.474969[/C][C]3.4578[/C][C]0.000541[/C][/ROW]
[ROW][C]4[/C][C]0.415801[/C][C]3.0271[/C][C]0.001903[/C][/ROW]
[ROW][C]5[/C][C]0.459809[/C][C]3.3475[/C][C]0.000753[/C][/ROW]
[ROW][C]6[/C][C]0.539374[/C][C]3.9267[/C][C]0.000125[/C][/ROW]
[ROW][C]7[/C][C]0.568891[/C][C]4.1416[/C][C]6.2e-05[/C][/ROW]
[ROW][C]8[/C][C]0.526052[/C][C]3.8297[/C][C]0.000171[/C][/ROW]
[ROW][C]9[/C][C]0.42462[/C][C]3.0913[/C][C]0.001587[/C][/ROW]
[ROW][C]10[/C][C]0.306026[/C][C]2.2279[/C][C]0.015077[/C][/ROW]
[ROW][C]11[/C][C]0.212223[/C][C]1.545[/C][C]0.064148[/C][/ROW]
[ROW][C]12[/C][C]0.140683[/C][C]1.0242[/C][C]0.1552[/C][/ROW]
[ROW][C]13[/C][C]0.157299[/C][C]1.1452[/C][C]0.128645[/C][/ROW]
[ROW][C]14[/C][C]0.20523[/C][C]1.4941[/C][C]0.07054[/C][/ROW]
[ROW][C]15[/C][C]0.219796[/C][C]1.6001[/C][C]0.057756[/C][/ROW]
[ROW][C]16[/C][C]0.185543[/C][C]1.3508[/C][C]0.091253[/C][/ROW]
[ROW][C]17[/C][C]0.10855[/C][C]0.7903[/C][C]0.216451[/C][/ROW]
[ROW][C]18[/C][C]0.031652[/C][C]0.2304[/C][C]0.409322[/C][/ROW]
[ROW][C]19[/C][C]-0.013996[/C][C]-0.1019[/C][C]0.459612[/C][/ROW]
[ROW][C]20[/C][C]-0.022109[/C][C]-0.161[/C][C]0.43637[/C][/ROW]
[ROW][C]21[/C][C]-0.030925[/C][C]-0.2251[/C][C]0.41137[/C][/ROW]
[ROW][C]22[/C][C]-0.050551[/C][C]-0.368[/C][C]0.357163[/C][/ROW]
[ROW][C]23[/C][C]-0.090611[/C][C]-0.6597[/C][C]0.256164[/C][/ROW]
[ROW][C]24[/C][C]-0.126218[/C][C]-0.9189[/C][C]0.181161[/C][/ROW]
[ROW][C]25[/C][C]-0.161443[/C][C]-1.1753[/C][C]0.12256[/C][/ROW]
[ROW][C]26[/C][C]-0.201243[/C][C]-1.4651[/C][C]0.074405[/C][/ROW]
[ROW][C]27[/C][C]-0.242945[/C][C]-1.7687[/C][C]0.041352[/C][/ROW]
[ROW][C]28[/C][C]-0.26952[/C][C]-1.9621[/C][C]0.027504[/C][/ROW]
[ROW][C]29[/C][C]-0.263593[/C][C]-1.919[/C][C]0.030189[/C][/ROW]
[ROW][C]30[/C][C]-0.23428[/C][C]-1.7056[/C][C]0.04697[/C][/ROW]
[ROW][C]31[/C][C]-0.187381[/C][C]-1.3642[/C][C]0.089142[/C][/ROW]
[ROW][C]32[/C][C]-0.190738[/C][C]-1.3886[/C][C]0.085383[/C][/ROW]
[ROW][C]33[/C][C]-0.25091[/C][C]-1.8267[/C][C]0.036693[/C][/ROW]
[ROW][C]34[/C][C]-0.334059[/C][C]-2.432[/C][C]0.009214[/C][/ROW]
[ROW][C]35[/C][C]-0.389381[/C][C]-2.8347[/C][C]0.003239[/C][/ROW]
[ROW][C]36[/C][C]-0.376627[/C][C]-2.7419[/C][C]0.004156[/C][/ROW]
[/TABLE]
Source: https://freestatistics.org/blog/index.php?pk=68733&T=1

Globally Unique Identifier (entire table): ba.freestatistics.org/blog/index.php?pk=68733&T=1

As an alternative you can also use a QR Code:  

The GUIDs for individual cells are displayed in the table below:

Autocorrelation Function
Time lag kACF(k)T-STATP-value
10.8575146.24280
20.6518924.74588e-06
30.4749693.45780.000541
40.4158013.02710.001903
50.4598093.34750.000753
60.5393743.92670.000125
70.5688914.14166.2e-05
80.5260523.82970.000171
90.424623.09130.001587
100.3060262.22790.015077
110.2122231.5450.064148
120.1406831.02420.1552
130.1572991.14520.128645
140.205231.49410.07054
150.2197961.60010.057756
160.1855431.35080.091253
170.108550.79030.216451
180.0316520.23040.409322
19-0.013996-0.10190.459612
20-0.022109-0.1610.43637
21-0.030925-0.22510.41137
22-0.050551-0.3680.357163
23-0.090611-0.65970.256164
24-0.126218-0.91890.181161
25-0.161443-1.17530.12256
26-0.201243-1.46510.074405
27-0.242945-1.76870.041352
28-0.26952-1.96210.027504
29-0.263593-1.9190.030189
30-0.23428-1.70560.04697
31-0.187381-1.36420.089142
32-0.190738-1.38860.085383
33-0.25091-1.82670.036693
34-0.334059-2.4320.009214
35-0.389381-2.83470.003239
36-0.376627-2.74190.004156


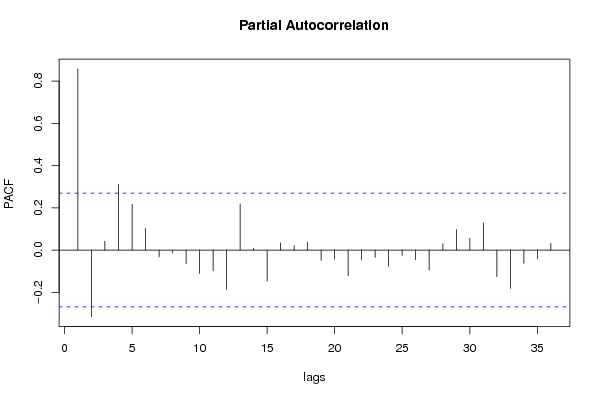
Partial Autocorrelation Function
Time lag kPACF(k)T-STATP-value
10.8575146.24280
2-0.31525-2.29510.012859
30.0422320.30750.379851
40.3115532.26810.01371
50.2165311.57640.060445
60.1023410.74510.229766
7-0.032393-0.23580.407238
8-0.013411-0.09760.461296
9-0.064021-0.46610.321535
10-0.110936-0.80760.211458
11-0.0974-0.70910.240691
12-0.186612-1.35860.090021
130.2187051.59220.058644
140.0088370.06430.474473
15-0.147419-1.07320.144016
160.0345480.25150.401194
170.0204770.14910.441031
180.0383040.27890.390719
19-0.048688-0.35450.362201
20-0.042518-0.30950.379063
21-0.121376-0.88360.190444
22-0.046627-0.33940.367806
23-0.034481-0.2510.401382
24-0.07679-0.5590.289245
25-0.025437-0.18520.426895
26-0.046222-0.33650.36891
27-0.093893-0.68350.248619
280.0297090.21630.414798
290.097630.71080.240176
300.0562890.40980.341806
310.1283740.93460.177123
32-0.126032-0.91750.181512
33-0.181768-1.32330.09571
34-0.062508-0.45510.325459
35-0.041231-0.30020.382611
360.0327030.23810.406368

\begin{tabular}{lllllllll}
\hline
Partial Autocorrelation Function \tabularnewline
Time lag k & PACF(k) & T-STAT & P-value \tabularnewline
1 & 0.857514 & 6.2428 & 0 \tabularnewline
2 & -0.31525 & -2.2951 & 0.012859 \tabularnewline
3 & 0.042232 & 0.3075 & 0.379851 \tabularnewline
4 & 0.311553 & 2.2681 & 0.01371 \tabularnewline
5 & 0.216531 & 1.5764 & 0.060445 \tabularnewline
6 & 0.102341 & 0.7451 & 0.229766 \tabularnewline
7 & -0.032393 & -0.2358 & 0.407238 \tabularnewline
8 & -0.013411 & -0.0976 & 0.461296 \tabularnewline
9 & -0.064021 & -0.4661 & 0.321535 \tabularnewline
10 & -0.110936 & -0.8076 & 0.211458 \tabularnewline
11 & -0.0974 & -0.7091 & 0.240691 \tabularnewline
12 & -0.186612 & -1.3586 & 0.090021 \tabularnewline
13 & 0.218705 & 1.5922 & 0.058644 \tabularnewline
14 & 0.008837 & 0.0643 & 0.474473 \tabularnewline
15 & -0.147419 & -1.0732 & 0.144016 \tabularnewline
16 & 0.034548 & 0.2515 & 0.401194 \tabularnewline
17 & 0.020477 & 0.1491 & 0.441031 \tabularnewline
18 & 0.038304 & 0.2789 & 0.390719 \tabularnewline
19 & -0.048688 & -0.3545 & 0.362201 \tabularnewline
20 & -0.042518 & -0.3095 & 0.379063 \tabularnewline
21 & -0.121376 & -0.8836 & 0.190444 \tabularnewline
22 & -0.046627 & -0.3394 & 0.367806 \tabularnewline
23 & -0.034481 & -0.251 & 0.401382 \tabularnewline
24 & -0.07679 & -0.559 & 0.289245 \tabularnewline
25 & -0.025437 & -0.1852 & 0.426895 \tabularnewline
26 & -0.046222 & -0.3365 & 0.36891 \tabularnewline
27 & -0.093893 & -0.6835 & 0.248619 \tabularnewline
28 & 0.029709 & 0.2163 & 0.414798 \tabularnewline
29 & 0.09763 & 0.7108 & 0.240176 \tabularnewline
30 & 0.056289 & 0.4098 & 0.341806 \tabularnewline
31 & 0.128374 & 0.9346 & 0.177123 \tabularnewline
32 & -0.126032 & -0.9175 & 0.181512 \tabularnewline
33 & -0.181768 & -1.3233 & 0.09571 \tabularnewline
34 & -0.062508 & -0.4551 & 0.325459 \tabularnewline
35 & -0.041231 & -0.3002 & 0.382611 \tabularnewline
36 & 0.032703 & 0.2381 & 0.406368 \tabularnewline
\hline
\end{tabular}
%Source: https://freestatistics.org/blog/index.php?pk=68733&T=2

[TABLE]
[ROW][C]Partial Autocorrelation Function[/C][/ROW]
[ROW][C]Time lag k[/C][C]PACF(k)[/C][C]T-STAT[/C][C]P-value[/C][/ROW]
[ROW][C]1[/C][C]0.857514[/C][C]6.2428[/C][C]0[/C][/ROW]
[ROW][C]2[/C][C]-0.31525[/C][C]-2.2951[/C][C]0.012859[/C][/ROW]
[ROW][C]3[/C][C]0.042232[/C][C]0.3075[/C][C]0.379851[/C][/ROW]
[ROW][C]4[/C][C]0.311553[/C][C]2.2681[/C][C]0.01371[/C][/ROW]
[ROW][C]5[/C][C]0.216531[/C][C]1.5764[/C][C]0.060445[/C][/ROW]
[ROW][C]6[/C][C]0.102341[/C][C]0.7451[/C][C]0.229766[/C][/ROW]
[ROW][C]7[/C][C]-0.032393[/C][C]-0.2358[/C][C]0.407238[/C][/ROW]
[ROW][C]8[/C][C]-0.013411[/C][C]-0.0976[/C][C]0.461296[/C][/ROW]
[ROW][C]9[/C][C]-0.064021[/C][C]-0.4661[/C][C]0.321535[/C][/ROW]
[ROW][C]10[/C][C]-0.110936[/C][C]-0.8076[/C][C]0.211458[/C][/ROW]
[ROW][C]11[/C][C]-0.0974[/C][C]-0.7091[/C][C]0.240691[/C][/ROW]
[ROW][C]12[/C][C]-0.186612[/C][C]-1.3586[/C][C]0.090021[/C][/ROW]
[ROW][C]13[/C][C]0.218705[/C][C]1.5922[/C][C]0.058644[/C][/ROW]
[ROW][C]14[/C][C]0.008837[/C][C]0.0643[/C][C]0.474473[/C][/ROW]
[ROW][C]15[/C][C]-0.147419[/C][C]-1.0732[/C][C]0.144016[/C][/ROW]
[ROW][C]16[/C][C]0.034548[/C][C]0.2515[/C][C]0.401194[/C][/ROW]
[ROW][C]17[/C][C]0.020477[/C][C]0.1491[/C][C]0.441031[/C][/ROW]
[ROW][C]18[/C][C]0.038304[/C][C]0.2789[/C][C]0.390719[/C][/ROW]
[ROW][C]19[/C][C]-0.048688[/C][C]-0.3545[/C][C]0.362201[/C][/ROW]
[ROW][C]20[/C][C]-0.042518[/C][C]-0.3095[/C][C]0.379063[/C][/ROW]
[ROW][C]21[/C][C]-0.121376[/C][C]-0.8836[/C][C]0.190444[/C][/ROW]
[ROW][C]22[/C][C]-0.046627[/C][C]-0.3394[/C][C]0.367806[/C][/ROW]
[ROW][C]23[/C][C]-0.034481[/C][C]-0.251[/C][C]0.401382[/C][/ROW]
[ROW][C]24[/C][C]-0.07679[/C][C]-0.559[/C][C]0.289245[/C][/ROW]
[ROW][C]25[/C][C]-0.025437[/C][C]-0.1852[/C][C]0.426895[/C][/ROW]
[ROW][C]26[/C][C]-0.046222[/C][C]-0.3365[/C][C]0.36891[/C][/ROW]
[ROW][C]27[/C][C]-0.093893[/C][C]-0.6835[/C][C]0.248619[/C][/ROW]
[ROW][C]28[/C][C]0.029709[/C][C]0.2163[/C][C]0.414798[/C][/ROW]
[ROW][C]29[/C][C]0.09763[/C][C]0.7108[/C][C]0.240176[/C][/ROW]
[ROW][C]30[/C][C]0.056289[/C][C]0.4098[/C][C]0.341806[/C][/ROW]
[ROW][C]31[/C][C]0.128374[/C][C]0.9346[/C][C]0.177123[/C][/ROW]
[ROW][C]32[/C][C]-0.126032[/C][C]-0.9175[/C][C]0.181512[/C][/ROW]
[ROW][C]33[/C][C]-0.181768[/C][C]-1.3233[/C][C]0.09571[/C][/ROW]
[ROW][C]34[/C][C]-0.062508[/C][C]-0.4551[/C][C]0.325459[/C][/ROW]
[ROW][C]35[/C][C]-0.041231[/C][C]-0.3002[/C][C]0.382611[/C][/ROW]
[ROW][C]36[/C][C]0.032703[/C][C]0.2381[/C][C]0.406368[/C][/ROW]
[/TABLE]
Source: https://freestatistics.org/blog/index.php?pk=68733&T=2

Globally Unique Identifier (entire table): ba.freestatistics.org/blog/index.php?pk=68733&T=2

As an alternative you can also use a QR Code:  

The GUIDs for individual cells are displayed in the table below:

Partial Autocorrelation Function
Time lag kPACF(k)T-STATP-value
10.8575146.24280
2-0.31525-2.29510.012859
30.0422320.30750.379851
40.3115532.26810.01371
50.2165311.57640.060445
60.1023410.74510.229766
7-0.032393-0.23580.407238
8-0.013411-0.09760.461296
9-0.064021-0.46610.321535
10-0.110936-0.80760.211458
11-0.0974-0.70910.240691
12-0.186612-1.35860.090021
130.2187051.59220.058644
140.0088370.06430.474473
15-0.147419-1.07320.144016
160.0345480.25150.401194
170.0204770.14910.441031
180.0383040.27890.390719
19-0.048688-0.35450.362201
20-0.042518-0.30950.379063
21-0.121376-0.88360.190444
22-0.046627-0.33940.367806
23-0.034481-0.2510.401382
24-0.07679-0.5590.289245
25-0.025437-0.18520.426895
26-0.046222-0.33650.36891
27-0.093893-0.68350.248619
280.0297090.21630.414798
290.097630.71080.240176
300.0562890.40980.341806
310.1283740.93460.177123
32-0.126032-0.91750.181512
33-0.181768-1.32330.09571
34-0.062508-0.45510.325459
35-0.041231-0.30020.382611
360.0327030.23810.406368


Parameters (Session):
par1 = 36 ; par2 = 1 ; par3 = 0 ; par4 = 1 ; par5 = 12 ; par6 = MA ; par7 = 0.95 ;
Parameters (R input):
par1 = 36 ; par2 = 1 ; par3 = 0 ; par4 = 1 ; par5 = 12 ; par6 = MA ; par7 = 0.95 ;
R code (references can be found in the software module):
if (par1 == 'Default') {
par1 = 10*log10(length(x))
} else {
par1 <- as.numeric(par1)
}
par2 <- as.numeric(par2)
par3 <- as.numeric(par3)
par4 <- as.numeric(par4)
par5 <- as.numeric(par5)
if (par6 == 'White Noise') par6 <- 'white' else par6 <- 'ma'
par7 <- as.numeric(par7)
if (par2 == 0) {
x <- log(x)
} else {
x <- (x ^ par2 - 1) / par2
}
if (par3 > 0) x <- diff(x,lag=1,difference=par3)
if (par4 > 0) x <- diff(x,lag=par5,difference=par4)
bitmap(file='pic1.png')
racf <- acf(x, par1, main='Autocorrelation', xlab='time lag', ylab='ACF', ci.type=par6, ci=par7, sub=paste('(lambda=',par2,', d=',par3,', D=',par4,', CI=', par7, ', CI type=',par6,')',sep=''))
dev.off()
bitmap(file='pic2.png')
rpacf <- pacf(x,par1,main='Partial Autocorrelation',xlab='lags',ylab='PACF')
dev.off()
(myacf <- c(racf$acf))
(mypacf <- c(rpacf$acf))
lengthx <- length(x)
sqrtn <- sqrt(lengthx)
load(file='createtable')
a<-table.start()
a<-table.row.start(a)
a<-table.element(a,'Autocorrelation Function',4,TRUE)
a<-table.row.end(a)
a<-table.row.start(a)
a<-table.element(a,'Time lag k',header=TRUE)
a<-table.element(a,hyperlink('basics.htm','ACF(k)','click here for more information about the Autocorrelation Function'),header=TRUE)
a<-table.element(a,'T-STAT',header=TRUE)
a<-table.element(a,'P-value',header=TRUE)
a<-table.row.end(a)
for (i in 2:(par1+1)) {
a<-table.row.start(a)
a<-table.element(a,i-1,header=TRUE)
a<-table.element(a,round(myacf[i],6))
mytstat <- myacf[i]*sqrtn
a<-table.element(a,round(mytstat,4))
a<-table.element(a,round(1-pt(abs(mytstat),lengthx),6))
a<-table.row.end(a)
}
a<-table.end(a)
table.save(a,file='mytable.tab')
a<-table.start()
a<-table.row.start(a)
a<-table.element(a,'Partial Autocorrelation Function',4,TRUE)
a<-table.row.end(a)
a<-table.row.start(a)
a<-table.element(a,'Time lag k',header=TRUE)
a<-table.element(a,hyperlink('basics.htm','PACF(k)','click here for more information about the Partial Autocorrelation Function'),header=TRUE)
a<-table.element(a,'T-STAT',header=TRUE)
a<-table.element(a,'P-value',header=TRUE)
a<-table.row.end(a)
for (i in 1:par1) {
a<-table.row.start(a)
a<-table.element(a,i,header=TRUE)
a<-table.element(a,round(mypacf[i],6))
mytstat <- mypacf[i]*sqrtn
a<-table.element(a,round(mytstat,4))
a<-table.element(a,round(1-pt(abs(mytstat),lengthx),6))
a<-table.row.end(a)
}
a<-table.end(a)
table.save(a,file='mytable1.tab')