Free Statistics

of Irreproducible Research!

Author's title

Author*The author of this computation has been verified*
R Software Modulerwasp_autocorrelation.wasp
Title produced by software(Partial) Autocorrelation Function
Date of computationThu, 17 Dec 2009 04:05:47 -0700
Cite this page as followsStatistical Computations at FreeStatistics.org, Office for Research Development and Education, URL https://freestatistics.org/blog/index.php?v=date/2009/Dec/17/t1261048000iw5drxj55ay2opv.htm/, Retrieved Tue, 30 Apr 2024 07:48:21 +0000
Statistical Computations at FreeStatistics.org, Office for Research Development and Education, URL https://freestatistics.org/blog/index.php?pk=68736, Retrieved Tue, 30 Apr 2024 07:48:21 +0000
QR Codes:

Original text written by user:
IsPrivate?No (this computation is public)
User-defined keywords
Estimated Impact127
Family? (F = Feedback message, R = changed R code, M = changed R Module, P = changed Parameters, D = changed Data)
-     [Univariate Data Series] [data set] [2008-12-01 19:54:57] [b98453cac15ba1066b407e146608df68]
- RMP   [(Partial) Autocorrelation Function] [] [2009-11-27 14:47:30] [b98453cac15ba1066b407e146608df68]
-   PD      [(Partial) Autocorrelation Function] [] [2009-12-17 11:05:47] [e76c6d261190c0179bc6006a5cdb804c] [Current]
Feedback Forum

Post a new message
Dataseries X:
359640
364080
364080
359640
359640
359640
359640
359640
364080
368520
372960
377400
406780
402050
392590
368940
368940
378400
406780
420970
420970
406780
392590
392590
394250
399000
403750
399000
408500
403750
403750
399000
403750
403750
403750
403750
405450
405450
405450
405450
410220
400680
386370
381600
381600
381600
381600
376830
381420
381420
386310
396090
391200
371640
356970
342300
332520
342300
347190
352080
357130
347070
337010
337010
331980


Summary of computational transaction
Raw Inputview raw input (R code)
Raw Outputview raw output of R engine
Computing time1 seconds
R Server'Gwilym Jenkins' @ 72.249.127.135

\begin{tabular}{lllllllll}
\hline
Summary of computational transaction \tabularnewline
Raw Input & view raw input (R code)  \tabularnewline
Raw Output & view raw output of R engine  \tabularnewline
Computing time & 1 seconds \tabularnewline
R Server & 'Gwilym Jenkins' @ 72.249.127.135 \tabularnewline
\hline
\end{tabular}
%Source: https://freestatistics.org/blog/index.php?pk=68736&T=0

[TABLE]
[ROW][C]Summary of computational transaction[/C][/ROW]
[ROW][C]Raw Input[/C][C]view raw input (R code) [/C][/ROW]
[ROW][C]Raw Output[/C][C]view raw output of R engine [/C][/ROW]
[ROW][C]Computing time[/C][C]1 seconds[/C][/ROW]
[ROW][C]R Server[/C][C]'Gwilym Jenkins' @ 72.249.127.135[/C][/ROW]
[/TABLE]
Source: https://freestatistics.org/blog/index.php?pk=68736&T=0

Globally Unique Identifier (entire table): ba.freestatistics.org/blog/index.php?pk=68736&T=0

As an alternative you can also use a QR Code:  

The GUIDs for individual cells are displayed in the table below:

Summary of computational transaction
Raw Inputview raw input (R code)
Raw Outputview raw output of R engine
Computing time1 seconds
R Server'Gwilym Jenkins' @ 72.249.127.135


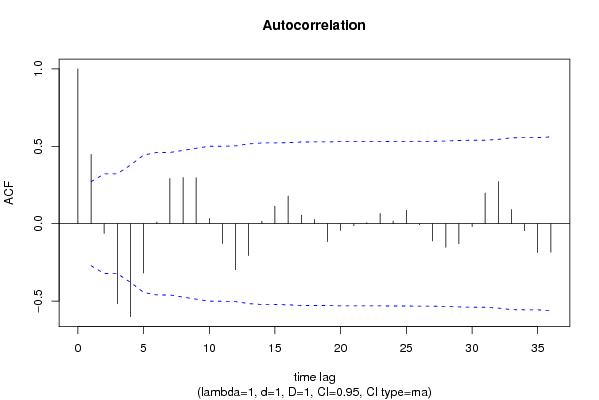
Autocorrelation Function
Time lag kACF(k)T-STATP-value
10.4479953.23050.001072
2-0.062807-0.45290.326249
3-0.517186-3.72950.000238
4-0.600334-4.32913.4e-05
5-0.31904-2.30060.012727
60.0113390.08180.467574
70.2915682.10250.020183
80.2984332.1520.018029
90.2972432.14340.018388
100.0344350.24830.402434
11-0.128212-0.92450.179736
12-0.296651-2.13920.018568
13-0.205443-1.48150.072258
140.0167640.12090.452123
150.1134840.81830.208448
160.1785561.28760.101796
170.0553130.39890.345813
180.0276050.19910.421496
19-0.115261-0.83120.204842
20-0.043803-0.31590.376683
21-0.013477-0.09720.461478
220.0065710.04740.481193
230.0665540.47990.316645
240.0179870.12970.448651
250.0869640.62710.266666
26-0.006042-0.04360.482707
27-0.111381-0.80320.212764
28-0.15201-1.09620.139029
29-0.129726-0.93550.176936
30-0.018331-0.13220.447673
310.198591.43210.079056
320.2724231.96450.027415
330.0913030.65840.256594
34-0.044845-0.32340.373852
35-0.186395-1.34410.092373
36-0.183704-1.32470.09553

\begin{tabular}{lllllllll}
\hline
Autocorrelation Function \tabularnewline
Time lag k & ACF(k) & T-STAT & P-value \tabularnewline
1 & 0.447995 & 3.2305 & 0.001072 \tabularnewline
2 & -0.062807 & -0.4529 & 0.326249 \tabularnewline
3 & -0.517186 & -3.7295 & 0.000238 \tabularnewline
4 & -0.600334 & -4.3291 & 3.4e-05 \tabularnewline
5 & -0.31904 & -2.3006 & 0.012727 \tabularnewline
6 & 0.011339 & 0.0818 & 0.467574 \tabularnewline
7 & 0.291568 & 2.1025 & 0.020183 \tabularnewline
8 & 0.298433 & 2.152 & 0.018029 \tabularnewline
9 & 0.297243 & 2.1434 & 0.018388 \tabularnewline
10 & 0.034435 & 0.2483 & 0.402434 \tabularnewline
11 & -0.128212 & -0.9245 & 0.179736 \tabularnewline
12 & -0.296651 & -2.1392 & 0.018568 \tabularnewline
13 & -0.205443 & -1.4815 & 0.072258 \tabularnewline
14 & 0.016764 & 0.1209 & 0.452123 \tabularnewline
15 & 0.113484 & 0.8183 & 0.208448 \tabularnewline
16 & 0.178556 & 1.2876 & 0.101796 \tabularnewline
17 & 0.055313 & 0.3989 & 0.345813 \tabularnewline
18 & 0.027605 & 0.1991 & 0.421496 \tabularnewline
19 & -0.115261 & -0.8312 & 0.204842 \tabularnewline
20 & -0.043803 & -0.3159 & 0.376683 \tabularnewline
21 & -0.013477 & -0.0972 & 0.461478 \tabularnewline
22 & 0.006571 & 0.0474 & 0.481193 \tabularnewline
23 & 0.066554 & 0.4799 & 0.316645 \tabularnewline
24 & 0.017987 & 0.1297 & 0.448651 \tabularnewline
25 & 0.086964 & 0.6271 & 0.266666 \tabularnewline
26 & -0.006042 & -0.0436 & 0.482707 \tabularnewline
27 & -0.111381 & -0.8032 & 0.212764 \tabularnewline
28 & -0.15201 & -1.0962 & 0.139029 \tabularnewline
29 & -0.129726 & -0.9355 & 0.176936 \tabularnewline
30 & -0.018331 & -0.1322 & 0.447673 \tabularnewline
31 & 0.19859 & 1.4321 & 0.079056 \tabularnewline
32 & 0.272423 & 1.9645 & 0.027415 \tabularnewline
33 & 0.091303 & 0.6584 & 0.256594 \tabularnewline
34 & -0.044845 & -0.3234 & 0.373852 \tabularnewline
35 & -0.186395 & -1.3441 & 0.092373 \tabularnewline
36 & -0.183704 & -1.3247 & 0.09553 \tabularnewline
\hline
\end{tabular}
%Source: https://freestatistics.org/blog/index.php?pk=68736&T=1

[TABLE]
[ROW][C]Autocorrelation Function[/C][/ROW]
[ROW][C]Time lag k[/C][C]ACF(k)[/C][C]T-STAT[/C][C]P-value[/C][/ROW]
[ROW][C]1[/C][C]0.447995[/C][C]3.2305[/C][C]0.001072[/C][/ROW]
[ROW][C]2[/C][C]-0.062807[/C][C]-0.4529[/C][C]0.326249[/C][/ROW]
[ROW][C]3[/C][C]-0.517186[/C][C]-3.7295[/C][C]0.000238[/C][/ROW]
[ROW][C]4[/C][C]-0.600334[/C][C]-4.3291[/C][C]3.4e-05[/C][/ROW]
[ROW][C]5[/C][C]-0.31904[/C][C]-2.3006[/C][C]0.012727[/C][/ROW]
[ROW][C]6[/C][C]0.011339[/C][C]0.0818[/C][C]0.467574[/C][/ROW]
[ROW][C]7[/C][C]0.291568[/C][C]2.1025[/C][C]0.020183[/C][/ROW]
[ROW][C]8[/C][C]0.298433[/C][C]2.152[/C][C]0.018029[/C][/ROW]
[ROW][C]9[/C][C]0.297243[/C][C]2.1434[/C][C]0.018388[/C][/ROW]
[ROW][C]10[/C][C]0.034435[/C][C]0.2483[/C][C]0.402434[/C][/ROW]
[ROW][C]11[/C][C]-0.128212[/C][C]-0.9245[/C][C]0.179736[/C][/ROW]
[ROW][C]12[/C][C]-0.296651[/C][C]-2.1392[/C][C]0.018568[/C][/ROW]
[ROW][C]13[/C][C]-0.205443[/C][C]-1.4815[/C][C]0.072258[/C][/ROW]
[ROW][C]14[/C][C]0.016764[/C][C]0.1209[/C][C]0.452123[/C][/ROW]
[ROW][C]15[/C][C]0.113484[/C][C]0.8183[/C][C]0.208448[/C][/ROW]
[ROW][C]16[/C][C]0.178556[/C][C]1.2876[/C][C]0.101796[/C][/ROW]
[ROW][C]17[/C][C]0.055313[/C][C]0.3989[/C][C]0.345813[/C][/ROW]
[ROW][C]18[/C][C]0.027605[/C][C]0.1991[/C][C]0.421496[/C][/ROW]
[ROW][C]19[/C][C]-0.115261[/C][C]-0.8312[/C][C]0.204842[/C][/ROW]
[ROW][C]20[/C][C]-0.043803[/C][C]-0.3159[/C][C]0.376683[/C][/ROW]
[ROW][C]21[/C][C]-0.013477[/C][C]-0.0972[/C][C]0.461478[/C][/ROW]
[ROW][C]22[/C][C]0.006571[/C][C]0.0474[/C][C]0.481193[/C][/ROW]
[ROW][C]23[/C][C]0.066554[/C][C]0.4799[/C][C]0.316645[/C][/ROW]
[ROW][C]24[/C][C]0.017987[/C][C]0.1297[/C][C]0.448651[/C][/ROW]
[ROW][C]25[/C][C]0.086964[/C][C]0.6271[/C][C]0.266666[/C][/ROW]
[ROW][C]26[/C][C]-0.006042[/C][C]-0.0436[/C][C]0.482707[/C][/ROW]
[ROW][C]27[/C][C]-0.111381[/C][C]-0.8032[/C][C]0.212764[/C][/ROW]
[ROW][C]28[/C][C]-0.15201[/C][C]-1.0962[/C][C]0.139029[/C][/ROW]
[ROW][C]29[/C][C]-0.129726[/C][C]-0.9355[/C][C]0.176936[/C][/ROW]
[ROW][C]30[/C][C]-0.018331[/C][C]-0.1322[/C][C]0.447673[/C][/ROW]
[ROW][C]31[/C][C]0.19859[/C][C]1.4321[/C][C]0.079056[/C][/ROW]
[ROW][C]32[/C][C]0.272423[/C][C]1.9645[/C][C]0.027415[/C][/ROW]
[ROW][C]33[/C][C]0.091303[/C][C]0.6584[/C][C]0.256594[/C][/ROW]
[ROW][C]34[/C][C]-0.044845[/C][C]-0.3234[/C][C]0.373852[/C][/ROW]
[ROW][C]35[/C][C]-0.186395[/C][C]-1.3441[/C][C]0.092373[/C][/ROW]
[ROW][C]36[/C][C]-0.183704[/C][C]-1.3247[/C][C]0.09553[/C][/ROW]
[/TABLE]
Source: https://freestatistics.org/blog/index.php?pk=68736&T=1

Globally Unique Identifier (entire table): ba.freestatistics.org/blog/index.php?pk=68736&T=1

As an alternative you can also use a QR Code:  

The GUIDs for individual cells are displayed in the table below:

Autocorrelation Function
Time lag kACF(k)T-STATP-value
10.4479953.23050.001072
2-0.062807-0.45290.326249
3-0.517186-3.72950.000238
4-0.600334-4.32913.4e-05
5-0.31904-2.30060.012727
60.0113390.08180.467574
70.2915682.10250.020183
80.2984332.1520.018029
90.2972432.14340.018388
100.0344350.24830.402434
11-0.128212-0.92450.179736
12-0.296651-2.13920.018568
13-0.205443-1.48150.072258
140.0167640.12090.452123
150.1134840.81830.208448
160.1785561.28760.101796
170.0553130.39890.345813
180.0276050.19910.421496
19-0.115261-0.83120.204842
20-0.043803-0.31590.376683
21-0.013477-0.09720.461478
220.0065710.04740.481193
230.0665540.47990.316645
240.0179870.12970.448651
250.0869640.62710.266666
26-0.006042-0.04360.482707
27-0.111381-0.80320.212764
28-0.15201-1.09620.139029
29-0.129726-0.93550.176936
30-0.018331-0.13220.447673
310.198591.43210.079056
320.2724231.96450.027415
330.0913030.65840.256594
34-0.044845-0.32340.373852
35-0.186395-1.34410.092373
36-0.183704-1.32470.09553


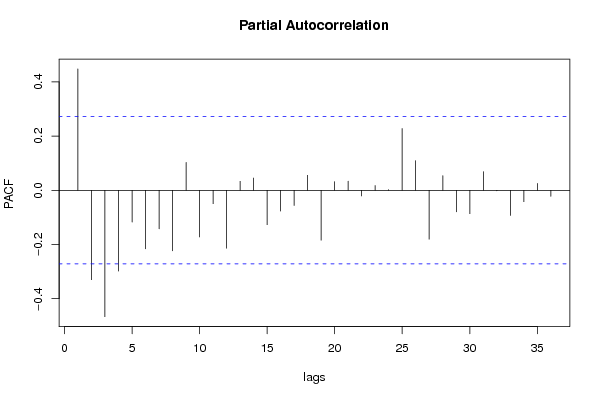
Partial Autocorrelation Function
Time lag kPACF(k)T-STATP-value
10.4479953.23050.001072
2-0.329671-2.37730.010577
3-0.466125-3.36130.00073
4-0.297995-2.14890.01816
5-0.117069-0.84420.201212
6-0.215884-1.55680.062797
7-0.141969-1.02380.155346
8-0.223234-1.60980.056752
90.1031660.74390.230131
10-0.171771-1.23870.110517
11-0.049221-0.35490.362035
12-0.21329-1.53810.065049
130.0335180.24170.40498
140.045430.32760.372264
15-0.126984-0.91570.182026
16-0.076371-0.55070.292092
17-0.055577-0.40080.345116
180.0552880.39870.345878
19-0.184005-1.32690.095173
200.0317640.22910.409863
210.0336390.24260.404646
22-0.020607-0.14860.441222
230.0175460.12650.449902
240.0023420.01690.493294
250.2278491.6430.053204
260.1092790.7880.21713
27-0.180174-1.29930.099794
280.0539540.38910.349406
29-0.079061-0.57010.285526
30-0.08603-0.62040.268861
310.0690210.49770.310391
32-0.001814-0.01310.494808
33-0.0928-0.66920.253168
34-0.041845-0.30170.382023
350.0254160.18330.427645
36-0.021899-0.15790.437567

\begin{tabular}{lllllllll}
\hline
Partial Autocorrelation Function \tabularnewline
Time lag k & PACF(k) & T-STAT & P-value \tabularnewline
1 & 0.447995 & 3.2305 & 0.001072 \tabularnewline
2 & -0.329671 & -2.3773 & 0.010577 \tabularnewline
3 & -0.466125 & -3.3613 & 0.00073 \tabularnewline
4 & -0.297995 & -2.1489 & 0.01816 \tabularnewline
5 & -0.117069 & -0.8442 & 0.201212 \tabularnewline
6 & -0.215884 & -1.5568 & 0.062797 \tabularnewline
7 & -0.141969 & -1.0238 & 0.155346 \tabularnewline
8 & -0.223234 & -1.6098 & 0.056752 \tabularnewline
9 & 0.103166 & 0.7439 & 0.230131 \tabularnewline
10 & -0.171771 & -1.2387 & 0.110517 \tabularnewline
11 & -0.049221 & -0.3549 & 0.362035 \tabularnewline
12 & -0.21329 & -1.5381 & 0.065049 \tabularnewline
13 & 0.033518 & 0.2417 & 0.40498 \tabularnewline
14 & 0.04543 & 0.3276 & 0.372264 \tabularnewline
15 & -0.126984 & -0.9157 & 0.182026 \tabularnewline
16 & -0.076371 & -0.5507 & 0.292092 \tabularnewline
17 & -0.055577 & -0.4008 & 0.345116 \tabularnewline
18 & 0.055288 & 0.3987 & 0.345878 \tabularnewline
19 & -0.184005 & -1.3269 & 0.095173 \tabularnewline
20 & 0.031764 & 0.2291 & 0.409863 \tabularnewline
21 & 0.033639 & 0.2426 & 0.404646 \tabularnewline
22 & -0.020607 & -0.1486 & 0.441222 \tabularnewline
23 & 0.017546 & 0.1265 & 0.449902 \tabularnewline
24 & 0.002342 & 0.0169 & 0.493294 \tabularnewline
25 & 0.227849 & 1.643 & 0.053204 \tabularnewline
26 & 0.109279 & 0.788 & 0.21713 \tabularnewline
27 & -0.180174 & -1.2993 & 0.099794 \tabularnewline
28 & 0.053954 & 0.3891 & 0.349406 \tabularnewline
29 & -0.079061 & -0.5701 & 0.285526 \tabularnewline
30 & -0.08603 & -0.6204 & 0.268861 \tabularnewline
31 & 0.069021 & 0.4977 & 0.310391 \tabularnewline
32 & -0.001814 & -0.0131 & 0.494808 \tabularnewline
33 & -0.0928 & -0.6692 & 0.253168 \tabularnewline
34 & -0.041845 & -0.3017 & 0.382023 \tabularnewline
35 & 0.025416 & 0.1833 & 0.427645 \tabularnewline
36 & -0.021899 & -0.1579 & 0.437567 \tabularnewline
\hline
\end{tabular}
%Source: https://freestatistics.org/blog/index.php?pk=68736&T=2

[TABLE]
[ROW][C]Partial Autocorrelation Function[/C][/ROW]
[ROW][C]Time lag k[/C][C]PACF(k)[/C][C]T-STAT[/C][C]P-value[/C][/ROW]
[ROW][C]1[/C][C]0.447995[/C][C]3.2305[/C][C]0.001072[/C][/ROW]
[ROW][C]2[/C][C]-0.329671[/C][C]-2.3773[/C][C]0.010577[/C][/ROW]
[ROW][C]3[/C][C]-0.466125[/C][C]-3.3613[/C][C]0.00073[/C][/ROW]
[ROW][C]4[/C][C]-0.297995[/C][C]-2.1489[/C][C]0.01816[/C][/ROW]
[ROW][C]5[/C][C]-0.117069[/C][C]-0.8442[/C][C]0.201212[/C][/ROW]
[ROW][C]6[/C][C]-0.215884[/C][C]-1.5568[/C][C]0.062797[/C][/ROW]
[ROW][C]7[/C][C]-0.141969[/C][C]-1.0238[/C][C]0.155346[/C][/ROW]
[ROW][C]8[/C][C]-0.223234[/C][C]-1.6098[/C][C]0.056752[/C][/ROW]
[ROW][C]9[/C][C]0.103166[/C][C]0.7439[/C][C]0.230131[/C][/ROW]
[ROW][C]10[/C][C]-0.171771[/C][C]-1.2387[/C][C]0.110517[/C][/ROW]
[ROW][C]11[/C][C]-0.049221[/C][C]-0.3549[/C][C]0.362035[/C][/ROW]
[ROW][C]12[/C][C]-0.21329[/C][C]-1.5381[/C][C]0.065049[/C][/ROW]
[ROW][C]13[/C][C]0.033518[/C][C]0.2417[/C][C]0.40498[/C][/ROW]
[ROW][C]14[/C][C]0.04543[/C][C]0.3276[/C][C]0.372264[/C][/ROW]
[ROW][C]15[/C][C]-0.126984[/C][C]-0.9157[/C][C]0.182026[/C][/ROW]
[ROW][C]16[/C][C]-0.076371[/C][C]-0.5507[/C][C]0.292092[/C][/ROW]
[ROW][C]17[/C][C]-0.055577[/C][C]-0.4008[/C][C]0.345116[/C][/ROW]
[ROW][C]18[/C][C]0.055288[/C][C]0.3987[/C][C]0.345878[/C][/ROW]
[ROW][C]19[/C][C]-0.184005[/C][C]-1.3269[/C][C]0.095173[/C][/ROW]
[ROW][C]20[/C][C]0.031764[/C][C]0.2291[/C][C]0.409863[/C][/ROW]
[ROW][C]21[/C][C]0.033639[/C][C]0.2426[/C][C]0.404646[/C][/ROW]
[ROW][C]22[/C][C]-0.020607[/C][C]-0.1486[/C][C]0.441222[/C][/ROW]
[ROW][C]23[/C][C]0.017546[/C][C]0.1265[/C][C]0.449902[/C][/ROW]
[ROW][C]24[/C][C]0.002342[/C][C]0.0169[/C][C]0.493294[/C][/ROW]
[ROW][C]25[/C][C]0.227849[/C][C]1.643[/C][C]0.053204[/C][/ROW]
[ROW][C]26[/C][C]0.109279[/C][C]0.788[/C][C]0.21713[/C][/ROW]
[ROW][C]27[/C][C]-0.180174[/C][C]-1.2993[/C][C]0.099794[/C][/ROW]
[ROW][C]28[/C][C]0.053954[/C][C]0.3891[/C][C]0.349406[/C][/ROW]
[ROW][C]29[/C][C]-0.079061[/C][C]-0.5701[/C][C]0.285526[/C][/ROW]
[ROW][C]30[/C][C]-0.08603[/C][C]-0.6204[/C][C]0.268861[/C][/ROW]
[ROW][C]31[/C][C]0.069021[/C][C]0.4977[/C][C]0.310391[/C][/ROW]
[ROW][C]32[/C][C]-0.001814[/C][C]-0.0131[/C][C]0.494808[/C][/ROW]
[ROW][C]33[/C][C]-0.0928[/C][C]-0.6692[/C][C]0.253168[/C][/ROW]
[ROW][C]34[/C][C]-0.041845[/C][C]-0.3017[/C][C]0.382023[/C][/ROW]
[ROW][C]35[/C][C]0.025416[/C][C]0.1833[/C][C]0.427645[/C][/ROW]
[ROW][C]36[/C][C]-0.021899[/C][C]-0.1579[/C][C]0.437567[/C][/ROW]
[/TABLE]
Source: https://freestatistics.org/blog/index.php?pk=68736&T=2

Globally Unique Identifier (entire table): ba.freestatistics.org/blog/index.php?pk=68736&T=2

As an alternative you can also use a QR Code:  

The GUIDs for individual cells are displayed in the table below:

Partial Autocorrelation Function
Time lag kPACF(k)T-STATP-value
10.4479953.23050.001072
2-0.329671-2.37730.010577
3-0.466125-3.36130.00073
4-0.297995-2.14890.01816
5-0.117069-0.84420.201212
6-0.215884-1.55680.062797
7-0.141969-1.02380.155346
8-0.223234-1.60980.056752
90.1031660.74390.230131
10-0.171771-1.23870.110517
11-0.049221-0.35490.362035
12-0.21329-1.53810.065049
130.0335180.24170.40498
140.045430.32760.372264
15-0.126984-0.91570.182026
16-0.076371-0.55070.292092
17-0.055577-0.40080.345116
180.0552880.39870.345878
19-0.184005-1.32690.095173
200.0317640.22910.409863
210.0336390.24260.404646
22-0.020607-0.14860.441222
230.0175460.12650.449902
240.0023420.01690.493294
250.2278491.6430.053204
260.1092790.7880.21713
27-0.180174-1.29930.099794
280.0539540.38910.349406
29-0.079061-0.57010.285526
30-0.08603-0.62040.268861
310.0690210.49770.310391
32-0.001814-0.01310.494808
33-0.0928-0.66920.253168
34-0.041845-0.30170.382023
350.0254160.18330.427645
36-0.021899-0.15790.437567


Parameters (Session):
par1 = 36 ; par2 = 1 ; par3 = 1 ; par4 = 1 ; par5 = 12 ; par6 = MA ; par7 = 0.95 ;
Parameters (R input):
par1 = 36 ; par2 = 1 ; par3 = 1 ; par4 = 1 ; par5 = 12 ; par6 = MA ; par7 = 0.95 ;
R code (references can be found in the software module):
if (par1 == 'Default') {
par1 = 10*log10(length(x))
} else {
par1 <- as.numeric(par1)
}
par2 <- as.numeric(par2)
par3 <- as.numeric(par3)
par4 <- as.numeric(par4)
par5 <- as.numeric(par5)
if (par6 == 'White Noise') par6 <- 'white' else par6 <- 'ma'
par7 <- as.numeric(par7)
if (par2 == 0) {
x <- log(x)
} else {
x <- (x ^ par2 - 1) / par2
}
if (par3 > 0) x <- diff(x,lag=1,difference=par3)
if (par4 > 0) x <- diff(x,lag=par5,difference=par4)
bitmap(file='pic1.png')
racf <- acf(x, par1, main='Autocorrelation', xlab='time lag', ylab='ACF', ci.type=par6, ci=par7, sub=paste('(lambda=',par2,', d=',par3,', D=',par4,', CI=', par7, ', CI type=',par6,')',sep=''))
dev.off()
bitmap(file='pic2.png')
rpacf <- pacf(x,par1,main='Partial Autocorrelation',xlab='lags',ylab='PACF')
dev.off()
(myacf <- c(racf$acf))
(mypacf <- c(rpacf$acf))
lengthx <- length(x)
sqrtn <- sqrt(lengthx)
load(file='createtable')
a<-table.start()
a<-table.row.start(a)
a<-table.element(a,'Autocorrelation Function',4,TRUE)
a<-table.row.end(a)
a<-table.row.start(a)
a<-table.element(a,'Time lag k',header=TRUE)
a<-table.element(a,hyperlink('basics.htm','ACF(k)','click here for more information about the Autocorrelation Function'),header=TRUE)
a<-table.element(a,'T-STAT',header=TRUE)
a<-table.element(a,'P-value',header=TRUE)
a<-table.row.end(a)
for (i in 2:(par1+1)) {
a<-table.row.start(a)
a<-table.element(a,i-1,header=TRUE)
a<-table.element(a,round(myacf[i],6))
mytstat <- myacf[i]*sqrtn
a<-table.element(a,round(mytstat,4))
a<-table.element(a,round(1-pt(abs(mytstat),lengthx),6))
a<-table.row.end(a)
}
a<-table.end(a)
table.save(a,file='mytable.tab')
a<-table.start()
a<-table.row.start(a)
a<-table.element(a,'Partial Autocorrelation Function',4,TRUE)
a<-table.row.end(a)
a<-table.row.start(a)
a<-table.element(a,'Time lag k',header=TRUE)
a<-table.element(a,hyperlink('basics.htm','PACF(k)','click here for more information about the Partial Autocorrelation Function'),header=TRUE)
a<-table.element(a,'T-STAT',header=TRUE)
a<-table.element(a,'P-value',header=TRUE)
a<-table.row.end(a)
for (i in 1:par1) {
a<-table.row.start(a)
a<-table.element(a,i,header=TRUE)
a<-table.element(a,round(mypacf[i],6))
mytstat <- mypacf[i]*sqrtn
a<-table.element(a,round(mytstat,4))
a<-table.element(a,round(1-pt(abs(mytstat),lengthx),6))
a<-table.row.end(a)
}
a<-table.end(a)
table.save(a,file='mytable1.tab')