Free Statistics

of Irreproducible Research!

Author's title

Author*The author of this computation has been verified*
R Software Modulerwasp_arimabackwardselection.wasp
Title produced by softwareARIMA Backward Selection
Date of computationThu, 17 Dec 2009 04:12:19 -0700
Cite this page as followsStatistical Computations at FreeStatistics.org, Office for Research Development and Education, URL https://freestatistics.org/blog/index.php?v=date/2009/Dec/17/t1261048392oamts13ba0eph39.htm/, Retrieved Tue, 30 Apr 2024 05:15:04 +0000
Statistical Computations at FreeStatistics.org, Office for Research Development and Education, URL https://freestatistics.org/blog/index.php?pk=68742, Retrieved Tue, 30 Apr 2024 05:15:04 +0000
QR Codes:

Original text written by user:
IsPrivate?No (this computation is public)
User-defined keywords
Estimated Impact89
Family? (F = Feedback message, R = changed R code, M = changed R Module, P = changed Parameters, D = changed Data)
-     [Univariate Data Series] [data set] [2008-12-01 19:54:57] [b98453cac15ba1066b407e146608df68]
- RMP   [ARIMA Backward Selection] [] [2009-11-27 14:53:14] [b98453cac15ba1066b407e146608df68]
-   PD      [ARIMA Backward Selection] [] [2009-12-17 11:12:19] [e76c6d261190c0179bc6006a5cdb804c] [Current]
Feedback Forum

Post a new message
Dataseries X:
359640
364080
364080
359640
359640
359640
359640
359640
364080
368520
372960
377400
406780
402050
392590
368940
368940
378400
406780
420970
420970
406780
392590
392590
394250
399000
403750
399000
408500
403750
403750
399000
403750
403750
403750
403750
405450
405450
405450
405450
410220
400680
386370
381600
381600
381600
381600
376830
381420
381420
386310
396090
391200
371640
356970
342300
332520
342300
347190
352080
357130
347070
337010
337010
331980


Summary of computational transaction
Raw Inputview raw input (R code)
Raw Outputview raw output of R engine
Computing time8 seconds
R Server'Gwilym Jenkins' @ 72.249.127.135

\begin{tabular}{lllllllll}
\hline
Summary of computational transaction \tabularnewline
Raw Input & view raw input (R code)  \tabularnewline
Raw Output & view raw output of R engine  \tabularnewline
Computing time & 8 seconds \tabularnewline
R Server & 'Gwilym Jenkins' @ 72.249.127.135 \tabularnewline
\hline
\end{tabular}
%Source: https://freestatistics.org/blog/index.php?pk=68742&T=0

[TABLE]
[ROW][C]Summary of computational transaction[/C][/ROW]
[ROW][C]Raw Input[/C][C]view raw input (R code) [/C][/ROW]
[ROW][C]Raw Output[/C][C]view raw output of R engine [/C][/ROW]
[ROW][C]Computing time[/C][C]8 seconds[/C][/ROW]
[ROW][C]R Server[/C][C]'Gwilym Jenkins' @ 72.249.127.135[/C][/ROW]
[/TABLE]
Source: https://freestatistics.org/blog/index.php?pk=68742&T=0

Globally Unique Identifier (entire table): ba.freestatistics.org/blog/index.php?pk=68742&T=0

As an alternative you can also use a QR Code:  

The GUIDs for individual cells are displayed in the table below:

Summary of computational transaction
Raw Inputview raw input (R code)
Raw Outputview raw output of R engine
Computing time8 seconds
R Server'Gwilym Jenkins' @ 72.249.127.135


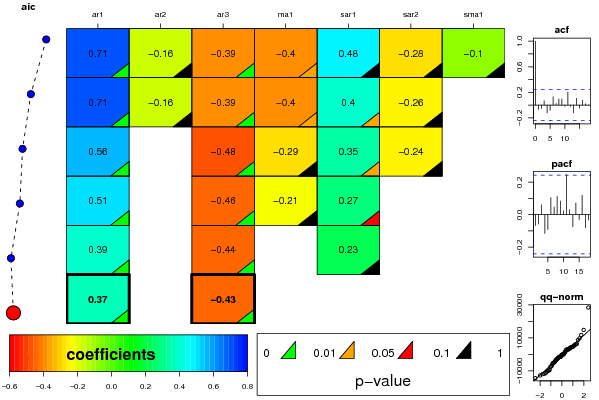
ARIMA Parameter Estimation and Backward Selection
Iterationar1ar2ar3ma1sar1sar2sma1
Estimates ( 1 )0.7054-0.1583-0.3892-0.4010.4784-0.279-0.0953
(p-val)(5e-04 )(0.3563 )(0.0043 )(0.0412 )(0.3858 )(0.2126 )(0.8749 )
Estimates ( 2 )0.7095-0.1609-0.3912-0.40040.3968-0.2560
(p-val)(4e-04 )(0.3488 )(0.0039 )(0.0386 )(0.029 )(0.156 )(NA )
Estimates ( 3 )0.55950-0.4783-0.29030.3517-0.24250
(p-val)(1e-04 )(NA )(0 )(0.1715 )(0.0491 )(0.187 )(NA )
Estimates ( 4 )0.51370-0.4577-0.20940.269800
(p-val)(8e-04 )(NA )(0 )(0.3274 )(0.0858 )(NA )(NA )
Estimates ( 5 )0.39220-0.437100.233700
(p-val)(2e-04 )(NA )(0 )(NA )(0.1238 )(NA )(NA )
Estimates ( 6 )0.36810-0.4320000
(p-val)(5e-04 )(NA )(0 )(NA )(NA )(NA )(NA )
Estimates ( 7 )NANANANANANANA
(p-val)(NA )(NA )(NA )(NA )(NA )(NA )(NA )
Estimates ( 8 )NANANANANANANA
(p-val)(NA )(NA )(NA )(NA )(NA )(NA )(NA )
Estimates ( 9 )NANANANANANANA
(p-val)(NA )(NA )(NA )(NA )(NA )(NA )(NA )
Estimates ( 10 )NANANANANANANA
(p-val)(NA )(NA )(NA )(NA )(NA )(NA )(NA )
Estimates ( 11 )NANANANANANANA
(p-val)(NA )(NA )(NA )(NA )(NA )(NA )(NA )
Estimates ( 12 )NANANANANANANA
(p-val)(NA )(NA )(NA )(NA )(NA )(NA )(NA )
Estimates ( 13 )NANANANANANANA
(p-val)(NA )(NA )(NA )(NA )(NA )(NA )(NA )

\begin{tabular}{lllllllll}
\hline
ARIMA Parameter Estimation and Backward Selection \tabularnewline
Iteration & ar1 & ar2 & ar3 & ma1 & sar1 & sar2 & sma1 \tabularnewline
Estimates ( 1 ) & 0.7054 & -0.1583 & -0.3892 & -0.401 & 0.4784 & -0.279 & -0.0953 \tabularnewline
(p-val) & (5e-04 ) & (0.3563 ) & (0.0043 ) & (0.0412 ) & (0.3858 ) & (0.2126 ) & (0.8749 ) \tabularnewline
Estimates ( 2 ) & 0.7095 & -0.1609 & -0.3912 & -0.4004 & 0.3968 & -0.256 & 0 \tabularnewline
(p-val) & (4e-04 ) & (0.3488 ) & (0.0039 ) & (0.0386 ) & (0.029 ) & (0.156 ) & (NA ) \tabularnewline
Estimates ( 3 ) & 0.5595 & 0 & -0.4783 & -0.2903 & 0.3517 & -0.2425 & 0 \tabularnewline
(p-val) & (1e-04 ) & (NA ) & (0 ) & (0.1715 ) & (0.0491 ) & (0.187 ) & (NA ) \tabularnewline
Estimates ( 4 ) & 0.5137 & 0 & -0.4577 & -0.2094 & 0.2698 & 0 & 0 \tabularnewline
(p-val) & (8e-04 ) & (NA ) & (0 ) & (0.3274 ) & (0.0858 ) & (NA ) & (NA ) \tabularnewline
Estimates ( 5 ) & 0.3922 & 0 & -0.4371 & 0 & 0.2337 & 0 & 0 \tabularnewline
(p-val) & (2e-04 ) & (NA ) & (0 ) & (NA ) & (0.1238 ) & (NA ) & (NA ) \tabularnewline
Estimates ( 6 ) & 0.3681 & 0 & -0.432 & 0 & 0 & 0 & 0 \tabularnewline
(p-val) & (5e-04 ) & (NA ) & (0 ) & (NA ) & (NA ) & (NA ) & (NA ) \tabularnewline
Estimates ( 7 ) & NA & NA & NA & NA & NA & NA & NA \tabularnewline
(p-val) & (NA ) & (NA ) & (NA ) & (NA ) & (NA ) & (NA ) & (NA ) \tabularnewline
Estimates ( 8 ) & NA & NA & NA & NA & NA & NA & NA \tabularnewline
(p-val) & (NA ) & (NA ) & (NA ) & (NA ) & (NA ) & (NA ) & (NA ) \tabularnewline
Estimates ( 9 ) & NA & NA & NA & NA & NA & NA & NA \tabularnewline
(p-val) & (NA ) & (NA ) & (NA ) & (NA ) & (NA ) & (NA ) & (NA ) \tabularnewline
Estimates ( 10 ) & NA & NA & NA & NA & NA & NA & NA \tabularnewline
(p-val) & (NA ) & (NA ) & (NA ) & (NA ) & (NA ) & (NA ) & (NA ) \tabularnewline
Estimates ( 11 ) & NA & NA & NA & NA & NA & NA & NA \tabularnewline
(p-val) & (NA ) & (NA ) & (NA ) & (NA ) & (NA ) & (NA ) & (NA ) \tabularnewline
Estimates ( 12 ) & NA & NA & NA & NA & NA & NA & NA \tabularnewline
(p-val) & (NA ) & (NA ) & (NA ) & (NA ) & (NA ) & (NA ) & (NA ) \tabularnewline
Estimates ( 13 ) & NA & NA & NA & NA & NA & NA & NA \tabularnewline
(p-val) & (NA ) & (NA ) & (NA ) & (NA ) & (NA ) & (NA ) & (NA ) \tabularnewline
\hline
\end{tabular}
%Source: https://freestatistics.org/blog/index.php?pk=68742&T=1

[TABLE]
[ROW][C]ARIMA Parameter Estimation and Backward Selection[/C][/ROW]
[ROW][C]Iteration[/C][C]ar1[/C][C]ar2[/C][C]ar3[/C][C]ma1[/C][C]sar1[/C][C]sar2[/C][C]sma1[/C][/ROW]
[ROW][C]Estimates ( 1 )[/C][C]0.7054[/C][C]-0.1583[/C][C]-0.3892[/C][C]-0.401[/C][C]0.4784[/C][C]-0.279[/C][C]-0.0953[/C][/ROW]
[ROW][C](p-val)[/C][C](5e-04 )[/C][C](0.3563 )[/C][C](0.0043 )[/C][C](0.0412 )[/C][C](0.3858 )[/C][C](0.2126 )[/C][C](0.8749 )[/C][/ROW]
[ROW][C]Estimates ( 2 )[/C][C]0.7095[/C][C]-0.1609[/C][C]-0.3912[/C][C]-0.4004[/C][C]0.3968[/C][C]-0.256[/C][C]0[/C][/ROW]
[ROW][C](p-val)[/C][C](4e-04 )[/C][C](0.3488 )[/C][C](0.0039 )[/C][C](0.0386 )[/C][C](0.029 )[/C][C](0.156 )[/C][C](NA )[/C][/ROW]
[ROW][C]Estimates ( 3 )[/C][C]0.5595[/C][C]0[/C][C]-0.4783[/C][C]-0.2903[/C][C]0.3517[/C][C]-0.2425[/C][C]0[/C][/ROW]
[ROW][C](p-val)[/C][C](1e-04 )[/C][C](NA )[/C][C](0 )[/C][C](0.1715 )[/C][C](0.0491 )[/C][C](0.187 )[/C][C](NA )[/C][/ROW]
[ROW][C]Estimates ( 4 )[/C][C]0.5137[/C][C]0[/C][C]-0.4577[/C][C]-0.2094[/C][C]0.2698[/C][C]0[/C][C]0[/C][/ROW]
[ROW][C](p-val)[/C][C](8e-04 )[/C][C](NA )[/C][C](0 )[/C][C](0.3274 )[/C][C](0.0858 )[/C][C](NA )[/C][C](NA )[/C][/ROW]
[ROW][C]Estimates ( 5 )[/C][C]0.3922[/C][C]0[/C][C]-0.4371[/C][C]0[/C][C]0.2337[/C][C]0[/C][C]0[/C][/ROW]
[ROW][C](p-val)[/C][C](2e-04 )[/C][C](NA )[/C][C](0 )[/C][C](NA )[/C][C](0.1238 )[/C][C](NA )[/C][C](NA )[/C][/ROW]
[ROW][C]Estimates ( 6 )[/C][C]0.3681[/C][C]0[/C][C]-0.432[/C][C]0[/C][C]0[/C][C]0[/C][C]0[/C][/ROW]
[ROW][C](p-val)[/C][C](5e-04 )[/C][C](NA )[/C][C](0 )[/C][C](NA )[/C][C](NA )[/C][C](NA )[/C][C](NA )[/C][/ROW]
[ROW][C]Estimates ( 7 )[/C][C]NA[/C][C]NA[/C][C]NA[/C][C]NA[/C][C]NA[/C][C]NA[/C][C]NA[/C][/ROW]
[ROW][C](p-val)[/C][C](NA )[/C][C](NA )[/C][C](NA )[/C][C](NA )[/C][C](NA )[/C][C](NA )[/C][C](NA )[/C][/ROW]
[ROW][C]Estimates ( 8 )[/C][C]NA[/C][C]NA[/C][C]NA[/C][C]NA[/C][C]NA[/C][C]NA[/C][C]NA[/C][/ROW]
[ROW][C](p-val)[/C][C](NA )[/C][C](NA )[/C][C](NA )[/C][C](NA )[/C][C](NA )[/C][C](NA )[/C][C](NA )[/C][/ROW]
[ROW][C]Estimates ( 9 )[/C][C]NA[/C][C]NA[/C][C]NA[/C][C]NA[/C][C]NA[/C][C]NA[/C][C]NA[/C][/ROW]
[ROW][C](p-val)[/C][C](NA )[/C][C](NA )[/C][C](NA )[/C][C](NA )[/C][C](NA )[/C][C](NA )[/C][C](NA )[/C][/ROW]
[ROW][C]Estimates ( 10 )[/C][C]NA[/C][C]NA[/C][C]NA[/C][C]NA[/C][C]NA[/C][C]NA[/C][C]NA[/C][/ROW]
[ROW][C](p-val)[/C][C](NA )[/C][C](NA )[/C][C](NA )[/C][C](NA )[/C][C](NA )[/C][C](NA )[/C][C](NA )[/C][/ROW]
[ROW][C]Estimates ( 11 )[/C][C]NA[/C][C]NA[/C][C]NA[/C][C]NA[/C][C]NA[/C][C]NA[/C][C]NA[/C][/ROW]
[ROW][C](p-val)[/C][C](NA )[/C][C](NA )[/C][C](NA )[/C][C](NA )[/C][C](NA )[/C][C](NA )[/C][C](NA )[/C][/ROW]
[ROW][C]Estimates ( 12 )[/C][C]NA[/C][C]NA[/C][C]NA[/C][C]NA[/C][C]NA[/C][C]NA[/C][C]NA[/C][/ROW]
[ROW][C](p-val)[/C][C](NA )[/C][C](NA )[/C][C](NA )[/C][C](NA )[/C][C](NA )[/C][C](NA )[/C][C](NA )[/C][/ROW]
[ROW][C]Estimates ( 13 )[/C][C]NA[/C][C]NA[/C][C]NA[/C][C]NA[/C][C]NA[/C][C]NA[/C][C]NA[/C][/ROW]
[ROW][C](p-val)[/C][C](NA )[/C][C](NA )[/C][C](NA )[/C][C](NA )[/C][C](NA )[/C][C](NA )[/C][C](NA )[/C][/ROW]
[/TABLE]
Source: https://freestatistics.org/blog/index.php?pk=68742&T=1

Globally Unique Identifier (entire table): ba.freestatistics.org/blog/index.php?pk=68742&T=1

As an alternative you can also use a QR Code:  

The GUIDs for individual cells are displayed in the table below:

ARIMA Parameter Estimation and Backward Selection
Iterationar1ar2ar3ma1sar1sar2sma1
Estimates ( 1 )0.7054-0.1583-0.3892-0.4010.4784-0.279-0.0953
(p-val)(5e-04 )(0.3563 )(0.0043 )(0.0412 )(0.3858 )(0.2126 )(0.8749 )
Estimates ( 2 )0.7095-0.1609-0.3912-0.40040.3968-0.2560
(p-val)(4e-04 )(0.3488 )(0.0039 )(0.0386 )(0.029 )(0.156 )(NA )
Estimates ( 3 )0.55950-0.4783-0.29030.3517-0.24250
(p-val)(1e-04 )(NA )(0 )(0.1715 )(0.0491 )(0.187 )(NA )
Estimates ( 4 )0.51370-0.4577-0.20940.269800
(p-val)(8e-04 )(NA )(0 )(0.3274 )(0.0858 )(NA )(NA )
Estimates ( 5 )0.39220-0.437100.233700
(p-val)(2e-04 )(NA )(0 )(NA )(0.1238 )(NA )(NA )
Estimates ( 6 )0.36810-0.4320000
(p-val)(5e-04 )(NA )(0 )(NA )(NA )(NA )(NA )
Estimates ( 7 )NANANANANANANA
(p-val)(NA )(NA )(NA )(NA )(NA )(NA )(NA )
Estimates ( 8 )NANANANANANANA
(p-val)(NA )(NA )(NA )(NA )(NA )(NA )(NA )
Estimates ( 9 )NANANANANANANA
(p-val)(NA )(NA )(NA )(NA )(NA )(NA )(NA )
Estimates ( 10 )NANANANANANANA
(p-val)(NA )(NA )(NA )(NA )(NA )(NA )(NA )
Estimates ( 11 )NANANANANANANA
(p-val)(NA )(NA )(NA )(NA )(NA )(NA )(NA )
Estimates ( 12 )NANANANANANANA
(p-val)(NA )(NA )(NA )(NA )(NA )(NA )(NA )
Estimates ( 13 )NANANANANANANA
(p-val)(NA )(NA )(NA )(NA )(NA )(NA )(NA )


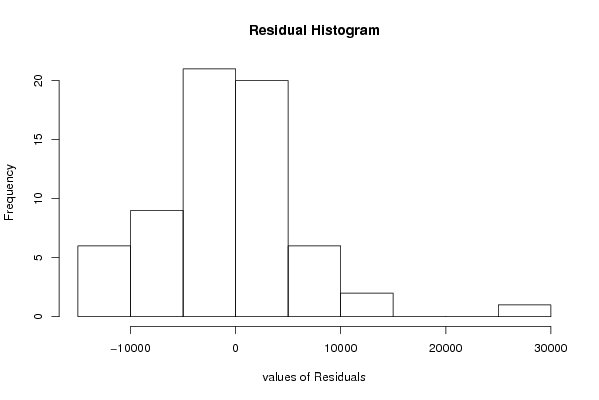
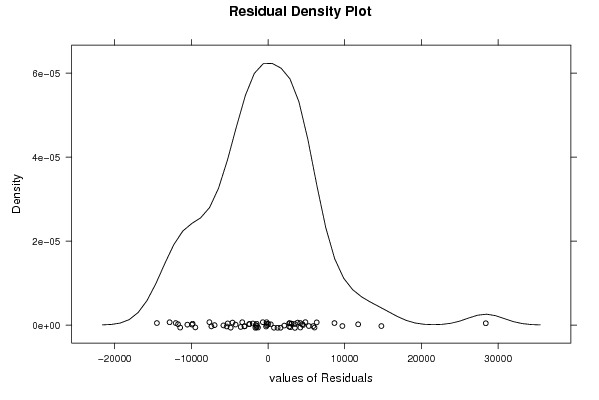
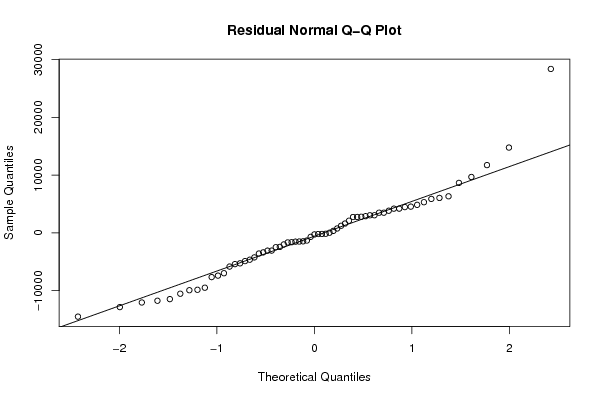
Estimated ARIMA Residuals
Value
359.639711799598
3506.97346186388
-1485.26006302609
-3070.91220875872
3505.61164216642
-140.549396445561
-1984.7944324231
40.6881057277797
4560.04517156331
2903.71063179026
2768.84553255787
4206.57810680445
28398.6352598830
-14491.7111182996
-5393.94489215808
-6971.86173819298
6347.03641919779
5325.02667282819
14786.1265801878
3059.82901804324
-2467.89776960359
-2415.86311423453
-3053.23761401384
4480.68550312542
-11456.2232688311
1241.65049273742
4211.06273102644
-4228.24850019458
11754.4158341798
-7644.16341434507
-3563.37278214388
-1312.73329750536
4870.91146729642
-1445.63560433424
-1510.01506877225
775.470657102124
2761.73414263909
-175.053082165367
-674.824257840693
2119.13877378718
1628.80508664768
-9914.92186961818
-10518.6993270355
3066.78514554817
-3359.60016755236
-5819.49273173814
-1599.68235279084
-5255.28834177676
6063.36549701431
-1644.28849656333
2805.0293054324
9694.83253645065
-9840.4740703946
-12837.7100010733
-253.793357653136
-11738.2605927158
-12038.9468984546
8665.28237144672
-4870.49245208071
-187.705130610615
5896.96907277702
-9482.35187130177
-4632.84496799693
3846.103892799
-7387.76168365241

\begin{tabular}{lllllllll}
\hline
Estimated ARIMA Residuals \tabularnewline
Value \tabularnewline
359.639711799598 \tabularnewline
3506.97346186388 \tabularnewline
-1485.26006302609 \tabularnewline
-3070.91220875872 \tabularnewline
3505.61164216642 \tabularnewline
-140.549396445561 \tabularnewline
-1984.7944324231 \tabularnewline
40.6881057277797 \tabularnewline
4560.04517156331 \tabularnewline
2903.71063179026 \tabularnewline
2768.84553255787 \tabularnewline
4206.57810680445 \tabularnewline
28398.6352598830 \tabularnewline
-14491.7111182996 \tabularnewline
-5393.94489215808 \tabularnewline
-6971.86173819298 \tabularnewline
6347.03641919779 \tabularnewline
5325.02667282819 \tabularnewline
14786.1265801878 \tabularnewline
3059.82901804324 \tabularnewline
-2467.89776960359 \tabularnewline
-2415.86311423453 \tabularnewline
-3053.23761401384 \tabularnewline
4480.68550312542 \tabularnewline
-11456.2232688311 \tabularnewline
1241.65049273742 \tabularnewline
4211.06273102644 \tabularnewline
-4228.24850019458 \tabularnewline
11754.4158341798 \tabularnewline
-7644.16341434507 \tabularnewline
-3563.37278214388 \tabularnewline
-1312.73329750536 \tabularnewline
4870.91146729642 \tabularnewline
-1445.63560433424 \tabularnewline
-1510.01506877225 \tabularnewline
775.470657102124 \tabularnewline
2761.73414263909 \tabularnewline
-175.053082165367 \tabularnewline
-674.824257840693 \tabularnewline
2119.13877378718 \tabularnewline
1628.80508664768 \tabularnewline
-9914.92186961818 \tabularnewline
-10518.6993270355 \tabularnewline
3066.78514554817 \tabularnewline
-3359.60016755236 \tabularnewline
-5819.49273173814 \tabularnewline
-1599.68235279084 \tabularnewline
-5255.28834177676 \tabularnewline
6063.36549701431 \tabularnewline
-1644.28849656333 \tabularnewline
2805.0293054324 \tabularnewline
9694.83253645065 \tabularnewline
-9840.4740703946 \tabularnewline
-12837.7100010733 \tabularnewline
-253.793357653136 \tabularnewline
-11738.2605927158 \tabularnewline
-12038.9468984546 \tabularnewline
8665.28237144672 \tabularnewline
-4870.49245208071 \tabularnewline
-187.705130610615 \tabularnewline
5896.96907277702 \tabularnewline
-9482.35187130177 \tabularnewline
-4632.84496799693 \tabularnewline
3846.103892799 \tabularnewline
-7387.76168365241 \tabularnewline
\hline
\end{tabular}
%Source: https://freestatistics.org/blog/index.php?pk=68742&T=2

[TABLE]
[ROW][C]Estimated ARIMA Residuals[/C][/ROW]
[ROW][C]Value[/C][/ROW]
[ROW][C]359.639711799598[/C][/ROW]
[ROW][C]3506.97346186388[/C][/ROW]
[ROW][C]-1485.26006302609[/C][/ROW]
[ROW][C]-3070.91220875872[/C][/ROW]
[ROW][C]3505.61164216642[/C][/ROW]
[ROW][C]-140.549396445561[/C][/ROW]
[ROW][C]-1984.7944324231[/C][/ROW]
[ROW][C]40.6881057277797[/C][/ROW]
[ROW][C]4560.04517156331[/C][/ROW]
[ROW][C]2903.71063179026[/C][/ROW]
[ROW][C]2768.84553255787[/C][/ROW]
[ROW][C]4206.57810680445[/C][/ROW]
[ROW][C]28398.6352598830[/C][/ROW]
[ROW][C]-14491.7111182996[/C][/ROW]
[ROW][C]-5393.94489215808[/C][/ROW]
[ROW][C]-6971.86173819298[/C][/ROW]
[ROW][C]6347.03641919779[/C][/ROW]
[ROW][C]5325.02667282819[/C][/ROW]
[ROW][C]14786.1265801878[/C][/ROW]
[ROW][C]3059.82901804324[/C][/ROW]
[ROW][C]-2467.89776960359[/C][/ROW]
[ROW][C]-2415.86311423453[/C][/ROW]
[ROW][C]-3053.23761401384[/C][/ROW]
[ROW][C]4480.68550312542[/C][/ROW]
[ROW][C]-11456.2232688311[/C][/ROW]
[ROW][C]1241.65049273742[/C][/ROW]
[ROW][C]4211.06273102644[/C][/ROW]
[ROW][C]-4228.24850019458[/C][/ROW]
[ROW][C]11754.4158341798[/C][/ROW]
[ROW][C]-7644.16341434507[/C][/ROW]
[ROW][C]-3563.37278214388[/C][/ROW]
[ROW][C]-1312.73329750536[/C][/ROW]
[ROW][C]4870.91146729642[/C][/ROW]
[ROW][C]-1445.63560433424[/C][/ROW]
[ROW][C]-1510.01506877225[/C][/ROW]
[ROW][C]775.470657102124[/C][/ROW]
[ROW][C]2761.73414263909[/C][/ROW]
[ROW][C]-175.053082165367[/C][/ROW]
[ROW][C]-674.824257840693[/C][/ROW]
[ROW][C]2119.13877378718[/C][/ROW]
[ROW][C]1628.80508664768[/C][/ROW]
[ROW][C]-9914.92186961818[/C][/ROW]
[ROW][C]-10518.6993270355[/C][/ROW]
[ROW][C]3066.78514554817[/C][/ROW]
[ROW][C]-3359.60016755236[/C][/ROW]
[ROW][C]-5819.49273173814[/C][/ROW]
[ROW][C]-1599.68235279084[/C][/ROW]
[ROW][C]-5255.28834177676[/C][/ROW]
[ROW][C]6063.36549701431[/C][/ROW]
[ROW][C]-1644.28849656333[/C][/ROW]
[ROW][C]2805.0293054324[/C][/ROW]
[ROW][C]9694.83253645065[/C][/ROW]
[ROW][C]-9840.4740703946[/C][/ROW]
[ROW][C]-12837.7100010733[/C][/ROW]
[ROW][C]-253.793357653136[/C][/ROW]
[ROW][C]-11738.2605927158[/C][/ROW]
[ROW][C]-12038.9468984546[/C][/ROW]
[ROW][C]8665.28237144672[/C][/ROW]
[ROW][C]-4870.49245208071[/C][/ROW]
[ROW][C]-187.705130610615[/C][/ROW]
[ROW][C]5896.96907277702[/C][/ROW]
[ROW][C]-9482.35187130177[/C][/ROW]
[ROW][C]-4632.84496799693[/C][/ROW]
[ROW][C]3846.103892799[/C][/ROW]
[ROW][C]-7387.76168365241[/C][/ROW]
[/TABLE]
Source: https://freestatistics.org/blog/index.php?pk=68742&T=2

Globally Unique Identifier (entire table): ba.freestatistics.org/blog/index.php?pk=68742&T=2

As an alternative you can also use a QR Code:  

The GUIDs for individual cells are displayed in the table below:

Estimated ARIMA Residuals
Value
359.639711799598
3506.97346186388
-1485.26006302609
-3070.91220875872
3505.61164216642
-140.549396445561
-1984.7944324231
40.6881057277797
4560.04517156331
2903.71063179026
2768.84553255787
4206.57810680445
28398.6352598830
-14491.7111182996
-5393.94489215808
-6971.86173819298
6347.03641919779
5325.02667282819
14786.1265801878
3059.82901804324
-2467.89776960359
-2415.86311423453
-3053.23761401384
4480.68550312542
-11456.2232688311
1241.65049273742
4211.06273102644
-4228.24850019458
11754.4158341798
-7644.16341434507
-3563.37278214388
-1312.73329750536
4870.91146729642
-1445.63560433424
-1510.01506877225
775.470657102124
2761.73414263909
-175.053082165367
-674.824257840693
2119.13877378718
1628.80508664768
-9914.92186961818
-10518.6993270355
3066.78514554817
-3359.60016755236
-5819.49273173814
-1599.68235279084
-5255.28834177676
6063.36549701431
-1644.28849656333
2805.0293054324
9694.83253645065
-9840.4740703946
-12837.7100010733
-253.793357653136
-11738.2605927158
-12038.9468984546
8665.28237144672
-4870.49245208071
-187.705130610615
5896.96907277702
-9482.35187130177
-4632.84496799693
3846.103892799
-7387.76168365241


Parameters (Session):
par1 = FALSE ; par2 = 1 ; par3 = 1 ; par4 = 0 ; par5 = 12 ; par6 = 3 ; par7 = 1 ; par8 = 2 ; par9 = 1 ;
Parameters (R input):
par1 = FALSE ; par2 = 1 ; par3 = 1 ; par4 = 0 ; par5 = 12 ; par6 = 3 ; par7 = 1 ; par8 = 2 ; par9 = 1 ;
R code (references can be found in the software module):
library(lattice)
if (par1 == 'TRUE') par1 <- TRUE
if (par1 == 'FALSE') par1 <- FALSE
par2 <- as.numeric(par2) #Box-Cox lambda transformation parameter
par3 <- as.numeric(par3) #degree of non-seasonal differencing
par4 <- as.numeric(par4) #degree of seasonal differencing
par5 <- as.numeric(par5) #seasonal period
par6 <- as.numeric(par6) #degree (p) of the non-seasonal AR(p) polynomial
par7 <- as.numeric(par7) #degree (q) of the non-seasonal MA(q) polynomial
par8 <- as.numeric(par8) #degree (P) of the seasonal AR(P) polynomial
par9 <- as.numeric(par9) #degree (Q) of the seasonal MA(Q) polynomial
armaGR <- function(arima.out, names, n){
try1 <- arima.out$coef
try2 <- sqrt(diag(arima.out$var.coef))
try.data.frame <- data.frame(matrix(NA,ncol=4,nrow=length(names)))
dimnames(try.data.frame) <- list(names,c('coef','std','tstat','pv'))
try.data.frame[,1] <- try1
for(i in 1:length(try2)) try.data.frame[which(rownames(try.data.frame)==names(try2)[i]),2] <- try2[i]
try.data.frame[,3] <- try.data.frame[,1] / try.data.frame[,2]
try.data.frame[,4] <- round((1-pt(abs(try.data.frame[,3]),df=n-(length(try2)+1)))*2,5)
vector <- rep(NA,length(names))
vector[is.na(try.data.frame[,4])] <- 0
maxi <- which.max(try.data.frame[,4])
continue <- max(try.data.frame[,4],na.rm=TRUE) > .05
vector[maxi] <- 0
list(summary=try.data.frame,next.vector=vector,continue=continue)
}
arimaSelect <- function(series, order=c(13,0,0), seasonal=list(order=c(2,0,0),period=12), include.mean=F){
nrc <- order[1]+order[3]+seasonal$order[1]+seasonal$order[3]
coeff <- matrix(NA, nrow=nrc*2, ncol=nrc)
pval <- matrix(NA, nrow=nrc*2, ncol=nrc)
mylist <- rep(list(NULL), nrc)
names <- NULL
if(order[1] > 0) names <- paste('ar',1:order[1],sep='')
if(order[3] > 0) names <- c( names , paste('ma',1:order[3],sep='') )
if(seasonal$order[1] > 0) names <- c(names, paste('sar',1:seasonal$order[1],sep=''))
if(seasonal$order[3] > 0) names <- c(names, paste('sma',1:seasonal$order[3],sep=''))
arima.out <- arima(series, order=order, seasonal=seasonal, include.mean=include.mean, method='ML')
mylist[[1]] <- arima.out
last.arma <- armaGR(arima.out, names, length(series))
mystop <- FALSE
i <- 1
coeff[i,] <- last.arma[[1]][,1]
pval [i,] <- last.arma[[1]][,4]
i <- 2
aic <- arima.out$aic
while(!mystop){
mylist[[i]] <- arima.out
arima.out <- arima(series, order=order, seasonal=seasonal, include.mean=include.mean, method='ML', fixed=last.arma$next.vector)
aic <- c(aic, arima.out$aic)
last.arma <- armaGR(arima.out, names, length(series))
mystop <- !last.arma$continue
coeff[i,] <- last.arma[[1]][,1]
pval [i,] <- last.arma[[1]][,4]
i <- i+1
}
list(coeff, pval, mylist, aic=aic)
}
arimaSelectplot <- function(arimaSelect.out,noms,choix){
noms <- names(arimaSelect.out[[3]][[1]]$coef)
coeff <- arimaSelect.out[[1]]
k <- min(which(is.na(coeff[,1])))-1
coeff <- coeff[1:k,]
pval <- arimaSelect.out[[2]][1:k,]
aic <- arimaSelect.out$aic[1:k]
coeff[coeff==0] <- NA
n <- ncol(coeff)
if(missing(choix)) choix <- k
layout(matrix(c(1,1,1,2,
3,3,3,2,
3,3,3,4,
5,6,7,7),nr=4),
widths=c(10,35,45,15),
heights=c(30,30,15,15))
couleurs <- rainbow(75)[1:50]#(50)
ticks <- pretty(coeff)
par(mar=c(1,1,3,1))
plot(aic,k:1-.5,type='o',pch=21,bg='blue',cex=2,axes=F,lty=2,xpd=NA)
points(aic[choix],k-choix+.5,pch=21,cex=4,bg=2,xpd=NA)
title('aic',line=2)
par(mar=c(3,0,0,0))
plot(0,axes=F,xlab='',ylab='',xlim=range(ticks),ylim=c(.1,1))
rect(xleft = min(ticks) + (0:49)/50*(max(ticks)-min(ticks)),
xright = min(ticks) + (1:50)/50*(max(ticks)-min(ticks)),
ytop = rep(1,50),
ybottom= rep(0,50),col=couleurs,border=NA)
axis(1,ticks)
rect(xleft=min(ticks),xright=max(ticks),ytop=1,ybottom=0)
text(mean(coeff,na.rm=T),.5,'coefficients',cex=2,font=2)
par(mar=c(1,1,3,1))
image(1:n,1:k,t(coeff[k:1,]),axes=F,col=couleurs,zlim=range(ticks))
for(i in 1:n) for(j in 1:k) if(!is.na(coeff[j,i])) {
if(pval[j,i]<.01) symb = 'green'
else if( (pval[j,i]<.05) & (pval[j,i]>=.01)) symb = 'orange'
else if( (pval[j,i]<.1) & (pval[j,i]>=.05)) symb = 'red'
else symb = 'black'
polygon(c(i+.5 ,i+.2 ,i+.5 ,i+.5),
c(k-j+0.5,k-j+0.5,k-j+0.8,k-j+0.5),
col=symb)
if(j==choix) {
rect(xleft=i-.5,
xright=i+.5,
ybottom=k-j+1.5,
ytop=k-j+.5,
lwd=4)
text(i,
k-j+1,
round(coeff[j,i],2),
cex=1.2,
font=2)
}
else{
rect(xleft=i-.5,xright=i+.5,ybottom=k-j+1.5,ytop=k-j+.5)
text(i,k-j+1,round(coeff[j,i],2),cex=1.2,font=1)
}
}
axis(3,1:n,noms)
par(mar=c(0.5,0,0,0.5))
plot(0,axes=F,xlab='',ylab='',type='n',xlim=c(0,8),ylim=c(-.2,.8))
cols <- c('green','orange','red','black')
niv <- c('0','0.01','0.05','0.1')
for(i in 0:3){
polygon(c(1+2*i ,1+2*i ,1+2*i-.5 ,1+2*i),
c(.4 ,.7 , .4 , .4),
col=cols[i+1])
text(2*i,0.5,niv[i+1],cex=1.5)
}
text(8,.5,1,cex=1.5)
text(4,0,'p-value',cex=2)
box()
residus <- arimaSelect.out[[3]][[choix]]$res
par(mar=c(1,2,4,1))
acf(residus,main='')
title('acf',line=.5)
par(mar=c(1,2,4,1))
pacf(residus,main='')
title('pacf',line=.5)
par(mar=c(2,2,4,1))
qqnorm(residus,main='')
title('qq-norm',line=.5)
qqline(residus)
residus
}
if (par2 == 0) x <- log(x)
if (par2 != 0) x <- x^par2
(selection <- arimaSelect(x, order=c(par6,par3,par7), seasonal=list(order=c(par8,par4,par9), period=par5)))
bitmap(file='test1.png')
resid <- arimaSelectplot(selection)
dev.off()
resid
bitmap(file='test2.png')
acf(resid,length(resid)/2, main='Residual Autocorrelation Function')
dev.off()
bitmap(file='test3.png')
pacf(resid,length(resid)/2, main='Residual Partial Autocorrelation Function')
dev.off()
bitmap(file='test4.png')
cpgram(resid, main='Residual Cumulative Periodogram')
dev.off()
bitmap(file='test5.png')
hist(resid, main='Residual Histogram', xlab='values of Residuals')
dev.off()
bitmap(file='test6.png')
densityplot(~resid,col='black',main='Residual Density Plot', xlab='values of Residuals')
dev.off()
bitmap(file='test7.png')
qqnorm(resid, main='Residual Normal Q-Q Plot')
qqline(resid)
dev.off()
ncols <- length(selection[[1]][1,])
nrows <- length(selection[[2]][,1])-1
load(file='createtable')
a<-table.start()
a<-table.row.start(a)
a<-table.element(a,'ARIMA Parameter Estimation and Backward Selection', ncols+1,TRUE)
a<-table.row.end(a)
a<-table.row.start(a)
a<-table.element(a,'Iteration', header=TRUE)
for (i in 1:ncols) {
a<-table.element(a,names(selection[[3]][[1]]$coef)[i],header=TRUE)
}
a<-table.row.end(a)
for (j in 1:nrows) {
a<-table.row.start(a)
mydum <- 'Estimates ('
mydum <- paste(mydum,j)
mydum <- paste(mydum,')')
a<-table.element(a,mydum, header=TRUE)
for (i in 1:ncols) {
a<-table.element(a,round(selection[[1]][j,i],4))
}
a<-table.row.end(a)
a<-table.row.start(a)
a<-table.element(a,'(p-val)', header=TRUE)
for (i in 1:ncols) {
mydum <- '('
mydum <- paste(mydum,round(selection[[2]][j,i],4),sep='')
mydum <- paste(mydum,')')
a<-table.element(a,mydum)
}
a<-table.row.end(a)
}
a<-table.end(a)
table.save(a,file='mytable.tab')
a<-table.start()
a<-table.row.start(a)
a<-table.element(a,'Estimated ARIMA Residuals', 1,TRUE)
a<-table.row.end(a)
a<-table.row.start(a)
a<-table.element(a,'Value', 1,TRUE)
a<-table.row.end(a)
for (i in (par4*par5+par3):length(resid)) {
a<-table.row.start(a)
a<-table.element(a,resid[i])
a<-table.row.end(a)
}
a<-table.end(a)
table.save(a,file='mytable1.tab')