Free Statistics

of Irreproducible Research!

Author's title

Author*The author of this computation has been verified*
R Software Modulerwasp_autocorrelation.wasp
Title produced by software(Partial) Autocorrelation Function
Date of computationThu, 17 Dec 2009 04:49:21 -0700
Cite this page as followsStatistical Computations at FreeStatistics.org, Office for Research Development and Education, URL https://freestatistics.org/blog/index.php?v=date/2009/Dec/17/t1261050633eu0ed8n7yohpf92.htm/, Retrieved Tue, 30 Apr 2024 00:27:16 +0000
Statistical Computations at FreeStatistics.org, Office for Research Development and Education, URL https://freestatistics.org/blog/index.php?pk=68772, Retrieved Tue, 30 Apr 2024 00:27:16 +0000
QR Codes:

Original text written by user:
IsPrivate?No (this computation is public)
User-defined keywords
Estimated Impact98
Family? (F = Feedback message, R = changed R code, M = changed R Module, P = changed Parameters, D = changed Data)
-       [(Partial) Autocorrelation Function] [] [2009-12-17 11:49:21] [71596e6a53ccce532e52aaf6113616ef] [Current]
Feedback Forum

Post a new message
Dataseries X:
1322.4
1089.2
1147.3
1196.4
1190.2
1146
1139.8
1045.6
1050.9
1117.3
1120
1052.1
1065.8
1092.5
1422
1367.5
1136.3
1293.7
1154.8
1206.7
1199
1265
1247.1
1116.5
1153.9
1077.4
1132.5
1058.8
1195.1
1263.4
1023.1
1141
1116.3
1135.6
1210.5
1230
1136.5
1068.7
1372.5
1049.9
1302.2
1305.9
1173.5
1277.4
1238.6
1508.6
1423.4
1375.1
1344.1
1287.5
1446.9
1451
1604.4
1501.5
1522.8
1328
1420.5
1648
1631.1
1396.6
1663.4
1283
1582.4
1785.2
1853.6
1994.1
2042.8
1586.1
1942.4
1763.6
1819.9
1836
1449.9
1513.3
1677.7
1494.4
1375.3
1577.7
1537.7
1356.6
1469.6


Summary of computational transaction
Raw Inputview raw input (R code)
Raw Outputview raw output of R engine
Computing time2 seconds
R Server'Gwilym Jenkins' @ 72.249.127.135

\begin{tabular}{lllllllll}
\hline
Summary of computational transaction \tabularnewline
Raw Input & view raw input (R code)  \tabularnewline
Raw Output & view raw output of R engine  \tabularnewline
Computing time & 2 seconds \tabularnewline
R Server & 'Gwilym Jenkins' @ 72.249.127.135 \tabularnewline
\hline
\end{tabular}
%Source: https://freestatistics.org/blog/index.php?pk=68772&T=0

[TABLE]
[ROW][C]Summary of computational transaction[/C][/ROW]
[ROW][C]Raw Input[/C][C]view raw input (R code) [/C][/ROW]
[ROW][C]Raw Output[/C][C]view raw output of R engine [/C][/ROW]
[ROW][C]Computing time[/C][C]2 seconds[/C][/ROW]
[ROW][C]R Server[/C][C]'Gwilym Jenkins' @ 72.249.127.135[/C][/ROW]
[/TABLE]
Source: https://freestatistics.org/blog/index.php?pk=68772&T=0

Globally Unique Identifier (entire table): ba.freestatistics.org/blog/index.php?pk=68772&T=0

As an alternative you can also use a QR Code:  

The GUIDs for individual cells are displayed in the table below:

Summary of computational transaction
Raw Inputview raw input (R code)
Raw Outputview raw output of R engine
Computing time2 seconds
R Server'Gwilym Jenkins' @ 72.249.127.135


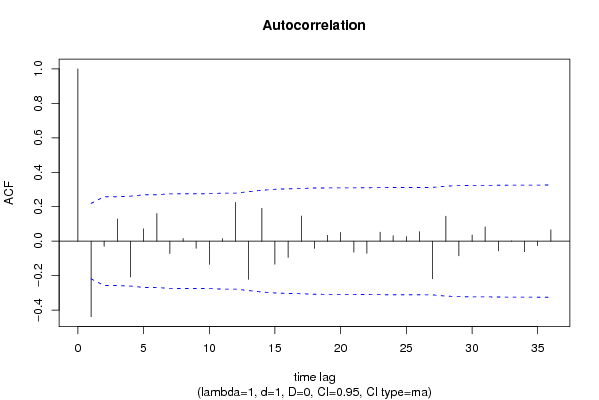
Autocorrelation Function
Time lag kACF(k)T-STATP-value
1-0.43863-3.92329.2e-05
2-0.029948-0.26790.394748
30.128641.15060.126663
4-0.207954-1.860.033281
50.0714450.6390.262317
60.1604031.43470.077637
7-0.072526-0.64870.259197
80.0147440.13190.447708
9-0.041708-0.3730.355051
10-0.135657-1.21340.114282
110.0150950.1350.446469
120.2243912.0070.024063
13-0.22195-1.98520.025276
140.1909651.7080.045753
15-0.13401-1.19860.117107
16-0.094402-0.84440.200494
170.1456971.30310.098131
18-0.042458-0.37980.352568
190.0338340.30260.381482
200.0502080.44910.327295
21-0.064204-0.57430.283703
22-0.070922-0.63430.263834
230.0517280.46270.322428
240.0314410.28120.389635
250.0265310.23730.406515
260.0551080.49290.311717
27-0.218817-1.95720.026908
280.1446581.29390.099719
29-0.085311-0.7630.223839
300.0350710.31370.377288
310.0820870.73420.232483
32-0.056136-0.50210.308489
330.0008530.00760.496966
34-0.061025-0.54580.293352
35-0.026632-0.23820.406167
360.0659490.58990.278473

\begin{tabular}{lllllllll}
\hline
Autocorrelation Function \tabularnewline
Time lag k & ACF(k) & T-STAT & P-value \tabularnewline
1 & -0.43863 & -3.9232 & 9.2e-05 \tabularnewline
2 & -0.029948 & -0.2679 & 0.394748 \tabularnewline
3 & 0.12864 & 1.1506 & 0.126663 \tabularnewline
4 & -0.207954 & -1.86 & 0.033281 \tabularnewline
5 & 0.071445 & 0.639 & 0.262317 \tabularnewline
6 & 0.160403 & 1.4347 & 0.077637 \tabularnewline
7 & -0.072526 & -0.6487 & 0.259197 \tabularnewline
8 & 0.014744 & 0.1319 & 0.447708 \tabularnewline
9 & -0.041708 & -0.373 & 0.355051 \tabularnewline
10 & -0.135657 & -1.2134 & 0.114282 \tabularnewline
11 & 0.015095 & 0.135 & 0.446469 \tabularnewline
12 & 0.224391 & 2.007 & 0.024063 \tabularnewline
13 & -0.22195 & -1.9852 & 0.025276 \tabularnewline
14 & 0.190965 & 1.708 & 0.045753 \tabularnewline
15 & -0.13401 & -1.1986 & 0.117107 \tabularnewline
16 & -0.094402 & -0.8444 & 0.200494 \tabularnewline
17 & 0.145697 & 1.3031 & 0.098131 \tabularnewline
18 & -0.042458 & -0.3798 & 0.352568 \tabularnewline
19 & 0.033834 & 0.3026 & 0.381482 \tabularnewline
20 & 0.050208 & 0.4491 & 0.327295 \tabularnewline
21 & -0.064204 & -0.5743 & 0.283703 \tabularnewline
22 & -0.070922 & -0.6343 & 0.263834 \tabularnewline
23 & 0.051728 & 0.4627 & 0.322428 \tabularnewline
24 & 0.031441 & 0.2812 & 0.389635 \tabularnewline
25 & 0.026531 & 0.2373 & 0.406515 \tabularnewline
26 & 0.055108 & 0.4929 & 0.311717 \tabularnewline
27 & -0.218817 & -1.9572 & 0.026908 \tabularnewline
28 & 0.144658 & 1.2939 & 0.099719 \tabularnewline
29 & -0.085311 & -0.763 & 0.223839 \tabularnewline
30 & 0.035071 & 0.3137 & 0.377288 \tabularnewline
31 & 0.082087 & 0.7342 & 0.232483 \tabularnewline
32 & -0.056136 & -0.5021 & 0.308489 \tabularnewline
33 & 0.000853 & 0.0076 & 0.496966 \tabularnewline
34 & -0.061025 & -0.5458 & 0.293352 \tabularnewline
35 & -0.026632 & -0.2382 & 0.406167 \tabularnewline
36 & 0.065949 & 0.5899 & 0.278473 \tabularnewline
\hline
\end{tabular}
%Source: https://freestatistics.org/blog/index.php?pk=68772&T=1

[TABLE]
[ROW][C]Autocorrelation Function[/C][/ROW]
[ROW][C]Time lag k[/C][C]ACF(k)[/C][C]T-STAT[/C][C]P-value[/C][/ROW]
[ROW][C]1[/C][C]-0.43863[/C][C]-3.9232[/C][C]9.2e-05[/C][/ROW]
[ROW][C]2[/C][C]-0.029948[/C][C]-0.2679[/C][C]0.394748[/C][/ROW]
[ROW][C]3[/C][C]0.12864[/C][C]1.1506[/C][C]0.126663[/C][/ROW]
[ROW][C]4[/C][C]-0.207954[/C][C]-1.86[/C][C]0.033281[/C][/ROW]
[ROW][C]5[/C][C]0.071445[/C][C]0.639[/C][C]0.262317[/C][/ROW]
[ROW][C]6[/C][C]0.160403[/C][C]1.4347[/C][C]0.077637[/C][/ROW]
[ROW][C]7[/C][C]-0.072526[/C][C]-0.6487[/C][C]0.259197[/C][/ROW]
[ROW][C]8[/C][C]0.014744[/C][C]0.1319[/C][C]0.447708[/C][/ROW]
[ROW][C]9[/C][C]-0.041708[/C][C]-0.373[/C][C]0.355051[/C][/ROW]
[ROW][C]10[/C][C]-0.135657[/C][C]-1.2134[/C][C]0.114282[/C][/ROW]
[ROW][C]11[/C][C]0.015095[/C][C]0.135[/C][C]0.446469[/C][/ROW]
[ROW][C]12[/C][C]0.224391[/C][C]2.007[/C][C]0.024063[/C][/ROW]
[ROW][C]13[/C][C]-0.22195[/C][C]-1.9852[/C][C]0.025276[/C][/ROW]
[ROW][C]14[/C][C]0.190965[/C][C]1.708[/C][C]0.045753[/C][/ROW]
[ROW][C]15[/C][C]-0.13401[/C][C]-1.1986[/C][C]0.117107[/C][/ROW]
[ROW][C]16[/C][C]-0.094402[/C][C]-0.8444[/C][C]0.200494[/C][/ROW]
[ROW][C]17[/C][C]0.145697[/C][C]1.3031[/C][C]0.098131[/C][/ROW]
[ROW][C]18[/C][C]-0.042458[/C][C]-0.3798[/C][C]0.352568[/C][/ROW]
[ROW][C]19[/C][C]0.033834[/C][C]0.3026[/C][C]0.381482[/C][/ROW]
[ROW][C]20[/C][C]0.050208[/C][C]0.4491[/C][C]0.327295[/C][/ROW]
[ROW][C]21[/C][C]-0.064204[/C][C]-0.5743[/C][C]0.283703[/C][/ROW]
[ROW][C]22[/C][C]-0.070922[/C][C]-0.6343[/C][C]0.263834[/C][/ROW]
[ROW][C]23[/C][C]0.051728[/C][C]0.4627[/C][C]0.322428[/C][/ROW]
[ROW][C]24[/C][C]0.031441[/C][C]0.2812[/C][C]0.389635[/C][/ROW]
[ROW][C]25[/C][C]0.026531[/C][C]0.2373[/C][C]0.406515[/C][/ROW]
[ROW][C]26[/C][C]0.055108[/C][C]0.4929[/C][C]0.311717[/C][/ROW]
[ROW][C]27[/C][C]-0.218817[/C][C]-1.9572[/C][C]0.026908[/C][/ROW]
[ROW][C]28[/C][C]0.144658[/C][C]1.2939[/C][C]0.099719[/C][/ROW]
[ROW][C]29[/C][C]-0.085311[/C][C]-0.763[/C][C]0.223839[/C][/ROW]
[ROW][C]30[/C][C]0.035071[/C][C]0.3137[/C][C]0.377288[/C][/ROW]
[ROW][C]31[/C][C]0.082087[/C][C]0.7342[/C][C]0.232483[/C][/ROW]
[ROW][C]32[/C][C]-0.056136[/C][C]-0.5021[/C][C]0.308489[/C][/ROW]
[ROW][C]33[/C][C]0.000853[/C][C]0.0076[/C][C]0.496966[/C][/ROW]
[ROW][C]34[/C][C]-0.061025[/C][C]-0.5458[/C][C]0.293352[/C][/ROW]
[ROW][C]35[/C][C]-0.026632[/C][C]-0.2382[/C][C]0.406167[/C][/ROW]
[ROW][C]36[/C][C]0.065949[/C][C]0.5899[/C][C]0.278473[/C][/ROW]
[/TABLE]
Source: https://freestatistics.org/blog/index.php?pk=68772&T=1

Globally Unique Identifier (entire table): ba.freestatistics.org/blog/index.php?pk=68772&T=1

As an alternative you can also use a QR Code:  

The GUIDs for individual cells are displayed in the table below:

Autocorrelation Function
Time lag kACF(k)T-STATP-value
1-0.43863-3.92329.2e-05
2-0.029948-0.26790.394748
30.128641.15060.126663
4-0.207954-1.860.033281
50.0714450.6390.262317
60.1604031.43470.077637
7-0.072526-0.64870.259197
80.0147440.13190.447708
9-0.041708-0.3730.355051
10-0.135657-1.21340.114282
110.0150950.1350.446469
120.2243912.0070.024063
13-0.22195-1.98520.025276
140.1909651.7080.045753
15-0.13401-1.19860.117107
16-0.094402-0.84440.200494
170.1456971.30310.098131
18-0.042458-0.37980.352568
190.0338340.30260.381482
200.0502080.44910.327295
21-0.064204-0.57430.283703
22-0.070922-0.63430.263834
230.0517280.46270.322428
240.0314410.28120.389635
250.0265310.23730.406515
260.0551080.49290.311717
27-0.218817-1.95720.026908
280.1446581.29390.099719
29-0.085311-0.7630.223839
300.0350710.31370.377288
310.0820870.73420.232483
32-0.056136-0.50210.308489
330.0008530.00760.496966
34-0.061025-0.54580.293352
35-0.026632-0.23820.406167
360.0659490.58990.278473


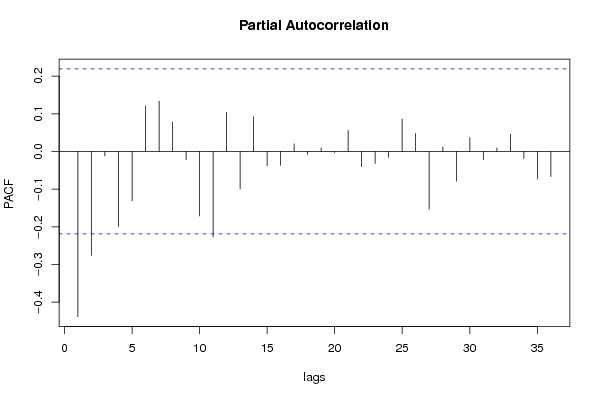
Partial Autocorrelation Function
Time lag kPACF(k)T-STATP-value
1-0.43863-3.92329.2e-05
2-0.275313-2.46250.007973
3-0.011888-0.10630.457795
4-0.199966-1.78850.038737
5-0.131161-1.17310.122111
60.1205271.0780.142131
70.1336261.19520.117773
80.0781550.6990.243278
9-0.021583-0.1930.423707
10-0.171245-1.53170.064775
11-0.227197-2.03210.02273
120.1040360.93050.177449
13-0.099796-0.89260.187374
140.0924530.82690.20537
15-0.038066-0.34050.367198
16-0.036647-0.32780.371966
170.0201760.18050.428623
18-0.008232-0.07360.470744
190.00960.08590.465893
20-0.002892-0.02590.489713
210.0559770.50070.308988
22-0.040262-0.36010.359856
23-0.031932-0.28560.38796
24-0.015838-0.14170.443851
250.0860890.770.221782
260.0479840.42920.334472
27-0.153509-1.3730.08679
280.0116050.10380.458796
29-0.079066-0.70720.240752
300.0367890.3290.371489
31-0.021943-0.19630.42245
320.0089790.08030.468096
330.0455910.40780.342264
34-0.018373-0.16430.434942
35-0.073366-0.65620.256789
36-0.066683-0.59640.276284

\begin{tabular}{lllllllll}
\hline
Partial Autocorrelation Function \tabularnewline
Time lag k & PACF(k) & T-STAT & P-value \tabularnewline
1 & -0.43863 & -3.9232 & 9.2e-05 \tabularnewline
2 & -0.275313 & -2.4625 & 0.007973 \tabularnewline
3 & -0.011888 & -0.1063 & 0.457795 \tabularnewline
4 & -0.199966 & -1.7885 & 0.038737 \tabularnewline
5 & -0.131161 & -1.1731 & 0.122111 \tabularnewline
6 & 0.120527 & 1.078 & 0.142131 \tabularnewline
7 & 0.133626 & 1.1952 & 0.117773 \tabularnewline
8 & 0.078155 & 0.699 & 0.243278 \tabularnewline
9 & -0.021583 & -0.193 & 0.423707 \tabularnewline
10 & -0.171245 & -1.5317 & 0.064775 \tabularnewline
11 & -0.227197 & -2.0321 & 0.02273 \tabularnewline
12 & 0.104036 & 0.9305 & 0.177449 \tabularnewline
13 & -0.099796 & -0.8926 & 0.187374 \tabularnewline
14 & 0.092453 & 0.8269 & 0.20537 \tabularnewline
15 & -0.038066 & -0.3405 & 0.367198 \tabularnewline
16 & -0.036647 & -0.3278 & 0.371966 \tabularnewline
17 & 0.020176 & 0.1805 & 0.428623 \tabularnewline
18 & -0.008232 & -0.0736 & 0.470744 \tabularnewline
19 & 0.0096 & 0.0859 & 0.465893 \tabularnewline
20 & -0.002892 & -0.0259 & 0.489713 \tabularnewline
21 & 0.055977 & 0.5007 & 0.308988 \tabularnewline
22 & -0.040262 & -0.3601 & 0.359856 \tabularnewline
23 & -0.031932 & -0.2856 & 0.38796 \tabularnewline
24 & -0.015838 & -0.1417 & 0.443851 \tabularnewline
25 & 0.086089 & 0.77 & 0.221782 \tabularnewline
26 & 0.047984 & 0.4292 & 0.334472 \tabularnewline
27 & -0.153509 & -1.373 & 0.08679 \tabularnewline
28 & 0.011605 & 0.1038 & 0.458796 \tabularnewline
29 & -0.079066 & -0.7072 & 0.240752 \tabularnewline
30 & 0.036789 & 0.329 & 0.371489 \tabularnewline
31 & -0.021943 & -0.1963 & 0.42245 \tabularnewline
32 & 0.008979 & 0.0803 & 0.468096 \tabularnewline
33 & 0.045591 & 0.4078 & 0.342264 \tabularnewline
34 & -0.018373 & -0.1643 & 0.434942 \tabularnewline
35 & -0.073366 & -0.6562 & 0.256789 \tabularnewline
36 & -0.066683 & -0.5964 & 0.276284 \tabularnewline
\hline
\end{tabular}
%Source: https://freestatistics.org/blog/index.php?pk=68772&T=2

[TABLE]
[ROW][C]Partial Autocorrelation Function[/C][/ROW]
[ROW][C]Time lag k[/C][C]PACF(k)[/C][C]T-STAT[/C][C]P-value[/C][/ROW]
[ROW][C]1[/C][C]-0.43863[/C][C]-3.9232[/C][C]9.2e-05[/C][/ROW]
[ROW][C]2[/C][C]-0.275313[/C][C]-2.4625[/C][C]0.007973[/C][/ROW]
[ROW][C]3[/C][C]-0.011888[/C][C]-0.1063[/C][C]0.457795[/C][/ROW]
[ROW][C]4[/C][C]-0.199966[/C][C]-1.7885[/C][C]0.038737[/C][/ROW]
[ROW][C]5[/C][C]-0.131161[/C][C]-1.1731[/C][C]0.122111[/C][/ROW]
[ROW][C]6[/C][C]0.120527[/C][C]1.078[/C][C]0.142131[/C][/ROW]
[ROW][C]7[/C][C]0.133626[/C][C]1.1952[/C][C]0.117773[/C][/ROW]
[ROW][C]8[/C][C]0.078155[/C][C]0.699[/C][C]0.243278[/C][/ROW]
[ROW][C]9[/C][C]-0.021583[/C][C]-0.193[/C][C]0.423707[/C][/ROW]
[ROW][C]10[/C][C]-0.171245[/C][C]-1.5317[/C][C]0.064775[/C][/ROW]
[ROW][C]11[/C][C]-0.227197[/C][C]-2.0321[/C][C]0.02273[/C][/ROW]
[ROW][C]12[/C][C]0.104036[/C][C]0.9305[/C][C]0.177449[/C][/ROW]
[ROW][C]13[/C][C]-0.099796[/C][C]-0.8926[/C][C]0.187374[/C][/ROW]
[ROW][C]14[/C][C]0.092453[/C][C]0.8269[/C][C]0.20537[/C][/ROW]
[ROW][C]15[/C][C]-0.038066[/C][C]-0.3405[/C][C]0.367198[/C][/ROW]
[ROW][C]16[/C][C]-0.036647[/C][C]-0.3278[/C][C]0.371966[/C][/ROW]
[ROW][C]17[/C][C]0.020176[/C][C]0.1805[/C][C]0.428623[/C][/ROW]
[ROW][C]18[/C][C]-0.008232[/C][C]-0.0736[/C][C]0.470744[/C][/ROW]
[ROW][C]19[/C][C]0.0096[/C][C]0.0859[/C][C]0.465893[/C][/ROW]
[ROW][C]20[/C][C]-0.002892[/C][C]-0.0259[/C][C]0.489713[/C][/ROW]
[ROW][C]21[/C][C]0.055977[/C][C]0.5007[/C][C]0.308988[/C][/ROW]
[ROW][C]22[/C][C]-0.040262[/C][C]-0.3601[/C][C]0.359856[/C][/ROW]
[ROW][C]23[/C][C]-0.031932[/C][C]-0.2856[/C][C]0.38796[/C][/ROW]
[ROW][C]24[/C][C]-0.015838[/C][C]-0.1417[/C][C]0.443851[/C][/ROW]
[ROW][C]25[/C][C]0.086089[/C][C]0.77[/C][C]0.221782[/C][/ROW]
[ROW][C]26[/C][C]0.047984[/C][C]0.4292[/C][C]0.334472[/C][/ROW]
[ROW][C]27[/C][C]-0.153509[/C][C]-1.373[/C][C]0.08679[/C][/ROW]
[ROW][C]28[/C][C]0.011605[/C][C]0.1038[/C][C]0.458796[/C][/ROW]
[ROW][C]29[/C][C]-0.079066[/C][C]-0.7072[/C][C]0.240752[/C][/ROW]
[ROW][C]30[/C][C]0.036789[/C][C]0.329[/C][C]0.371489[/C][/ROW]
[ROW][C]31[/C][C]-0.021943[/C][C]-0.1963[/C][C]0.42245[/C][/ROW]
[ROW][C]32[/C][C]0.008979[/C][C]0.0803[/C][C]0.468096[/C][/ROW]
[ROW][C]33[/C][C]0.045591[/C][C]0.4078[/C][C]0.342264[/C][/ROW]
[ROW][C]34[/C][C]-0.018373[/C][C]-0.1643[/C][C]0.434942[/C][/ROW]
[ROW][C]35[/C][C]-0.073366[/C][C]-0.6562[/C][C]0.256789[/C][/ROW]
[ROW][C]36[/C][C]-0.066683[/C][C]-0.5964[/C][C]0.276284[/C][/ROW]
[/TABLE]
Source: https://freestatistics.org/blog/index.php?pk=68772&T=2

Globally Unique Identifier (entire table): ba.freestatistics.org/blog/index.php?pk=68772&T=2

As an alternative you can also use a QR Code:  

The GUIDs for individual cells are displayed in the table below:

Partial Autocorrelation Function
Time lag kPACF(k)T-STATP-value
1-0.43863-3.92329.2e-05
2-0.275313-2.46250.007973
3-0.011888-0.10630.457795
4-0.199966-1.78850.038737
5-0.131161-1.17310.122111
60.1205271.0780.142131
70.1336261.19520.117773
80.0781550.6990.243278
9-0.021583-0.1930.423707
10-0.171245-1.53170.064775
11-0.227197-2.03210.02273
120.1040360.93050.177449
13-0.099796-0.89260.187374
140.0924530.82690.20537
15-0.038066-0.34050.367198
16-0.036647-0.32780.371966
170.0201760.18050.428623
18-0.008232-0.07360.470744
190.00960.08590.465893
20-0.002892-0.02590.489713
210.0559770.50070.308988
22-0.040262-0.36010.359856
23-0.031932-0.28560.38796
24-0.015838-0.14170.443851
250.0860890.770.221782
260.0479840.42920.334472
27-0.153509-1.3730.08679
280.0116050.10380.458796
29-0.079066-0.70720.240752
300.0367890.3290.371489
31-0.021943-0.19630.42245
320.0089790.08030.468096
330.0455910.40780.342264
34-0.018373-0.16430.434942
35-0.073366-0.65620.256789
36-0.066683-0.59640.276284


Parameters (Session):
par1 = 36 ; par2 = 1 ; par3 = 1 ; par4 = 0 ; par5 = 12 ; par6 = MA ; par7 = 0.95 ;
Parameters (R input):
par1 = 36 ; par2 = 1 ; par3 = 1 ; par4 = 0 ; par5 = 12 ; par6 = MA ; par7 = 0.95 ;
R code (references can be found in the software module):
if (par1 == 'Default') {
par1 = 10*log10(length(x))
} else {
par1 <- as.numeric(par1)
}
par2 <- as.numeric(par2)
par3 <- as.numeric(par3)
par4 <- as.numeric(par4)
par5 <- as.numeric(par5)
if (par6 == 'White Noise') par6 <- 'white' else par6 <- 'ma'
par7 <- as.numeric(par7)
if (par2 == 0) {
x <- log(x)
} else {
x <- (x ^ par2 - 1) / par2
}
if (par3 > 0) x <- diff(x,lag=1,difference=par3)
if (par4 > 0) x <- diff(x,lag=par5,difference=par4)
bitmap(file='pic1.png')
racf <- acf(x, par1, main='Autocorrelation', xlab='time lag', ylab='ACF', ci.type=par6, ci=par7, sub=paste('(lambda=',par2,', d=',par3,', D=',par4,', CI=', par7, ', CI type=',par6,')',sep=''))
dev.off()
bitmap(file='pic2.png')
rpacf <- pacf(x,par1,main='Partial Autocorrelation',xlab='lags',ylab='PACF')
dev.off()
(myacf <- c(racf$acf))
(mypacf <- c(rpacf$acf))
lengthx <- length(x)
sqrtn <- sqrt(lengthx)
load(file='createtable')
a<-table.start()
a<-table.row.start(a)
a<-table.element(a,'Autocorrelation Function',4,TRUE)
a<-table.row.end(a)
a<-table.row.start(a)
a<-table.element(a,'Time lag k',header=TRUE)
a<-table.element(a,hyperlink('basics.htm','ACF(k)','click here for more information about the Autocorrelation Function'),header=TRUE)
a<-table.element(a,'T-STAT',header=TRUE)
a<-table.element(a,'P-value',header=TRUE)
a<-table.row.end(a)
for (i in 2:(par1+1)) {
a<-table.row.start(a)
a<-table.element(a,i-1,header=TRUE)
a<-table.element(a,round(myacf[i],6))
mytstat <- myacf[i]*sqrtn
a<-table.element(a,round(mytstat,4))
a<-table.element(a,round(1-pt(abs(mytstat),lengthx),6))
a<-table.row.end(a)
}
a<-table.end(a)
table.save(a,file='mytable.tab')
a<-table.start()
a<-table.row.start(a)
a<-table.element(a,'Partial Autocorrelation Function',4,TRUE)
a<-table.row.end(a)
a<-table.row.start(a)
a<-table.element(a,'Time lag k',header=TRUE)
a<-table.element(a,hyperlink('basics.htm','PACF(k)','click here for more information about the Partial Autocorrelation Function'),header=TRUE)
a<-table.element(a,'T-STAT',header=TRUE)
a<-table.element(a,'P-value',header=TRUE)
a<-table.row.end(a)
for (i in 1:par1) {
a<-table.row.start(a)
a<-table.element(a,i,header=TRUE)
a<-table.element(a,round(mypacf[i],6))
mytstat <- mypacf[i]*sqrtn
a<-table.element(a,round(mytstat,4))
a<-table.element(a,round(1-pt(abs(mytstat),lengthx),6))
a<-table.row.end(a)
}
a<-table.end(a)
table.save(a,file='mytable1.tab')