Free Statistics

of Irreproducible Research!

Author's title

Author*The author of this computation has been verified*
R Software Modulerwasp_autocorrelation.wasp
Title produced by software(Partial) Autocorrelation Function
Date of computationThu, 17 Dec 2009 04:54:33 -0700
Cite this page as followsStatistical Computations at FreeStatistics.org, Office for Research Development and Education, URL https://freestatistics.org/blog/index.php?v=date/2009/Dec/17/t1261050985pctgb5bdpalr5z1.htm/, Retrieved Tue, 30 Apr 2024 04:07:12 +0000
Statistical Computations at FreeStatistics.org, Office for Research Development and Education, URL https://freestatistics.org/blog/index.php?pk=68774, Retrieved Tue, 30 Apr 2024 04:07:12 +0000
QR Codes:

Original text written by user:
IsPrivate?No (this computation is public)
User-defined keywords
Estimated Impact104
Family? (F = Feedback message, R = changed R code, M = changed R Module, P = changed Parameters, D = changed Data)
-       [(Partial) Autocorrelation Function] [] [2009-12-17 11:54:33] [71596e6a53ccce532e52aaf6113616ef] [Current]
Feedback Forum

Post a new message
Dataseries X:
1322.4
1089.2
1147.3
1196.4
1190.2
1146
1139.8
1045.6
1050.9
1117.3
1120
1052.1
1065.8
1092.5
1422
1367.5
1136.3
1293.7
1154.8
1206.7
1199
1265
1247.1
1116.5
1153.9
1077.4
1132.5
1058.8
1195.1
1263.4
1023.1
1141
1116.3
1135.6
1210.5
1230
1136.5
1068.7
1372.5
1049.9
1302.2
1305.9
1173.5
1277.4
1238.6
1508.6
1423.4
1375.1
1344.1
1287.5
1446.9
1451
1604.4
1501.5
1522.8
1328
1420.5
1648
1631.1
1396.6
1663.4
1283
1582.4
1785.2
1853.6
1994.1
2042.8
1586.1
1942.4
1763.6
1819.9
1836
1449.9
1513.3
1677.7
1494.4
1375.3
1577.7
1537.7
1356.6
1469.6


Summary of computational transaction
Raw Inputview raw input (R code)
Raw Outputview raw output of R engine
Computing time1 seconds
R Server'Gwilym Jenkins' @ 72.249.127.135

\begin{tabular}{lllllllll}
\hline
Summary of computational transaction \tabularnewline
Raw Input & view raw input (R code)  \tabularnewline
Raw Output & view raw output of R engine  \tabularnewline
Computing time & 1 seconds \tabularnewline
R Server & 'Gwilym Jenkins' @ 72.249.127.135 \tabularnewline
\hline
\end{tabular}
%Source: https://freestatistics.org/blog/index.php?pk=68774&T=0

[TABLE]
[ROW][C]Summary of computational transaction[/C][/ROW]
[ROW][C]Raw Input[/C][C]view raw input (R code) [/C][/ROW]
[ROW][C]Raw Output[/C][C]view raw output of R engine [/C][/ROW]
[ROW][C]Computing time[/C][C]1 seconds[/C][/ROW]
[ROW][C]R Server[/C][C]'Gwilym Jenkins' @ 72.249.127.135[/C][/ROW]
[/TABLE]
Source: https://freestatistics.org/blog/index.php?pk=68774&T=0

Globally Unique Identifier (entire table): ba.freestatistics.org/blog/index.php?pk=68774&T=0

As an alternative you can also use a QR Code:  

The GUIDs for individual cells are displayed in the table below:

Summary of computational transaction
Raw Inputview raw input (R code)
Raw Outputview raw output of R engine
Computing time1 seconds
R Server'Gwilym Jenkins' @ 72.249.127.135


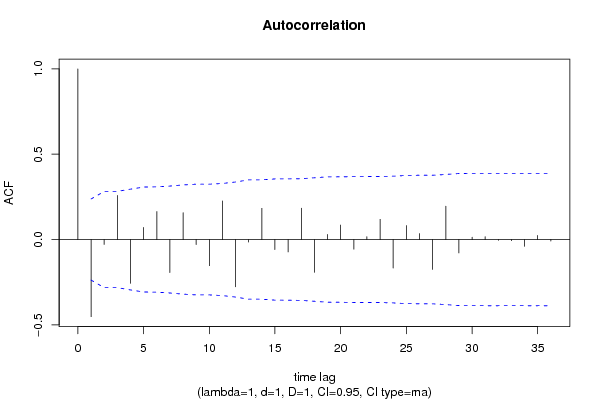
Autocorrelation Function
Time lag kACF(k)T-STATP-value
1-0.452102-3.72810.000198
2-0.029027-0.23940.405773
30.2587932.13410.018223
4-0.256732-2.11710.018957
50.0705670.58190.281276
60.1642311.35430.090064
7-0.193343-1.59430.057748
80.157631.29980.099021
9-0.029429-0.24270.404494
10-0.153065-1.26220.105593
110.2262981.86610.03317
12-0.277303-2.28670.012666
13-0.014775-0.12180.451693
140.1828081.50750.068161
15-0.058573-0.4830.315323
16-0.07262-0.59880.275634
170.1835141.51330.06742
18-0.192114-1.58420.058892
190.0298190.24590.403254
200.0845370.69710.244056
21-0.056475-0.46570.321457
220.0167650.13830.445226
230.118880.98030.165204
24-0.167055-1.37760.086426
250.0816270.67310.251579
260.0352960.29110.385948
27-0.175072-1.44370.07671
280.1951771.60950.056074
29-0.078904-0.65070.25873
300.0137320.11320.455089
310.0163490.13480.446577
32-0.00491-0.04050.483912
33-0.006636-0.05470.47826
34-0.039747-0.32780.372049
350.0242230.19970.421136
36-0.00895-0.07380.470692

\begin{tabular}{lllllllll}
\hline
Autocorrelation Function \tabularnewline
Time lag k & ACF(k) & T-STAT & P-value \tabularnewline
1 & -0.452102 & -3.7281 & 0.000198 \tabularnewline
2 & -0.029027 & -0.2394 & 0.405773 \tabularnewline
3 & 0.258793 & 2.1341 & 0.018223 \tabularnewline
4 & -0.256732 & -2.1171 & 0.018957 \tabularnewline
5 & 0.070567 & 0.5819 & 0.281276 \tabularnewline
6 & 0.164231 & 1.3543 & 0.090064 \tabularnewline
7 & -0.193343 & -1.5943 & 0.057748 \tabularnewline
8 & 0.15763 & 1.2998 & 0.099021 \tabularnewline
9 & -0.029429 & -0.2427 & 0.404494 \tabularnewline
10 & -0.153065 & -1.2622 & 0.105593 \tabularnewline
11 & 0.226298 & 1.8661 & 0.03317 \tabularnewline
12 & -0.277303 & -2.2867 & 0.012666 \tabularnewline
13 & -0.014775 & -0.1218 & 0.451693 \tabularnewline
14 & 0.182808 & 1.5075 & 0.068161 \tabularnewline
15 & -0.058573 & -0.483 & 0.315323 \tabularnewline
16 & -0.07262 & -0.5988 & 0.275634 \tabularnewline
17 & 0.183514 & 1.5133 & 0.06742 \tabularnewline
18 & -0.192114 & -1.5842 & 0.058892 \tabularnewline
19 & 0.029819 & 0.2459 & 0.403254 \tabularnewline
20 & 0.084537 & 0.6971 & 0.244056 \tabularnewline
21 & -0.056475 & -0.4657 & 0.321457 \tabularnewline
22 & 0.016765 & 0.1383 & 0.445226 \tabularnewline
23 & 0.11888 & 0.9803 & 0.165204 \tabularnewline
24 & -0.167055 & -1.3776 & 0.086426 \tabularnewline
25 & 0.081627 & 0.6731 & 0.251579 \tabularnewline
26 & 0.035296 & 0.2911 & 0.385948 \tabularnewline
27 & -0.175072 & -1.4437 & 0.07671 \tabularnewline
28 & 0.195177 & 1.6095 & 0.056074 \tabularnewline
29 & -0.078904 & -0.6507 & 0.25873 \tabularnewline
30 & 0.013732 & 0.1132 & 0.455089 \tabularnewline
31 & 0.016349 & 0.1348 & 0.446577 \tabularnewline
32 & -0.00491 & -0.0405 & 0.483912 \tabularnewline
33 & -0.006636 & -0.0547 & 0.47826 \tabularnewline
34 & -0.039747 & -0.3278 & 0.372049 \tabularnewline
35 & 0.024223 & 0.1997 & 0.421136 \tabularnewline
36 & -0.00895 & -0.0738 & 0.470692 \tabularnewline
\hline
\end{tabular}
%Source: https://freestatistics.org/blog/index.php?pk=68774&T=1

[TABLE]
[ROW][C]Autocorrelation Function[/C][/ROW]
[ROW][C]Time lag k[/C][C]ACF(k)[/C][C]T-STAT[/C][C]P-value[/C][/ROW]
[ROW][C]1[/C][C]-0.452102[/C][C]-3.7281[/C][C]0.000198[/C][/ROW]
[ROW][C]2[/C][C]-0.029027[/C][C]-0.2394[/C][C]0.405773[/C][/ROW]
[ROW][C]3[/C][C]0.258793[/C][C]2.1341[/C][C]0.018223[/C][/ROW]
[ROW][C]4[/C][C]-0.256732[/C][C]-2.1171[/C][C]0.018957[/C][/ROW]
[ROW][C]5[/C][C]0.070567[/C][C]0.5819[/C][C]0.281276[/C][/ROW]
[ROW][C]6[/C][C]0.164231[/C][C]1.3543[/C][C]0.090064[/C][/ROW]
[ROW][C]7[/C][C]-0.193343[/C][C]-1.5943[/C][C]0.057748[/C][/ROW]
[ROW][C]8[/C][C]0.15763[/C][C]1.2998[/C][C]0.099021[/C][/ROW]
[ROW][C]9[/C][C]-0.029429[/C][C]-0.2427[/C][C]0.404494[/C][/ROW]
[ROW][C]10[/C][C]-0.153065[/C][C]-1.2622[/C][C]0.105593[/C][/ROW]
[ROW][C]11[/C][C]0.226298[/C][C]1.8661[/C][C]0.03317[/C][/ROW]
[ROW][C]12[/C][C]-0.277303[/C][C]-2.2867[/C][C]0.012666[/C][/ROW]
[ROW][C]13[/C][C]-0.014775[/C][C]-0.1218[/C][C]0.451693[/C][/ROW]
[ROW][C]14[/C][C]0.182808[/C][C]1.5075[/C][C]0.068161[/C][/ROW]
[ROW][C]15[/C][C]-0.058573[/C][C]-0.483[/C][C]0.315323[/C][/ROW]
[ROW][C]16[/C][C]-0.07262[/C][C]-0.5988[/C][C]0.275634[/C][/ROW]
[ROW][C]17[/C][C]0.183514[/C][C]1.5133[/C][C]0.06742[/C][/ROW]
[ROW][C]18[/C][C]-0.192114[/C][C]-1.5842[/C][C]0.058892[/C][/ROW]
[ROW][C]19[/C][C]0.029819[/C][C]0.2459[/C][C]0.403254[/C][/ROW]
[ROW][C]20[/C][C]0.084537[/C][C]0.6971[/C][C]0.244056[/C][/ROW]
[ROW][C]21[/C][C]-0.056475[/C][C]-0.4657[/C][C]0.321457[/C][/ROW]
[ROW][C]22[/C][C]0.016765[/C][C]0.1383[/C][C]0.445226[/C][/ROW]
[ROW][C]23[/C][C]0.11888[/C][C]0.9803[/C][C]0.165204[/C][/ROW]
[ROW][C]24[/C][C]-0.167055[/C][C]-1.3776[/C][C]0.086426[/C][/ROW]
[ROW][C]25[/C][C]0.081627[/C][C]0.6731[/C][C]0.251579[/C][/ROW]
[ROW][C]26[/C][C]0.035296[/C][C]0.2911[/C][C]0.385948[/C][/ROW]
[ROW][C]27[/C][C]-0.175072[/C][C]-1.4437[/C][C]0.07671[/C][/ROW]
[ROW][C]28[/C][C]0.195177[/C][C]1.6095[/C][C]0.056074[/C][/ROW]
[ROW][C]29[/C][C]-0.078904[/C][C]-0.6507[/C][C]0.25873[/C][/ROW]
[ROW][C]30[/C][C]0.013732[/C][C]0.1132[/C][C]0.455089[/C][/ROW]
[ROW][C]31[/C][C]0.016349[/C][C]0.1348[/C][C]0.446577[/C][/ROW]
[ROW][C]32[/C][C]-0.00491[/C][C]-0.0405[/C][C]0.483912[/C][/ROW]
[ROW][C]33[/C][C]-0.006636[/C][C]-0.0547[/C][C]0.47826[/C][/ROW]
[ROW][C]34[/C][C]-0.039747[/C][C]-0.3278[/C][C]0.372049[/C][/ROW]
[ROW][C]35[/C][C]0.024223[/C][C]0.1997[/C][C]0.421136[/C][/ROW]
[ROW][C]36[/C][C]-0.00895[/C][C]-0.0738[/C][C]0.470692[/C][/ROW]
[/TABLE]
Source: https://freestatistics.org/blog/index.php?pk=68774&T=1

Globally Unique Identifier (entire table): ba.freestatistics.org/blog/index.php?pk=68774&T=1

As an alternative you can also use a QR Code:  

The GUIDs for individual cells are displayed in the table below:

Autocorrelation Function
Time lag kACF(k)T-STATP-value
1-0.452102-3.72810.000198
2-0.029027-0.23940.405773
30.2587932.13410.018223
4-0.256732-2.11710.018957
50.0705670.58190.281276
60.1642311.35430.090064
7-0.193343-1.59430.057748
80.157631.29980.099021
9-0.029429-0.24270.404494
10-0.153065-1.26220.105593
110.2262981.86610.03317
12-0.277303-2.28670.012666
13-0.014775-0.12180.451693
140.1828081.50750.068161
15-0.058573-0.4830.315323
16-0.07262-0.59880.275634
170.1835141.51330.06742
18-0.192114-1.58420.058892
190.0298190.24590.403254
200.0845370.69710.244056
21-0.056475-0.46570.321457
220.0167650.13830.445226
230.118880.98030.165204
24-0.167055-1.37760.086426
250.0816270.67310.251579
260.0352960.29110.385948
27-0.175072-1.44370.07671
280.1951771.60950.056074
29-0.078904-0.65070.25873
300.0137320.11320.455089
310.0163490.13480.446577
32-0.00491-0.04050.483912
33-0.006636-0.05470.47826
34-0.039747-0.32780.372049
350.0242230.19970.421136
36-0.00895-0.07380.470692


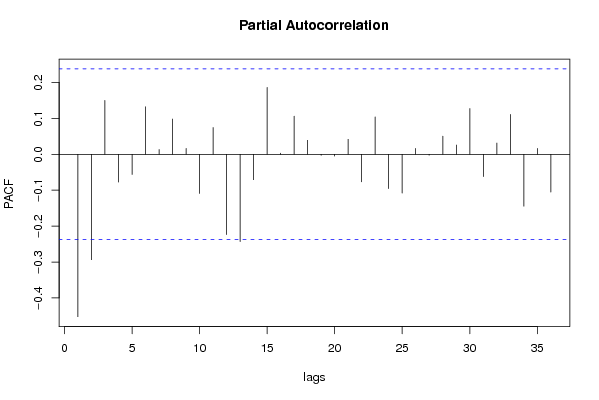
Partial Autocorrelation Function
Time lag kPACF(k)T-STATP-value
1-0.452102-3.72810.000198
2-0.293391-2.41940.009114
30.150151.23820.109955
4-0.07723-0.63690.263178
5-0.056228-0.46370.322184
60.1323761.09160.139431
70.0132730.10950.456584
80.0981860.80970.21048
90.0163910.13520.446442
10-0.10917-0.90020.185586
110.0743530.61310.270918
12-0.223628-1.84410.034764
13-0.242874-2.00280.024594
14-0.070835-0.58410.280537
150.1861261.53480.064733
160.0029660.02450.49028
170.1062160.87590.192089
180.0389390.32110.37456
19-0.00298-0.02460.490235
20-0.005054-0.04170.48344
210.0416070.34310.366289
22-0.076571-0.63140.264942
230.1040320.85790.19699
24-0.095573-0.78810.216684
25-0.107857-0.88940.188458
260.0164180.13540.446354
27-0.002407-0.01980.492113
280.0504870.41630.339241
290.0257490.21230.416241
300.1272491.04930.148872
31-0.062149-0.51250.304983
320.0313150.25820.398504
330.1109070.91460.181826
34-0.144523-1.19180.118748
350.0163890.13510.446449
36-0.105046-0.86620.194706

\begin{tabular}{lllllllll}
\hline
Partial Autocorrelation Function \tabularnewline
Time lag k & PACF(k) & T-STAT & P-value \tabularnewline
1 & -0.452102 & -3.7281 & 0.000198 \tabularnewline
2 & -0.293391 & -2.4194 & 0.009114 \tabularnewline
3 & 0.15015 & 1.2382 & 0.109955 \tabularnewline
4 & -0.07723 & -0.6369 & 0.263178 \tabularnewline
5 & -0.056228 & -0.4637 & 0.322184 \tabularnewline
6 & 0.132376 & 1.0916 & 0.139431 \tabularnewline
7 & 0.013273 & 0.1095 & 0.456584 \tabularnewline
8 & 0.098186 & 0.8097 & 0.21048 \tabularnewline
9 & 0.016391 & 0.1352 & 0.446442 \tabularnewline
10 & -0.10917 & -0.9002 & 0.185586 \tabularnewline
11 & 0.074353 & 0.6131 & 0.270918 \tabularnewline
12 & -0.223628 & -1.8441 & 0.034764 \tabularnewline
13 & -0.242874 & -2.0028 & 0.024594 \tabularnewline
14 & -0.070835 & -0.5841 & 0.280537 \tabularnewline
15 & 0.186126 & 1.5348 & 0.064733 \tabularnewline
16 & 0.002966 & 0.0245 & 0.49028 \tabularnewline
17 & 0.106216 & 0.8759 & 0.192089 \tabularnewline
18 & 0.038939 & 0.3211 & 0.37456 \tabularnewline
19 & -0.00298 & -0.0246 & 0.490235 \tabularnewline
20 & -0.005054 & -0.0417 & 0.48344 \tabularnewline
21 & 0.041607 & 0.3431 & 0.366289 \tabularnewline
22 & -0.076571 & -0.6314 & 0.264942 \tabularnewline
23 & 0.104032 & 0.8579 & 0.19699 \tabularnewline
24 & -0.095573 & -0.7881 & 0.216684 \tabularnewline
25 & -0.107857 & -0.8894 & 0.188458 \tabularnewline
26 & 0.016418 & 0.1354 & 0.446354 \tabularnewline
27 & -0.002407 & -0.0198 & 0.492113 \tabularnewline
28 & 0.050487 & 0.4163 & 0.339241 \tabularnewline
29 & 0.025749 & 0.2123 & 0.416241 \tabularnewline
30 & 0.127249 & 1.0493 & 0.148872 \tabularnewline
31 & -0.062149 & -0.5125 & 0.304983 \tabularnewline
32 & 0.031315 & 0.2582 & 0.398504 \tabularnewline
33 & 0.110907 & 0.9146 & 0.181826 \tabularnewline
34 & -0.144523 & -1.1918 & 0.118748 \tabularnewline
35 & 0.016389 & 0.1351 & 0.446449 \tabularnewline
36 & -0.105046 & -0.8662 & 0.194706 \tabularnewline
\hline
\end{tabular}
%Source: https://freestatistics.org/blog/index.php?pk=68774&T=2

[TABLE]
[ROW][C]Partial Autocorrelation Function[/C][/ROW]
[ROW][C]Time lag k[/C][C]PACF(k)[/C][C]T-STAT[/C][C]P-value[/C][/ROW]
[ROW][C]1[/C][C]-0.452102[/C][C]-3.7281[/C][C]0.000198[/C][/ROW]
[ROW][C]2[/C][C]-0.293391[/C][C]-2.4194[/C][C]0.009114[/C][/ROW]
[ROW][C]3[/C][C]0.15015[/C][C]1.2382[/C][C]0.109955[/C][/ROW]
[ROW][C]4[/C][C]-0.07723[/C][C]-0.6369[/C][C]0.263178[/C][/ROW]
[ROW][C]5[/C][C]-0.056228[/C][C]-0.4637[/C][C]0.322184[/C][/ROW]
[ROW][C]6[/C][C]0.132376[/C][C]1.0916[/C][C]0.139431[/C][/ROW]
[ROW][C]7[/C][C]0.013273[/C][C]0.1095[/C][C]0.456584[/C][/ROW]
[ROW][C]8[/C][C]0.098186[/C][C]0.8097[/C][C]0.21048[/C][/ROW]
[ROW][C]9[/C][C]0.016391[/C][C]0.1352[/C][C]0.446442[/C][/ROW]
[ROW][C]10[/C][C]-0.10917[/C][C]-0.9002[/C][C]0.185586[/C][/ROW]
[ROW][C]11[/C][C]0.074353[/C][C]0.6131[/C][C]0.270918[/C][/ROW]
[ROW][C]12[/C][C]-0.223628[/C][C]-1.8441[/C][C]0.034764[/C][/ROW]
[ROW][C]13[/C][C]-0.242874[/C][C]-2.0028[/C][C]0.024594[/C][/ROW]
[ROW][C]14[/C][C]-0.070835[/C][C]-0.5841[/C][C]0.280537[/C][/ROW]
[ROW][C]15[/C][C]0.186126[/C][C]1.5348[/C][C]0.064733[/C][/ROW]
[ROW][C]16[/C][C]0.002966[/C][C]0.0245[/C][C]0.49028[/C][/ROW]
[ROW][C]17[/C][C]0.106216[/C][C]0.8759[/C][C]0.192089[/C][/ROW]
[ROW][C]18[/C][C]0.038939[/C][C]0.3211[/C][C]0.37456[/C][/ROW]
[ROW][C]19[/C][C]-0.00298[/C][C]-0.0246[/C][C]0.490235[/C][/ROW]
[ROW][C]20[/C][C]-0.005054[/C][C]-0.0417[/C][C]0.48344[/C][/ROW]
[ROW][C]21[/C][C]0.041607[/C][C]0.3431[/C][C]0.366289[/C][/ROW]
[ROW][C]22[/C][C]-0.076571[/C][C]-0.6314[/C][C]0.264942[/C][/ROW]
[ROW][C]23[/C][C]0.104032[/C][C]0.8579[/C][C]0.19699[/C][/ROW]
[ROW][C]24[/C][C]-0.095573[/C][C]-0.7881[/C][C]0.216684[/C][/ROW]
[ROW][C]25[/C][C]-0.107857[/C][C]-0.8894[/C][C]0.188458[/C][/ROW]
[ROW][C]26[/C][C]0.016418[/C][C]0.1354[/C][C]0.446354[/C][/ROW]
[ROW][C]27[/C][C]-0.002407[/C][C]-0.0198[/C][C]0.492113[/C][/ROW]
[ROW][C]28[/C][C]0.050487[/C][C]0.4163[/C][C]0.339241[/C][/ROW]
[ROW][C]29[/C][C]0.025749[/C][C]0.2123[/C][C]0.416241[/C][/ROW]
[ROW][C]30[/C][C]0.127249[/C][C]1.0493[/C][C]0.148872[/C][/ROW]
[ROW][C]31[/C][C]-0.062149[/C][C]-0.5125[/C][C]0.304983[/C][/ROW]
[ROW][C]32[/C][C]0.031315[/C][C]0.2582[/C][C]0.398504[/C][/ROW]
[ROW][C]33[/C][C]0.110907[/C][C]0.9146[/C][C]0.181826[/C][/ROW]
[ROW][C]34[/C][C]-0.144523[/C][C]-1.1918[/C][C]0.118748[/C][/ROW]
[ROW][C]35[/C][C]0.016389[/C][C]0.1351[/C][C]0.446449[/C][/ROW]
[ROW][C]36[/C][C]-0.105046[/C][C]-0.8662[/C][C]0.194706[/C][/ROW]
[/TABLE]
Source: https://freestatistics.org/blog/index.php?pk=68774&T=2

Globally Unique Identifier (entire table): ba.freestatistics.org/blog/index.php?pk=68774&T=2

As an alternative you can also use a QR Code:  

The GUIDs for individual cells are displayed in the table below:

Partial Autocorrelation Function
Time lag kPACF(k)T-STATP-value
1-0.452102-3.72810.000198
2-0.293391-2.41940.009114
30.150151.23820.109955
4-0.07723-0.63690.263178
5-0.056228-0.46370.322184
60.1323761.09160.139431
70.0132730.10950.456584
80.0981860.80970.21048
90.0163910.13520.446442
10-0.10917-0.90020.185586
110.0743530.61310.270918
12-0.223628-1.84410.034764
13-0.242874-2.00280.024594
14-0.070835-0.58410.280537
150.1861261.53480.064733
160.0029660.02450.49028
170.1062160.87590.192089
180.0389390.32110.37456
19-0.00298-0.02460.490235
20-0.005054-0.04170.48344
210.0416070.34310.366289
22-0.076571-0.63140.264942
230.1040320.85790.19699
24-0.095573-0.78810.216684
25-0.107857-0.88940.188458
260.0164180.13540.446354
27-0.002407-0.01980.492113
280.0504870.41630.339241
290.0257490.21230.416241
300.1272491.04930.148872
31-0.062149-0.51250.304983
320.0313150.25820.398504
330.1109070.91460.181826
34-0.144523-1.19180.118748
350.0163890.13510.446449
36-0.105046-0.86620.194706


Parameters (Session):
par1 = 36 ; par2 = 1 ; par3 = 1 ; par4 = 1 ; par5 = 12 ; par6 = MA ; par7 = 0.95 ;
Parameters (R input):
par1 = 36 ; par2 = 1 ; par3 = 1 ; par4 = 1 ; par5 = 12 ; par6 = MA ; par7 = 0.95 ;
R code (references can be found in the software module):
if (par1 == 'Default') {
par1 = 10*log10(length(x))
} else {
par1 <- as.numeric(par1)
}
par2 <- as.numeric(par2)
par3 <- as.numeric(par3)
par4 <- as.numeric(par4)
par5 <- as.numeric(par5)
if (par6 == 'White Noise') par6 <- 'white' else par6 <- 'ma'
par7 <- as.numeric(par7)
if (par2 == 0) {
x <- log(x)
} else {
x <- (x ^ par2 - 1) / par2
}
if (par3 > 0) x <- diff(x,lag=1,difference=par3)
if (par4 > 0) x <- diff(x,lag=par5,difference=par4)
bitmap(file='pic1.png')
racf <- acf(x, par1, main='Autocorrelation', xlab='time lag', ylab='ACF', ci.type=par6, ci=par7, sub=paste('(lambda=',par2,', d=',par3,', D=',par4,', CI=', par7, ', CI type=',par6,')',sep=''))
dev.off()
bitmap(file='pic2.png')
rpacf <- pacf(x,par1,main='Partial Autocorrelation',xlab='lags',ylab='PACF')
dev.off()
(myacf <- c(racf$acf))
(mypacf <- c(rpacf$acf))
lengthx <- length(x)
sqrtn <- sqrt(lengthx)
load(file='createtable')
a<-table.start()
a<-table.row.start(a)
a<-table.element(a,'Autocorrelation Function',4,TRUE)
a<-table.row.end(a)
a<-table.row.start(a)
a<-table.element(a,'Time lag k',header=TRUE)
a<-table.element(a,hyperlink('basics.htm','ACF(k)','click here for more information about the Autocorrelation Function'),header=TRUE)
a<-table.element(a,'T-STAT',header=TRUE)
a<-table.element(a,'P-value',header=TRUE)
a<-table.row.end(a)
for (i in 2:(par1+1)) {
a<-table.row.start(a)
a<-table.element(a,i-1,header=TRUE)
a<-table.element(a,round(myacf[i],6))
mytstat <- myacf[i]*sqrtn
a<-table.element(a,round(mytstat,4))
a<-table.element(a,round(1-pt(abs(mytstat),lengthx),6))
a<-table.row.end(a)
}
a<-table.end(a)
table.save(a,file='mytable.tab')
a<-table.start()
a<-table.row.start(a)
a<-table.element(a,'Partial Autocorrelation Function',4,TRUE)
a<-table.row.end(a)
a<-table.row.start(a)
a<-table.element(a,'Time lag k',header=TRUE)
a<-table.element(a,hyperlink('basics.htm','PACF(k)','click here for more information about the Partial Autocorrelation Function'),header=TRUE)
a<-table.element(a,'T-STAT',header=TRUE)
a<-table.element(a,'P-value',header=TRUE)
a<-table.row.end(a)
for (i in 1:par1) {
a<-table.row.start(a)
a<-table.element(a,i,header=TRUE)
a<-table.element(a,round(mypacf[i],6))
mytstat <- mypacf[i]*sqrtn
a<-table.element(a,round(mytstat,4))
a<-table.element(a,round(1-pt(abs(mytstat),lengthx),6))
a<-table.row.end(a)
}
a<-table.end(a)
table.save(a,file='mytable1.tab')