Free Statistics

of Irreproducible Research!

Author's title

Author*The author of this computation has been verified*
R Software Modulerwasp_autocorrelation.wasp
Title produced by software(Partial) Autocorrelation Function
Date of computationThu, 17 Dec 2009 06:49:47 -0700
Cite this page as followsStatistical Computations at FreeStatistics.org, Office for Research Development and Education, URL https://freestatistics.org/blog/index.php?v=date/2009/Dec/17/t1261057844eioh1g7ce9dn4lj.htm/, Retrieved Tue, 30 Apr 2024 03:54:19 +0000
Statistical Computations at FreeStatistics.org, Office for Research Development and Education, URL https://freestatistics.org/blog/index.php?pk=68890, Retrieved Tue, 30 Apr 2024 03:54:19 +0000
QR Codes:

Original text written by user:
IsPrivate?No (this computation is public)
User-defined keywords
Estimated Impact97
Family? (F = Feedback message, R = changed R code, M = changed R Module, P = changed Parameters, D = changed Data)
-       [(Partial) Autocorrelation Function] [] [2009-12-17 13:49:47] [71596e6a53ccce532e52aaf6113616ef] [Current]
Feedback Forum

Post a new message
Dataseries X:
65,4
72,2
80,4
77,7
76,5
100,1
73,5
77,3
98,6
112,4
77,3
139,3
75,4
64,2
86,8
79,1
71,7
100
82,1
74,8
92,3
83,3
83,7
148
71,4
71,2
84,6
80,9
80,6
105,5
79,2
78,4
92,6
88,3
98,2
157,4
73,9
80,9
93
84,9
96,2
106,5
81,7
82,9
96
92,6
116,5
155
95,1
86,2
105
89,7
97,1
120,8
92,2
98,8
104,1
106,5
113,4
192,4
103,6
97,6
99,9
106,4
104,8
114,1
93
90,2
108,8
108,7
125,2
180,4
91,6
87,1
98,3


Summary of computational transaction
Raw Inputview raw input (R code)
Raw Outputview raw output of R engine
Computing time1 seconds
R Server'Gwilym Jenkins' @ 72.249.127.135

\begin{tabular}{lllllllll}
\hline
Summary of computational transaction \tabularnewline
Raw Input & view raw input (R code)  \tabularnewline
Raw Output & view raw output of R engine  \tabularnewline
Computing time & 1 seconds \tabularnewline
R Server & 'Gwilym Jenkins' @ 72.249.127.135 \tabularnewline
\hline
\end{tabular}
%Source: https://freestatistics.org/blog/index.php?pk=68890&T=0

[TABLE]
[ROW][C]Summary of computational transaction[/C][/ROW]
[ROW][C]Raw Input[/C][C]view raw input (R code) [/C][/ROW]
[ROW][C]Raw Output[/C][C]view raw output of R engine [/C][/ROW]
[ROW][C]Computing time[/C][C]1 seconds[/C][/ROW]
[ROW][C]R Server[/C][C]'Gwilym Jenkins' @ 72.249.127.135[/C][/ROW]
[/TABLE]
Source: https://freestatistics.org/blog/index.php?pk=68890&T=0

Globally Unique Identifier (entire table): ba.freestatistics.org/blog/index.php?pk=68890&T=0

As an alternative you can also use a QR Code:  

The GUIDs for individual cells are displayed in the table below:

Summary of computational transaction
Raw Inputview raw input (R code)
Raw Outputview raw output of R engine
Computing time1 seconds
R Server'Gwilym Jenkins' @ 72.249.127.135


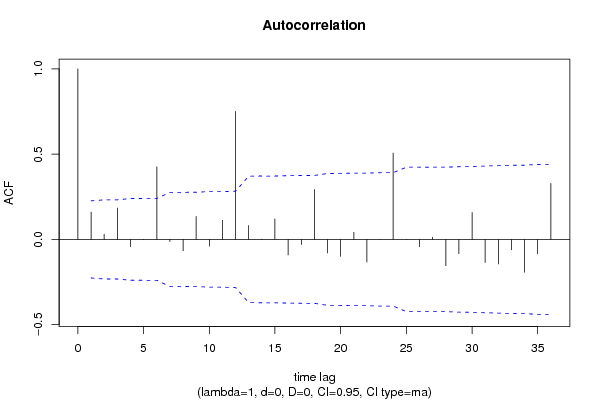
Autocorrelation Function
Time lag kACF(k)T-STATP-value
10.1607241.39190.084032
20.0305080.26420.396174
30.1838531.59220.057772
4-0.043719-0.37860.353021
52.4e-052e-040.499916
60.4261083.69020.000211
7-0.012622-0.10930.456626
8-0.066685-0.57750.282662
90.1345421.16520.123821
10-0.040019-0.34660.364941
110.1122840.97240.166987
120.7504266.49890
130.0810240.70170.242523
140.0010480.00910.496392
150.1203161.0420.150386
16-0.091473-0.79220.215376
17-0.030401-0.26330.396529
180.2932112.53930.00659
19-0.079092-0.6850.247741
20-0.100004-0.86610.19461
210.0417150.36130.359459
22-0.132836-1.15040.126818
23-0.000329-0.00280.498868
240.5066224.38751.8e-05
250.000720.00620.497522
26-0.043254-0.37460.354511
270.0122030.10570.458058
28-0.154039-1.3340.093117
29-0.084821-0.73460.232445
300.1575051.3640.088319
31-0.134988-1.1690.123047
32-0.14378-1.24520.108472
33-0.061375-0.53150.298312
34-0.192531-1.66740.049806
35-0.084233-0.72950.233991
360.328322.84330.002875

\begin{tabular}{lllllllll}
\hline
Autocorrelation Function \tabularnewline
Time lag k & ACF(k) & T-STAT & P-value \tabularnewline
1 & 0.160724 & 1.3919 & 0.084032 \tabularnewline
2 & 0.030508 & 0.2642 & 0.396174 \tabularnewline
3 & 0.183853 & 1.5922 & 0.057772 \tabularnewline
4 & -0.043719 & -0.3786 & 0.353021 \tabularnewline
5 & 2.4e-05 & 2e-04 & 0.499916 \tabularnewline
6 & 0.426108 & 3.6902 & 0.000211 \tabularnewline
7 & -0.012622 & -0.1093 & 0.456626 \tabularnewline
8 & -0.066685 & -0.5775 & 0.282662 \tabularnewline
9 & 0.134542 & 1.1652 & 0.123821 \tabularnewline
10 & -0.040019 & -0.3466 & 0.364941 \tabularnewline
11 & 0.112284 & 0.9724 & 0.166987 \tabularnewline
12 & 0.750426 & 6.4989 & 0 \tabularnewline
13 & 0.081024 & 0.7017 & 0.242523 \tabularnewline
14 & 0.001048 & 0.0091 & 0.496392 \tabularnewline
15 & 0.120316 & 1.042 & 0.150386 \tabularnewline
16 & -0.091473 & -0.7922 & 0.215376 \tabularnewline
17 & -0.030401 & -0.2633 & 0.396529 \tabularnewline
18 & 0.293211 & 2.5393 & 0.00659 \tabularnewline
19 & -0.079092 & -0.685 & 0.247741 \tabularnewline
20 & -0.100004 & -0.8661 & 0.19461 \tabularnewline
21 & 0.041715 & 0.3613 & 0.359459 \tabularnewline
22 & -0.132836 & -1.1504 & 0.126818 \tabularnewline
23 & -0.000329 & -0.0028 & 0.498868 \tabularnewline
24 & 0.506622 & 4.3875 & 1.8e-05 \tabularnewline
25 & 0.00072 & 0.0062 & 0.497522 \tabularnewline
26 & -0.043254 & -0.3746 & 0.354511 \tabularnewline
27 & 0.012203 & 0.1057 & 0.458058 \tabularnewline
28 & -0.154039 & -1.334 & 0.093117 \tabularnewline
29 & -0.084821 & -0.7346 & 0.232445 \tabularnewline
30 & 0.157505 & 1.364 & 0.088319 \tabularnewline
31 & -0.134988 & -1.169 & 0.123047 \tabularnewline
32 & -0.14378 & -1.2452 & 0.108472 \tabularnewline
33 & -0.061375 & -0.5315 & 0.298312 \tabularnewline
34 & -0.192531 & -1.6674 & 0.049806 \tabularnewline
35 & -0.084233 & -0.7295 & 0.233991 \tabularnewline
36 & 0.32832 & 2.8433 & 0.002875 \tabularnewline
\hline
\end{tabular}
%Source: https://freestatistics.org/blog/index.php?pk=68890&T=1

[TABLE]
[ROW][C]Autocorrelation Function[/C][/ROW]
[ROW][C]Time lag k[/C][C]ACF(k)[/C][C]T-STAT[/C][C]P-value[/C][/ROW]
[ROW][C]1[/C][C]0.160724[/C][C]1.3919[/C][C]0.084032[/C][/ROW]
[ROW][C]2[/C][C]0.030508[/C][C]0.2642[/C][C]0.396174[/C][/ROW]
[ROW][C]3[/C][C]0.183853[/C][C]1.5922[/C][C]0.057772[/C][/ROW]
[ROW][C]4[/C][C]-0.043719[/C][C]-0.3786[/C][C]0.353021[/C][/ROW]
[ROW][C]5[/C][C]2.4e-05[/C][C]2e-04[/C][C]0.499916[/C][/ROW]
[ROW][C]6[/C][C]0.426108[/C][C]3.6902[/C][C]0.000211[/C][/ROW]
[ROW][C]7[/C][C]-0.012622[/C][C]-0.1093[/C][C]0.456626[/C][/ROW]
[ROW][C]8[/C][C]-0.066685[/C][C]-0.5775[/C][C]0.282662[/C][/ROW]
[ROW][C]9[/C][C]0.134542[/C][C]1.1652[/C][C]0.123821[/C][/ROW]
[ROW][C]10[/C][C]-0.040019[/C][C]-0.3466[/C][C]0.364941[/C][/ROW]
[ROW][C]11[/C][C]0.112284[/C][C]0.9724[/C][C]0.166987[/C][/ROW]
[ROW][C]12[/C][C]0.750426[/C][C]6.4989[/C][C]0[/C][/ROW]
[ROW][C]13[/C][C]0.081024[/C][C]0.7017[/C][C]0.242523[/C][/ROW]
[ROW][C]14[/C][C]0.001048[/C][C]0.0091[/C][C]0.496392[/C][/ROW]
[ROW][C]15[/C][C]0.120316[/C][C]1.042[/C][C]0.150386[/C][/ROW]
[ROW][C]16[/C][C]-0.091473[/C][C]-0.7922[/C][C]0.215376[/C][/ROW]
[ROW][C]17[/C][C]-0.030401[/C][C]-0.2633[/C][C]0.396529[/C][/ROW]
[ROW][C]18[/C][C]0.293211[/C][C]2.5393[/C][C]0.00659[/C][/ROW]
[ROW][C]19[/C][C]-0.079092[/C][C]-0.685[/C][C]0.247741[/C][/ROW]
[ROW][C]20[/C][C]-0.100004[/C][C]-0.8661[/C][C]0.19461[/C][/ROW]
[ROW][C]21[/C][C]0.041715[/C][C]0.3613[/C][C]0.359459[/C][/ROW]
[ROW][C]22[/C][C]-0.132836[/C][C]-1.1504[/C][C]0.126818[/C][/ROW]
[ROW][C]23[/C][C]-0.000329[/C][C]-0.0028[/C][C]0.498868[/C][/ROW]
[ROW][C]24[/C][C]0.506622[/C][C]4.3875[/C][C]1.8e-05[/C][/ROW]
[ROW][C]25[/C][C]0.00072[/C][C]0.0062[/C][C]0.497522[/C][/ROW]
[ROW][C]26[/C][C]-0.043254[/C][C]-0.3746[/C][C]0.354511[/C][/ROW]
[ROW][C]27[/C][C]0.012203[/C][C]0.1057[/C][C]0.458058[/C][/ROW]
[ROW][C]28[/C][C]-0.154039[/C][C]-1.334[/C][C]0.093117[/C][/ROW]
[ROW][C]29[/C][C]-0.084821[/C][C]-0.7346[/C][C]0.232445[/C][/ROW]
[ROW][C]30[/C][C]0.157505[/C][C]1.364[/C][C]0.088319[/C][/ROW]
[ROW][C]31[/C][C]-0.134988[/C][C]-1.169[/C][C]0.123047[/C][/ROW]
[ROW][C]32[/C][C]-0.14378[/C][C]-1.2452[/C][C]0.108472[/C][/ROW]
[ROW][C]33[/C][C]-0.061375[/C][C]-0.5315[/C][C]0.298312[/C][/ROW]
[ROW][C]34[/C][C]-0.192531[/C][C]-1.6674[/C][C]0.049806[/C][/ROW]
[ROW][C]35[/C][C]-0.084233[/C][C]-0.7295[/C][C]0.233991[/C][/ROW]
[ROW][C]36[/C][C]0.32832[/C][C]2.8433[/C][C]0.002875[/C][/ROW]
[/TABLE]
Source: https://freestatistics.org/blog/index.php?pk=68890&T=1

Globally Unique Identifier (entire table): ba.freestatistics.org/blog/index.php?pk=68890&T=1

As an alternative you can also use a QR Code:  

The GUIDs for individual cells are displayed in the table below:

Autocorrelation Function
Time lag kACF(k)T-STATP-value
10.1607241.39190.084032
20.0305080.26420.396174
30.1838531.59220.057772
4-0.043719-0.37860.353021
52.4e-052e-040.499916
60.4261083.69020.000211
7-0.012622-0.10930.456626
8-0.066685-0.57750.282662
90.1345421.16520.123821
10-0.040019-0.34660.364941
110.1122840.97240.166987
120.7504266.49890
130.0810240.70170.242523
140.0010480.00910.496392
150.1203161.0420.150386
16-0.091473-0.79220.215376
17-0.030401-0.26330.396529
180.2932112.53930.00659
19-0.079092-0.6850.247741
20-0.100004-0.86610.19461
210.0417150.36130.359459
22-0.132836-1.15040.126818
23-0.000329-0.00280.498868
240.5066224.38751.8e-05
250.000720.00620.497522
26-0.043254-0.37460.354511
270.0122030.10570.458058
28-0.154039-1.3340.093117
29-0.084821-0.73460.232445
300.1575051.3640.088319
31-0.134988-1.1690.123047
32-0.14378-1.24520.108472
33-0.061375-0.53150.298312
34-0.192531-1.66740.049806
35-0.084233-0.72950.233991
360.328322.84330.002875


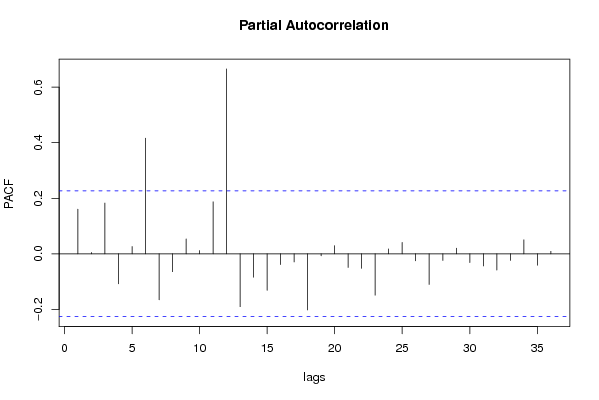
Partial Autocorrelation Function
Time lag kPACF(k)T-STATP-value
10.1607241.39190.084032
20.0047990.04160.483479
30.1829311.58420.058674
4-0.10793-0.93470.176472
50.0258620.2240.411693
60.4162053.60440.00028
7-0.165763-1.43560.077644
8-0.064276-0.55660.289713
90.0536410.46450.321801
100.0115960.10040.460139
110.1871421.62070.05464
120.665645.76460
13-0.190366-1.64860.051704
14-0.083996-0.72740.234614
15-0.131325-1.13730.129515
16-0.038912-0.3370.368532
17-0.029121-0.25220.400792
18-0.202194-1.75110.042013
19-0.007317-0.06340.474822
200.0291490.25240.400695
21-0.049031-0.42460.336163
22-0.052299-0.45290.325957
23-0.148861-1.28920.10065
240.0176710.1530.439392
250.0409580.35470.361903
26-0.025122-0.21760.414179
27-0.110229-0.95460.171421
28-0.023673-0.2050.419057
290.0203950.17660.430139
30-0.031491-0.27270.392909
31-0.043898-0.38020.352448
32-0.058731-0.50860.306253
33-0.023675-0.2050.419052
340.0504430.43680.331738
35-0.040932-0.35450.361987
360.0090420.07830.468896

\begin{tabular}{lllllllll}
\hline
Partial Autocorrelation Function \tabularnewline
Time lag k & PACF(k) & T-STAT & P-value \tabularnewline
1 & 0.160724 & 1.3919 & 0.084032 \tabularnewline
2 & 0.004799 & 0.0416 & 0.483479 \tabularnewline
3 & 0.182931 & 1.5842 & 0.058674 \tabularnewline
4 & -0.10793 & -0.9347 & 0.176472 \tabularnewline
5 & 0.025862 & 0.224 & 0.411693 \tabularnewline
6 & 0.416205 & 3.6044 & 0.00028 \tabularnewline
7 & -0.165763 & -1.4356 & 0.077644 \tabularnewline
8 & -0.064276 & -0.5566 & 0.289713 \tabularnewline
9 & 0.053641 & 0.4645 & 0.321801 \tabularnewline
10 & 0.011596 & 0.1004 & 0.460139 \tabularnewline
11 & 0.187142 & 1.6207 & 0.05464 \tabularnewline
12 & 0.66564 & 5.7646 & 0 \tabularnewline
13 & -0.190366 & -1.6486 & 0.051704 \tabularnewline
14 & -0.083996 & -0.7274 & 0.234614 \tabularnewline
15 & -0.131325 & -1.1373 & 0.129515 \tabularnewline
16 & -0.038912 & -0.337 & 0.368532 \tabularnewline
17 & -0.029121 & -0.2522 & 0.400792 \tabularnewline
18 & -0.202194 & -1.7511 & 0.042013 \tabularnewline
19 & -0.007317 & -0.0634 & 0.474822 \tabularnewline
20 & 0.029149 & 0.2524 & 0.400695 \tabularnewline
21 & -0.049031 & -0.4246 & 0.336163 \tabularnewline
22 & -0.052299 & -0.4529 & 0.325957 \tabularnewline
23 & -0.148861 & -1.2892 & 0.10065 \tabularnewline
24 & 0.017671 & 0.153 & 0.439392 \tabularnewline
25 & 0.040958 & 0.3547 & 0.361903 \tabularnewline
26 & -0.025122 & -0.2176 & 0.414179 \tabularnewline
27 & -0.110229 & -0.9546 & 0.171421 \tabularnewline
28 & -0.023673 & -0.205 & 0.419057 \tabularnewline
29 & 0.020395 & 0.1766 & 0.430139 \tabularnewline
30 & -0.031491 & -0.2727 & 0.392909 \tabularnewline
31 & -0.043898 & -0.3802 & 0.352448 \tabularnewline
32 & -0.058731 & -0.5086 & 0.306253 \tabularnewline
33 & -0.023675 & -0.205 & 0.419052 \tabularnewline
34 & 0.050443 & 0.4368 & 0.331738 \tabularnewline
35 & -0.040932 & -0.3545 & 0.361987 \tabularnewline
36 & 0.009042 & 0.0783 & 0.468896 \tabularnewline
\hline
\end{tabular}
%Source: https://freestatistics.org/blog/index.php?pk=68890&T=2

[TABLE]
[ROW][C]Partial Autocorrelation Function[/C][/ROW]
[ROW][C]Time lag k[/C][C]PACF(k)[/C][C]T-STAT[/C][C]P-value[/C][/ROW]
[ROW][C]1[/C][C]0.160724[/C][C]1.3919[/C][C]0.084032[/C][/ROW]
[ROW][C]2[/C][C]0.004799[/C][C]0.0416[/C][C]0.483479[/C][/ROW]
[ROW][C]3[/C][C]0.182931[/C][C]1.5842[/C][C]0.058674[/C][/ROW]
[ROW][C]4[/C][C]-0.10793[/C][C]-0.9347[/C][C]0.176472[/C][/ROW]
[ROW][C]5[/C][C]0.025862[/C][C]0.224[/C][C]0.411693[/C][/ROW]
[ROW][C]6[/C][C]0.416205[/C][C]3.6044[/C][C]0.00028[/C][/ROW]
[ROW][C]7[/C][C]-0.165763[/C][C]-1.4356[/C][C]0.077644[/C][/ROW]
[ROW][C]8[/C][C]-0.064276[/C][C]-0.5566[/C][C]0.289713[/C][/ROW]
[ROW][C]9[/C][C]0.053641[/C][C]0.4645[/C][C]0.321801[/C][/ROW]
[ROW][C]10[/C][C]0.011596[/C][C]0.1004[/C][C]0.460139[/C][/ROW]
[ROW][C]11[/C][C]0.187142[/C][C]1.6207[/C][C]0.05464[/C][/ROW]
[ROW][C]12[/C][C]0.66564[/C][C]5.7646[/C][C]0[/C][/ROW]
[ROW][C]13[/C][C]-0.190366[/C][C]-1.6486[/C][C]0.051704[/C][/ROW]
[ROW][C]14[/C][C]-0.083996[/C][C]-0.7274[/C][C]0.234614[/C][/ROW]
[ROW][C]15[/C][C]-0.131325[/C][C]-1.1373[/C][C]0.129515[/C][/ROW]
[ROW][C]16[/C][C]-0.038912[/C][C]-0.337[/C][C]0.368532[/C][/ROW]
[ROW][C]17[/C][C]-0.029121[/C][C]-0.2522[/C][C]0.400792[/C][/ROW]
[ROW][C]18[/C][C]-0.202194[/C][C]-1.7511[/C][C]0.042013[/C][/ROW]
[ROW][C]19[/C][C]-0.007317[/C][C]-0.0634[/C][C]0.474822[/C][/ROW]
[ROW][C]20[/C][C]0.029149[/C][C]0.2524[/C][C]0.400695[/C][/ROW]
[ROW][C]21[/C][C]-0.049031[/C][C]-0.4246[/C][C]0.336163[/C][/ROW]
[ROW][C]22[/C][C]-0.052299[/C][C]-0.4529[/C][C]0.325957[/C][/ROW]
[ROW][C]23[/C][C]-0.148861[/C][C]-1.2892[/C][C]0.10065[/C][/ROW]
[ROW][C]24[/C][C]0.017671[/C][C]0.153[/C][C]0.439392[/C][/ROW]
[ROW][C]25[/C][C]0.040958[/C][C]0.3547[/C][C]0.361903[/C][/ROW]
[ROW][C]26[/C][C]-0.025122[/C][C]-0.2176[/C][C]0.414179[/C][/ROW]
[ROW][C]27[/C][C]-0.110229[/C][C]-0.9546[/C][C]0.171421[/C][/ROW]
[ROW][C]28[/C][C]-0.023673[/C][C]-0.205[/C][C]0.419057[/C][/ROW]
[ROW][C]29[/C][C]0.020395[/C][C]0.1766[/C][C]0.430139[/C][/ROW]
[ROW][C]30[/C][C]-0.031491[/C][C]-0.2727[/C][C]0.392909[/C][/ROW]
[ROW][C]31[/C][C]-0.043898[/C][C]-0.3802[/C][C]0.352448[/C][/ROW]
[ROW][C]32[/C][C]-0.058731[/C][C]-0.5086[/C][C]0.306253[/C][/ROW]
[ROW][C]33[/C][C]-0.023675[/C][C]-0.205[/C][C]0.419052[/C][/ROW]
[ROW][C]34[/C][C]0.050443[/C][C]0.4368[/C][C]0.331738[/C][/ROW]
[ROW][C]35[/C][C]-0.040932[/C][C]-0.3545[/C][C]0.361987[/C][/ROW]
[ROW][C]36[/C][C]0.009042[/C][C]0.0783[/C][C]0.468896[/C][/ROW]
[/TABLE]
Source: https://freestatistics.org/blog/index.php?pk=68890&T=2

Globally Unique Identifier (entire table): ba.freestatistics.org/blog/index.php?pk=68890&T=2

As an alternative you can also use a QR Code:  

The GUIDs for individual cells are displayed in the table below:

Partial Autocorrelation Function
Time lag kPACF(k)T-STATP-value
10.1607241.39190.084032
20.0047990.04160.483479
30.1829311.58420.058674
4-0.10793-0.93470.176472
50.0258620.2240.411693
60.4162053.60440.00028
7-0.165763-1.43560.077644
8-0.064276-0.55660.289713
90.0536410.46450.321801
100.0115960.10040.460139
110.1871421.62070.05464
120.665645.76460
13-0.190366-1.64860.051704
14-0.083996-0.72740.234614
15-0.131325-1.13730.129515
16-0.038912-0.3370.368532
17-0.029121-0.25220.400792
18-0.202194-1.75110.042013
19-0.007317-0.06340.474822
200.0291490.25240.400695
21-0.049031-0.42460.336163
22-0.052299-0.45290.325957
23-0.148861-1.28920.10065
240.0176710.1530.439392
250.0409580.35470.361903
26-0.025122-0.21760.414179
27-0.110229-0.95460.171421
28-0.023673-0.2050.419057
290.0203950.17660.430139
30-0.031491-0.27270.392909
31-0.043898-0.38020.352448
32-0.058731-0.50860.306253
33-0.023675-0.2050.419052
340.0504430.43680.331738
35-0.040932-0.35450.361987
360.0090420.07830.468896


Parameters (Session):
par1 = 36 ; par2 = 1 ; par3 = 0 ; par4 = 0 ; par5 = 12 ; par6 = MA ; par7 = 0.95 ;
Parameters (R input):
par1 = 36 ; par2 = 1 ; par3 = 0 ; par4 = 0 ; par5 = 12 ; par6 = MA ; par7 = 0.95 ;
R code (references can be found in the software module):
if (par1 == 'Default') {
par1 = 10*log10(length(x))
} else {
par1 <- as.numeric(par1)
}
par2 <- as.numeric(par2)
par3 <- as.numeric(par3)
par4 <- as.numeric(par4)
par5 <- as.numeric(par5)
if (par6 == 'White Noise') par6 <- 'white' else par6 <- 'ma'
par7 <- as.numeric(par7)
if (par2 == 0) {
x <- log(x)
} else {
x <- (x ^ par2 - 1) / par2
}
if (par3 > 0) x <- diff(x,lag=1,difference=par3)
if (par4 > 0) x <- diff(x,lag=par5,difference=par4)
bitmap(file='pic1.png')
racf <- acf(x, par1, main='Autocorrelation', xlab='time lag', ylab='ACF', ci.type=par6, ci=par7, sub=paste('(lambda=',par2,', d=',par3,', D=',par4,', CI=', par7, ', CI type=',par6,')',sep=''))
dev.off()
bitmap(file='pic2.png')
rpacf <- pacf(x,par1,main='Partial Autocorrelation',xlab='lags',ylab='PACF')
dev.off()
(myacf <- c(racf$acf))
(mypacf <- c(rpacf$acf))
lengthx <- length(x)
sqrtn <- sqrt(lengthx)
load(file='createtable')
a<-table.start()
a<-table.row.start(a)
a<-table.element(a,'Autocorrelation Function',4,TRUE)
a<-table.row.end(a)
a<-table.row.start(a)
a<-table.element(a,'Time lag k',header=TRUE)
a<-table.element(a,hyperlink('basics.htm','ACF(k)','click here for more information about the Autocorrelation Function'),header=TRUE)
a<-table.element(a,'T-STAT',header=TRUE)
a<-table.element(a,'P-value',header=TRUE)
a<-table.row.end(a)
for (i in 2:(par1+1)) {
a<-table.row.start(a)
a<-table.element(a,i-1,header=TRUE)
a<-table.element(a,round(myacf[i],6))
mytstat <- myacf[i]*sqrtn
a<-table.element(a,round(mytstat,4))
a<-table.element(a,round(1-pt(abs(mytstat),lengthx),6))
a<-table.row.end(a)
}
a<-table.end(a)
table.save(a,file='mytable.tab')
a<-table.start()
a<-table.row.start(a)
a<-table.element(a,'Partial Autocorrelation Function',4,TRUE)
a<-table.row.end(a)
a<-table.row.start(a)
a<-table.element(a,'Time lag k',header=TRUE)
a<-table.element(a,hyperlink('basics.htm','PACF(k)','click here for more information about the Partial Autocorrelation Function'),header=TRUE)
a<-table.element(a,'T-STAT',header=TRUE)
a<-table.element(a,'P-value',header=TRUE)
a<-table.row.end(a)
for (i in 1:par1) {
a<-table.row.start(a)
a<-table.element(a,i,header=TRUE)
a<-table.element(a,round(mypacf[i],6))
mytstat <- mypacf[i]*sqrtn
a<-table.element(a,round(mytstat,4))
a<-table.element(a,round(1-pt(abs(mytstat),lengthx),6))
a<-table.row.end(a)
}
a<-table.end(a)
table.save(a,file='mytable1.tab')