Free Statistics
of Irreproducible Research!
Description of Statistical Computation | |||||||||||||||||||||||||||||||||||||||||
|---|---|---|---|---|---|---|---|---|---|---|---|---|---|---|---|---|---|---|---|---|---|---|---|---|---|---|---|---|---|---|---|---|---|---|---|---|---|---|---|---|---|
| Author's title | |||||||||||||||||||||||||||||||||||||||||
| Author | *The author of this computation has been verified* | ||||||||||||||||||||||||||||||||||||||||
| R Software Module | rwasp_univariatedataseries.wasp | ||||||||||||||||||||||||||||||||||||||||
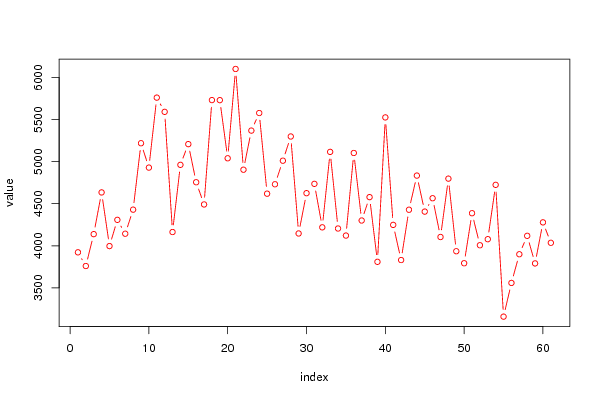
| Title produced by software | Univariate Data Series | ||||||||||||||||||||||||||||||||||||||||
| Date of computation | Thu, 17 Dec 2009 07:48:04 -0700 | ||||||||||||||||||||||||||||||||||||||||
| Cite this page as follows | Statistical Computations at FreeStatistics.org, Office for Research Development and Education, URL https://freestatistics.org/blog/index.php?v=date/2009/Dec/17/t1261061348virohk1asp6qztj.htm/, Retrieved Tue, 30 Apr 2024 01:28:51 +0000 | ||||||||||||||||||||||||||||||||||||||||
| Statistical Computations at FreeStatistics.org, Office for Research Development and Education, URL https://freestatistics.org/blog/index.php?pk=68923, Retrieved Tue, 30 Apr 2024 01:28:51 +0000 | |||||||||||||||||||||||||||||||||||||||||
| QR Codes: | |||||||||||||||||||||||||||||||||||||||||
|
| |||||||||||||||||||||||||||||||||||||||||
| Original text written by user: | |||||||||||||||||||||||||||||||||||||||||
| IsPrivate? | No (this computation is public) | ||||||||||||||||||||||||||||||||||||||||
| User-defined keywords | |||||||||||||||||||||||||||||||||||||||||
| Estimated Impact | 117 | ||||||||||||||||||||||||||||||||||||||||
Tree of Dependent Computations | |||||||||||||||||||||||||||||||||||||||||
| Family? (F = Feedback message, R = changed R code, M = changed R Module, P = changed Parameters, D = changed Data) | |||||||||||||||||||||||||||||||||||||||||
| - [Notched Boxplots] [Notched Boxplots] [2009-12-12 13:06:15] [f84db15a18b564cd160ebc7b4eade151] - RMPD [Univariate Data Series] [Paper. Voorstelli...] [2009-12-17 13:51:20] [d31db4f83c6a129f6d3e47077769e868] - PD [Univariate Data Series] [Paper.Voorstellin...] [2009-12-17 14:33:11] [d31db4f83c6a129f6d3e47077769e868] - P [Univariate Data Series] [Paper. Voorstelli...] [2009-12-17 14:48:04] [852eae237d08746109043531619a60c9] [Current] | |||||||||||||||||||||||||||||||||||||||||
| Feedback Forum | |||||||||||||||||||||||||||||||||||||||||
Post a new message | |||||||||||||||||||||||||||||||||||||||||
Dataset | |||||||||||||||||||||||||||||||||||||||||
| Dataseries X: | |||||||||||||||||||||||||||||||||||||||||
3 922 3 759 4 138 4 634 3 996 4 308 4 143 4 429 5 219 4 929 5 761 5 592 4 163 4 962 5 208 4 755 4 491 5 732 5 731 5 040 6 102 4 904 5 369 5 578 4 619 4 731 5 011 5 299 4 146 4 625 4 736 4 219 5 116 4 205 4 121 5 103 4 300 4 578 3 809 5 526 4 248 3 830 4 428 4 834 4 406 4 565 4 104 4 798 3 935 3 792 4 387 4 006 4 078 4 724 3 157 3 558 3 899 4 118 3 790 4 278 4 035 | |||||||||||||||||||||||||||||||||||||||||
Tables (Output of Computation) | |||||||||||||||||||||||||||||||||||||||||
| |||||||||||||||||||||||||||||||||||||||||
Figures (Output of Computation) | |||||||||||||||||||||||||||||||||||||||||
Input Parameters & R Code | |||||||||||||||||||||||||||||||||||||||||
| Parameters (Session): | |||||||||||||||||||||||||||||||||||||||||
| par1 = Bouwvergunningen ; par2 = Belgostat ; par3 = Bouwvergunningen ; | |||||||||||||||||||||||||||||||||||||||||
| Parameters (R input): | |||||||||||||||||||||||||||||||||||||||||
| par1 = Bouwvergunningen ; par2 = Belgostat ; par3 = Bouwvergunningen ; | |||||||||||||||||||||||||||||||||||||||||
| R code (references can be found in the software module): | |||||||||||||||||||||||||||||||||||||||||
bitmap(file='test1.png') | |||||||||||||||||||||||||||||||||||||||||