Free Statistics

of Irreproducible Research!

Author's title

Author*The author of this computation has been verified*
R Software Modulerwasp_multipleregression.wasp
Title produced by softwareMultiple Regression
Date of computationThu, 17 Dec 2009 08:03:56 -0700
Cite this page as followsStatistical Computations at FreeStatistics.org, Office for Research Development and Education, URL https://freestatistics.org/blog/index.php?v=date/2009/Dec/17/t1261062280ykb5mif7pn7h3gy.htm/, Retrieved Tue, 30 Apr 2024 01:51:24 +0000
Statistical Computations at FreeStatistics.org, Office for Research Development and Education, URL https://freestatistics.org/blog/index.php?pk=68936, Retrieved Tue, 30 Apr 2024 01:51:24 +0000
QR Codes:

Original text written by user:
IsPrivate?No (this computation is public)
User-defined keywords
Estimated Impact90
Family? (F = Feedback message, R = changed R code, M = changed R Module, P = changed Parameters, D = changed Data)
-       [Multiple Regression] [] [2009-12-17 15:03:56] [71596e6a53ccce532e52aaf6113616ef] [Current]
Feedback Forum

Post a new message
Dataseries X:
97.4
97
105.4
102.7
98.1
104.5
87.4
89.9
109.8
111.7
98.6
96.9
95.1
97
112.7
102.9
97.4
111.4
87.4
96.8
114.1
110.3
103.9
101.6
94.6
95.9
104.7
102.8
98.1
113.9
80.9
95.7
113.2
105.9
108.8
102.3
99
100.7
115.5
100.7
109.9
114.6
85.4
100.5
114.8
116.5
112.9
102
106
105.3
118.8
106.1
109.3
117.2
92.5
104.2
112.5
122.4
113.3
100
110.7
112.8
109.8
117.3
109.1
115.9
96
99.8
116.8


Summary of computational transaction
Raw Inputview raw input (R code)
Raw Outputview raw output of R engine
Computing time3 seconds
R Server'Gwilym Jenkins' @ 72.249.127.135

\begin{tabular}{lllllllll}
\hline
Summary of computational transaction \tabularnewline
Raw Input & view raw input (R code)  \tabularnewline
Raw Output & view raw output of R engine  \tabularnewline
Computing time & 3 seconds \tabularnewline
R Server & 'Gwilym Jenkins' @ 72.249.127.135 \tabularnewline
\hline
\end{tabular}
%Source: https://freestatistics.org/blog/index.php?pk=68936&T=0

[TABLE]
[ROW][C]Summary of computational transaction[/C][/ROW]
[ROW][C]Raw Input[/C][C]view raw input (R code) [/C][/ROW]
[ROW][C]Raw Output[/C][C]view raw output of R engine [/C][/ROW]
[ROW][C]Computing time[/C][C]3 seconds[/C][/ROW]
[ROW][C]R Server[/C][C]'Gwilym Jenkins' @ 72.249.127.135[/C][/ROW]
[/TABLE]
Source: https://freestatistics.org/blog/index.php?pk=68936&T=0

Globally Unique Identifier (entire table): ba.freestatistics.org/blog/index.php?pk=68936&T=0

As an alternative you can also use a QR Code:  

The GUIDs for individual cells are displayed in the table below:

Summary of computational transaction
Raw Inputview raw input (R code)
Raw Outputview raw output of R engine
Computing time3 seconds
R Server'Gwilym Jenkins' @ 72.249.127.135


Multiple Linear Regression - Estimated Regression Equation
Industriële_Productie[t] = + 93.8576 + 0.837555555555539M1[t] + 1.63471111111111M2[t] + 11.1485333333333M3[t] + 5.22902222222222M4[t] + 3.27617777777778M5[t] + 12.3566666666667M6[t] -12.4795111111111M7[t] -3.11568888888888M8[t] + 12.4148M9[t] + 13.1723555555556M10[t] + 7.12617777777778M11[t] + 0.186177777777778t + e[t]

\begin{tabular}{lllllllll}
\hline
Multiple Linear Regression - Estimated Regression Equation \tabularnewline
Industriële_Productie[t] =  +  93.8576 +  0.837555555555539M1[t] +  1.63471111111111M2[t] +  11.1485333333333M3[t] +  5.22902222222222M4[t] +  3.27617777777778M5[t] +  12.3566666666667M6[t] -12.4795111111111M7[t] -3.11568888888888M8[t] +  12.4148M9[t] +  13.1723555555556M10[t] +  7.12617777777778M11[t] +  0.186177777777778t  + e[t] \tabularnewline
\hline
\end{tabular}
%Source: https://freestatistics.org/blog/index.php?pk=68936&T=1

[TABLE]
[ROW][C]Multiple Linear Regression - Estimated Regression Equation[/C][/ROW]
[ROW][C]Industriële_Productie[t] =  +  93.8576 +  0.837555555555539M1[t] +  1.63471111111111M2[t] +  11.1485333333333M3[t] +  5.22902222222222M4[t] +  3.27617777777778M5[t] +  12.3566666666667M6[t] -12.4795111111111M7[t] -3.11568888888888M8[t] +  12.4148M9[t] +  13.1723555555556M10[t] +  7.12617777777778M11[t] +  0.186177777777778t  + e[t][/C][/ROW]
[/TABLE]
Source: https://freestatistics.org/blog/index.php?pk=68936&T=1

Globally Unique Identifier (entire table): ba.freestatistics.org/blog/index.php?pk=68936&T=1

As an alternative you can also use a QR Code:  

The GUIDs for individual cells are displayed in the table below:

Multiple Linear Regression - Estimated Regression Equation
Industriële_Productie[t] = + 93.8576 + 0.837555555555539M1[t] + 1.63471111111111M2[t] + 11.1485333333333M3[t] + 5.22902222222222M4[t] + 3.27617777777778M5[t] + 12.3566666666667M6[t] -12.4795111111111M7[t] -3.11568888888888M8[t] + 12.4148M9[t] + 13.1723555555556M10[t] + 7.12617777777778M11[t] + 0.186177777777778t + e[t]


Multiple Linear Regression - Ordinary Least Squares
VariableParameterS.D.T-STATH0: parameter = 02-tail p-value1-tail p-value
(Intercept)93.85761.83533151.139300
M10.8375555555555392.2344570.37480.7091980.354599
M21.634711111111112.2334430.73190.4672670.233634
M311.14853333333332.2326554.99346e-063e-06
M45.229022222222222.2320922.34270.0227260.011363
M53.276177777777782.2317541.4680.1477030.073852
M612.35666666666672.2316415.5371e-060
M7-12.47951111111112.231754-5.59181e-060
M8-3.115688888888882.232092-1.39590.1682660.084133
M912.41482.2326555.56061e-060
M1013.17235555555562.3313045.65021e-060
M117.126177777777782.3309813.05720.0034220.001711
t0.1861777777777780.0224298.300800

\begin{tabular}{lllllllll}
\hline
Multiple Linear Regression - Ordinary Least Squares \tabularnewline
Variable & Parameter & S.D. & T-STATH0: parameter = 0 & 2-tail p-value & 1-tail p-value \tabularnewline
(Intercept) & 93.8576 & 1.835331 & 51.1393 & 0 & 0 \tabularnewline
M1 & 0.837555555555539 & 2.234457 & 0.3748 & 0.709198 & 0.354599 \tabularnewline
M2 & 1.63471111111111 & 2.233443 & 0.7319 & 0.467267 & 0.233634 \tabularnewline
M3 & 11.1485333333333 & 2.232655 & 4.9934 & 6e-06 & 3e-06 \tabularnewline
M4 & 5.22902222222222 & 2.232092 & 2.3427 & 0.022726 & 0.011363 \tabularnewline
M5 & 3.27617777777778 & 2.231754 & 1.468 & 0.147703 & 0.073852 \tabularnewline
M6 & 12.3566666666667 & 2.231641 & 5.537 & 1e-06 & 0 \tabularnewline
M7 & -12.4795111111111 & 2.231754 & -5.5918 & 1e-06 & 0 \tabularnewline
M8 & -3.11568888888888 & 2.232092 & -1.3959 & 0.168266 & 0.084133 \tabularnewline
M9 & 12.4148 & 2.232655 & 5.5606 & 1e-06 & 0 \tabularnewline
M10 & 13.1723555555556 & 2.331304 & 5.6502 & 1e-06 & 0 \tabularnewline
M11 & 7.12617777777778 & 2.330981 & 3.0572 & 0.003422 & 0.001711 \tabularnewline
t & 0.186177777777778 & 0.022429 & 8.3008 & 0 & 0 \tabularnewline
\hline
\end{tabular}
%Source: https://freestatistics.org/blog/index.php?pk=68936&T=2

[TABLE]
[ROW][C]Multiple Linear Regression - Ordinary Least Squares[/C][/ROW]
[ROW][C]Variable[/C][C]Parameter[/C][C]S.D.[/C][C]T-STATH0: parameter = 0[/C][C]2-tail p-value[/C][C]1-tail p-value[/C][/ROW]
[ROW][C](Intercept)[/C][C]93.8576[/C][C]1.835331[/C][C]51.1393[/C][C]0[/C][C]0[/C][/ROW]
[ROW][C]M1[/C][C]0.837555555555539[/C][C]2.234457[/C][C]0.3748[/C][C]0.709198[/C][C]0.354599[/C][/ROW]
[ROW][C]M2[/C][C]1.63471111111111[/C][C]2.233443[/C][C]0.7319[/C][C]0.467267[/C][C]0.233634[/C][/ROW]
[ROW][C]M3[/C][C]11.1485333333333[/C][C]2.232655[/C][C]4.9934[/C][C]6e-06[/C][C]3e-06[/C][/ROW]
[ROW][C]M4[/C][C]5.22902222222222[/C][C]2.232092[/C][C]2.3427[/C][C]0.022726[/C][C]0.011363[/C][/ROW]
[ROW][C]M5[/C][C]3.27617777777778[/C][C]2.231754[/C][C]1.468[/C][C]0.147703[/C][C]0.073852[/C][/ROW]
[ROW][C]M6[/C][C]12.3566666666667[/C][C]2.231641[/C][C]5.537[/C][C]1e-06[/C][C]0[/C][/ROW]
[ROW][C]M7[/C][C]-12.4795111111111[/C][C]2.231754[/C][C]-5.5918[/C][C]1e-06[/C][C]0[/C][/ROW]
[ROW][C]M8[/C][C]-3.11568888888888[/C][C]2.232092[/C][C]-1.3959[/C][C]0.168266[/C][C]0.084133[/C][/ROW]
[ROW][C]M9[/C][C]12.4148[/C][C]2.232655[/C][C]5.5606[/C][C]1e-06[/C][C]0[/C][/ROW]
[ROW][C]M10[/C][C]13.1723555555556[/C][C]2.331304[/C][C]5.6502[/C][C]1e-06[/C][C]0[/C][/ROW]
[ROW][C]M11[/C][C]7.12617777777778[/C][C]2.330981[/C][C]3.0572[/C][C]0.003422[/C][C]0.001711[/C][/ROW]
[ROW][C]t[/C][C]0.186177777777778[/C][C]0.022429[/C][C]8.3008[/C][C]0[/C][C]0[/C][/ROW]
[/TABLE]
Source: https://freestatistics.org/blog/index.php?pk=68936&T=2

Globally Unique Identifier (entire table): ba.freestatistics.org/blog/index.php?pk=68936&T=2

As an alternative you can also use a QR Code:  

The GUIDs for individual cells are displayed in the table below:

Multiple Linear Regression - Ordinary Least Squares
VariableParameterS.D.T-STATH0: parameter = 02-tail p-value1-tail p-value
(Intercept)93.85761.83533151.139300
M10.8375555555555392.2344570.37480.7091980.354599
M21.634711111111112.2334430.73190.4672670.233634
M311.14853333333332.2326554.99346e-063e-06
M45.229022222222222.2320922.34270.0227260.011363
M53.276177777777782.2317541.4680.1477030.073852
M612.35666666666672.2316415.5371e-060
M7-12.47951111111112.231754-5.59181e-060
M8-3.115688888888882.232092-1.39590.1682660.084133
M912.41482.2326555.56061e-060
M1013.17235555555562.3313045.65021e-060
M117.126177777777782.3309813.05720.0034220.001711
t0.1861777777777780.0224298.300800


Multiple Linear Regression - Regression Statistics
Multiple R0.926946080712693
R-squared0.859229036548622
Adjusted R-squared0.829063830094755
F-TEST (value)28.4841092621954
F-TEST (DF numerator)12
F-TEST (DF denominator)56
p-value0
Multiple Linear Regression - Residual Statistics
Residual Standard Deviation3.68543355335440
Sum Squared Residuals760.615546666666

\begin{tabular}{lllllllll}
\hline
Multiple Linear Regression - Regression Statistics \tabularnewline
Multiple R & 0.926946080712693 \tabularnewline
R-squared & 0.859229036548622 \tabularnewline
Adjusted R-squared & 0.829063830094755 \tabularnewline
F-TEST (value) & 28.4841092621954 \tabularnewline
F-TEST (DF numerator) & 12 \tabularnewline
F-TEST (DF denominator) & 56 \tabularnewline
p-value & 0 \tabularnewline
Multiple Linear Regression - Residual Statistics \tabularnewline
Residual Standard Deviation & 3.68543355335440 \tabularnewline
Sum Squared Residuals & 760.615546666666 \tabularnewline
\hline
\end{tabular}
%Source: https://freestatistics.org/blog/index.php?pk=68936&T=3

[TABLE]
[ROW][C]Multiple Linear Regression - Regression Statistics[/C][/ROW]
[ROW][C]Multiple R[/C][C]0.926946080712693[/C][/ROW]
[ROW][C]R-squared[/C][C]0.859229036548622[/C][/ROW]
[ROW][C]Adjusted R-squared[/C][C]0.829063830094755[/C][/ROW]
[ROW][C]F-TEST (value)[/C][C]28.4841092621954[/C][/ROW]
[ROW][C]F-TEST (DF numerator)[/C][C]12[/C][/ROW]
[ROW][C]F-TEST (DF denominator)[/C][C]56[/C][/ROW]
[ROW][C]p-value[/C][C]0[/C][/ROW]
[ROW][C]Multiple Linear Regression - Residual Statistics[/C][/ROW]
[ROW][C]Residual Standard Deviation[/C][C]3.68543355335440[/C][/ROW]
[ROW][C]Sum Squared Residuals[/C][C]760.615546666666[/C][/ROW]
[/TABLE]
Source: https://freestatistics.org/blog/index.php?pk=68936&T=3

Globally Unique Identifier (entire table): ba.freestatistics.org/blog/index.php?pk=68936&T=3

As an alternative you can also use a QR Code:  

The GUIDs for individual cells are displayed in the table below:

Multiple Linear Regression - Regression Statistics
Multiple R0.926946080712693
R-squared0.859229036548622
Adjusted R-squared0.829063830094755
F-TEST (value)28.4841092621954
F-TEST (DF numerator)12
F-TEST (DF denominator)56
p-value0
Multiple Linear Regression - Residual Statistics
Residual Standard Deviation3.68543355335440
Sum Squared Residuals760.615546666666


Multiple Linear Regression - Actuals, Interpolation, and Residuals
Time or IndexActualsInterpolationForecastResidualsPrediction Error
197.494.88133333333342.51866666666658
29795.86466666666671.13533333333334
3105.4105.564666666667-0.164666666666663
4102.799.83133333333342.86866666666665
598.198.06466666666670.0353333333333238
6104.5107.331333333333-2.83133333333333
787.482.68133333333334.71866666666669
889.992.2313333333333-2.33133333333333
9109.8107.9481.852
10111.7108.8917333333332.80826666666668
1198.6103.031733333333-4.43173333333333
1296.996.09173333333330.808266666666674
1395.197.1154666666666-2.01546666666665
149798.0988-1.09880000000000
15112.7107.79884.9012
16102.9102.0654666666670.834533333333344
1797.4100.2988-2.89879999999999
18111.4109.5654666666671.83453333333334
1987.484.91546666666672.48453333333333
2096.894.46546666666672.33453333333333
21114.1110.1821333333333.91786666666667
22110.3111.125866666667-0.825866666666677
23103.9105.265866666667-1.36586666666666
24101.698.32586666666673.27413333333333
2594.699.3496-4.74959999999998
2695.9100.332933333333-4.43293333333333
27104.7110.032933333333-5.33293333333333
28102.8104.2996-1.49960000000000
2998.1102.532933333333-4.43293333333334
30113.9111.79962.10040000000000
3180.987.1496-6.2496
3295.796.6996-0.999599999999998
33113.2112.4162666666670.78373333333334
34105.9113.36-7.46
35108.8107.51.30000000000000
36102.3100.561.74
3799101.583733333333-2.58373333333331
38100.7102.567066666667-1.86706666666666
39115.5112.2670666666673.23293333333333
40100.7106.533733333333-5.83373333333333
41109.9104.7670666666675.13293333333334
42114.6114.0337333333330.566266666666658
4385.489.3837333333333-3.98373333333334
44100.598.93373333333331.56626666666666
45114.8114.65040.149600000000000
46116.5115.5941333333330.905866666666657
47112.9109.7341333333333.16586666666667
48102102.794133333333-0.794133333333331
49106103.8178666666672.18213333333335
50105.3104.80120.498799999999996
51118.8114.50124.2988
52106.1108.767866666667-2.66786666666667
53109.3107.00122.29880000000000
54117.2116.2678666666670.932133333333332
5592.591.61786666666670.882133333333323
56104.2101.1678666666673.03213333333333
57112.5116.884533333333-4.38453333333333
58122.4117.8282666666674.57173333333333
59113.3111.9682666666671.33173333333333
60100105.028266666667-5.02826666666667
61110.7106.0524.64800000000002
62112.8107.0353333333335.76466666666666
63109.8116.735333333333-6.93533333333334
64117.3111.0026.298
65109.1109.235333333333-0.135333333333341
66115.9118.502-2.602
679693.8522.14799999999999
6899.8103.402-3.60200000000001
69116.8119.118666666667-2.31866666666667

\begin{tabular}{lllllllll}
\hline
Multiple Linear Regression - Actuals, Interpolation, and Residuals \tabularnewline
Time or Index & Actuals & InterpolationForecast & ResidualsPrediction Error \tabularnewline
1 & 97.4 & 94.8813333333334 & 2.51866666666658 \tabularnewline
2 & 97 & 95.8646666666667 & 1.13533333333334 \tabularnewline
3 & 105.4 & 105.564666666667 & -0.164666666666663 \tabularnewline
4 & 102.7 & 99.8313333333334 & 2.86866666666665 \tabularnewline
5 & 98.1 & 98.0646666666667 & 0.0353333333333238 \tabularnewline
6 & 104.5 & 107.331333333333 & -2.83133333333333 \tabularnewline
7 & 87.4 & 82.6813333333333 & 4.71866666666669 \tabularnewline
8 & 89.9 & 92.2313333333333 & -2.33133333333333 \tabularnewline
9 & 109.8 & 107.948 & 1.852 \tabularnewline
10 & 111.7 & 108.891733333333 & 2.80826666666668 \tabularnewline
11 & 98.6 & 103.031733333333 & -4.43173333333333 \tabularnewline
12 & 96.9 & 96.0917333333333 & 0.808266666666674 \tabularnewline
13 & 95.1 & 97.1154666666666 & -2.01546666666665 \tabularnewline
14 & 97 & 98.0988 & -1.09880000000000 \tabularnewline
15 & 112.7 & 107.7988 & 4.9012 \tabularnewline
16 & 102.9 & 102.065466666667 & 0.834533333333344 \tabularnewline
17 & 97.4 & 100.2988 & -2.89879999999999 \tabularnewline
18 & 111.4 & 109.565466666667 & 1.83453333333334 \tabularnewline
19 & 87.4 & 84.9154666666667 & 2.48453333333333 \tabularnewline
20 & 96.8 & 94.4654666666667 & 2.33453333333333 \tabularnewline
21 & 114.1 & 110.182133333333 & 3.91786666666667 \tabularnewline
22 & 110.3 & 111.125866666667 & -0.825866666666677 \tabularnewline
23 & 103.9 & 105.265866666667 & -1.36586666666666 \tabularnewline
24 & 101.6 & 98.3258666666667 & 3.27413333333333 \tabularnewline
25 & 94.6 & 99.3496 & -4.74959999999998 \tabularnewline
26 & 95.9 & 100.332933333333 & -4.43293333333333 \tabularnewline
27 & 104.7 & 110.032933333333 & -5.33293333333333 \tabularnewline
28 & 102.8 & 104.2996 & -1.49960000000000 \tabularnewline
29 & 98.1 & 102.532933333333 & -4.43293333333334 \tabularnewline
30 & 113.9 & 111.7996 & 2.10040000000000 \tabularnewline
31 & 80.9 & 87.1496 & -6.2496 \tabularnewline
32 & 95.7 & 96.6996 & -0.999599999999998 \tabularnewline
33 & 113.2 & 112.416266666667 & 0.78373333333334 \tabularnewline
34 & 105.9 & 113.36 & -7.46 \tabularnewline
35 & 108.8 & 107.5 & 1.30000000000000 \tabularnewline
36 & 102.3 & 100.56 & 1.74 \tabularnewline
37 & 99 & 101.583733333333 & -2.58373333333331 \tabularnewline
38 & 100.7 & 102.567066666667 & -1.86706666666666 \tabularnewline
39 & 115.5 & 112.267066666667 & 3.23293333333333 \tabularnewline
40 & 100.7 & 106.533733333333 & -5.83373333333333 \tabularnewline
41 & 109.9 & 104.767066666667 & 5.13293333333334 \tabularnewline
42 & 114.6 & 114.033733333333 & 0.566266666666658 \tabularnewline
43 & 85.4 & 89.3837333333333 & -3.98373333333334 \tabularnewline
44 & 100.5 & 98.9337333333333 & 1.56626666666666 \tabularnewline
45 & 114.8 & 114.6504 & 0.149600000000000 \tabularnewline
46 & 116.5 & 115.594133333333 & 0.905866666666657 \tabularnewline
47 & 112.9 & 109.734133333333 & 3.16586666666667 \tabularnewline
48 & 102 & 102.794133333333 & -0.794133333333331 \tabularnewline
49 & 106 & 103.817866666667 & 2.18213333333335 \tabularnewline
50 & 105.3 & 104.8012 & 0.498799999999996 \tabularnewline
51 & 118.8 & 114.5012 & 4.2988 \tabularnewline
52 & 106.1 & 108.767866666667 & -2.66786666666667 \tabularnewline
53 & 109.3 & 107.0012 & 2.29880000000000 \tabularnewline
54 & 117.2 & 116.267866666667 & 0.932133333333332 \tabularnewline
55 & 92.5 & 91.6178666666667 & 0.882133333333323 \tabularnewline
56 & 104.2 & 101.167866666667 & 3.03213333333333 \tabularnewline
57 & 112.5 & 116.884533333333 & -4.38453333333333 \tabularnewline
58 & 122.4 & 117.828266666667 & 4.57173333333333 \tabularnewline
59 & 113.3 & 111.968266666667 & 1.33173333333333 \tabularnewline
60 & 100 & 105.028266666667 & -5.02826666666667 \tabularnewline
61 & 110.7 & 106.052 & 4.64800000000002 \tabularnewline
62 & 112.8 & 107.035333333333 & 5.76466666666666 \tabularnewline
63 & 109.8 & 116.735333333333 & -6.93533333333334 \tabularnewline
64 & 117.3 & 111.002 & 6.298 \tabularnewline
65 & 109.1 & 109.235333333333 & -0.135333333333341 \tabularnewline
66 & 115.9 & 118.502 & -2.602 \tabularnewline
67 & 96 & 93.852 & 2.14799999999999 \tabularnewline
68 & 99.8 & 103.402 & -3.60200000000001 \tabularnewline
69 & 116.8 & 119.118666666667 & -2.31866666666667 \tabularnewline
\hline
\end{tabular}
%Source: https://freestatistics.org/blog/index.php?pk=68936&T=4

[TABLE]
[ROW][C]Multiple Linear Regression - Actuals, Interpolation, and Residuals[/C][/ROW]
[ROW][C]Time or Index[/C][C]Actuals[/C][C]InterpolationForecast[/C][C]ResidualsPrediction Error[/C][/ROW]
[ROW][C]1[/C][C]97.4[/C][C]94.8813333333334[/C][C]2.51866666666658[/C][/ROW]
[ROW][C]2[/C][C]97[/C][C]95.8646666666667[/C][C]1.13533333333334[/C][/ROW]
[ROW][C]3[/C][C]105.4[/C][C]105.564666666667[/C][C]-0.164666666666663[/C][/ROW]
[ROW][C]4[/C][C]102.7[/C][C]99.8313333333334[/C][C]2.86866666666665[/C][/ROW]
[ROW][C]5[/C][C]98.1[/C][C]98.0646666666667[/C][C]0.0353333333333238[/C][/ROW]
[ROW][C]6[/C][C]104.5[/C][C]107.331333333333[/C][C]-2.83133333333333[/C][/ROW]
[ROW][C]7[/C][C]87.4[/C][C]82.6813333333333[/C][C]4.71866666666669[/C][/ROW]
[ROW][C]8[/C][C]89.9[/C][C]92.2313333333333[/C][C]-2.33133333333333[/C][/ROW]
[ROW][C]9[/C][C]109.8[/C][C]107.948[/C][C]1.852[/C][/ROW]
[ROW][C]10[/C][C]111.7[/C][C]108.891733333333[/C][C]2.80826666666668[/C][/ROW]
[ROW][C]11[/C][C]98.6[/C][C]103.031733333333[/C][C]-4.43173333333333[/C][/ROW]
[ROW][C]12[/C][C]96.9[/C][C]96.0917333333333[/C][C]0.808266666666674[/C][/ROW]
[ROW][C]13[/C][C]95.1[/C][C]97.1154666666666[/C][C]-2.01546666666665[/C][/ROW]
[ROW][C]14[/C][C]97[/C][C]98.0988[/C][C]-1.09880000000000[/C][/ROW]
[ROW][C]15[/C][C]112.7[/C][C]107.7988[/C][C]4.9012[/C][/ROW]
[ROW][C]16[/C][C]102.9[/C][C]102.065466666667[/C][C]0.834533333333344[/C][/ROW]
[ROW][C]17[/C][C]97.4[/C][C]100.2988[/C][C]-2.89879999999999[/C][/ROW]
[ROW][C]18[/C][C]111.4[/C][C]109.565466666667[/C][C]1.83453333333334[/C][/ROW]
[ROW][C]19[/C][C]87.4[/C][C]84.9154666666667[/C][C]2.48453333333333[/C][/ROW]
[ROW][C]20[/C][C]96.8[/C][C]94.4654666666667[/C][C]2.33453333333333[/C][/ROW]
[ROW][C]21[/C][C]114.1[/C][C]110.182133333333[/C][C]3.91786666666667[/C][/ROW]
[ROW][C]22[/C][C]110.3[/C][C]111.125866666667[/C][C]-0.825866666666677[/C][/ROW]
[ROW][C]23[/C][C]103.9[/C][C]105.265866666667[/C][C]-1.36586666666666[/C][/ROW]
[ROW][C]24[/C][C]101.6[/C][C]98.3258666666667[/C][C]3.27413333333333[/C][/ROW]
[ROW][C]25[/C][C]94.6[/C][C]99.3496[/C][C]-4.74959999999998[/C][/ROW]
[ROW][C]26[/C][C]95.9[/C][C]100.332933333333[/C][C]-4.43293333333333[/C][/ROW]
[ROW][C]27[/C][C]104.7[/C][C]110.032933333333[/C][C]-5.33293333333333[/C][/ROW]
[ROW][C]28[/C][C]102.8[/C][C]104.2996[/C][C]-1.49960000000000[/C][/ROW]
[ROW][C]29[/C][C]98.1[/C][C]102.532933333333[/C][C]-4.43293333333334[/C][/ROW]
[ROW][C]30[/C][C]113.9[/C][C]111.7996[/C][C]2.10040000000000[/C][/ROW]
[ROW][C]31[/C][C]80.9[/C][C]87.1496[/C][C]-6.2496[/C][/ROW]
[ROW][C]32[/C][C]95.7[/C][C]96.6996[/C][C]-0.999599999999998[/C][/ROW]
[ROW][C]33[/C][C]113.2[/C][C]112.416266666667[/C][C]0.78373333333334[/C][/ROW]
[ROW][C]34[/C][C]105.9[/C][C]113.36[/C][C]-7.46[/C][/ROW]
[ROW][C]35[/C][C]108.8[/C][C]107.5[/C][C]1.30000000000000[/C][/ROW]
[ROW][C]36[/C][C]102.3[/C][C]100.56[/C][C]1.74[/C][/ROW]
[ROW][C]37[/C][C]99[/C][C]101.583733333333[/C][C]-2.58373333333331[/C][/ROW]
[ROW][C]38[/C][C]100.7[/C][C]102.567066666667[/C][C]-1.86706666666666[/C][/ROW]
[ROW][C]39[/C][C]115.5[/C][C]112.267066666667[/C][C]3.23293333333333[/C][/ROW]
[ROW][C]40[/C][C]100.7[/C][C]106.533733333333[/C][C]-5.83373333333333[/C][/ROW]
[ROW][C]41[/C][C]109.9[/C][C]104.767066666667[/C][C]5.13293333333334[/C][/ROW]
[ROW][C]42[/C][C]114.6[/C][C]114.033733333333[/C][C]0.566266666666658[/C][/ROW]
[ROW][C]43[/C][C]85.4[/C][C]89.3837333333333[/C][C]-3.98373333333334[/C][/ROW]
[ROW][C]44[/C][C]100.5[/C][C]98.9337333333333[/C][C]1.56626666666666[/C][/ROW]
[ROW][C]45[/C][C]114.8[/C][C]114.6504[/C][C]0.149600000000000[/C][/ROW]
[ROW][C]46[/C][C]116.5[/C][C]115.594133333333[/C][C]0.905866666666657[/C][/ROW]
[ROW][C]47[/C][C]112.9[/C][C]109.734133333333[/C][C]3.16586666666667[/C][/ROW]
[ROW][C]48[/C][C]102[/C][C]102.794133333333[/C][C]-0.794133333333331[/C][/ROW]
[ROW][C]49[/C][C]106[/C][C]103.817866666667[/C][C]2.18213333333335[/C][/ROW]
[ROW][C]50[/C][C]105.3[/C][C]104.8012[/C][C]0.498799999999996[/C][/ROW]
[ROW][C]51[/C][C]118.8[/C][C]114.5012[/C][C]4.2988[/C][/ROW]
[ROW][C]52[/C][C]106.1[/C][C]108.767866666667[/C][C]-2.66786666666667[/C][/ROW]
[ROW][C]53[/C][C]109.3[/C][C]107.0012[/C][C]2.29880000000000[/C][/ROW]
[ROW][C]54[/C][C]117.2[/C][C]116.267866666667[/C][C]0.932133333333332[/C][/ROW]
[ROW][C]55[/C][C]92.5[/C][C]91.6178666666667[/C][C]0.882133333333323[/C][/ROW]
[ROW][C]56[/C][C]104.2[/C][C]101.167866666667[/C][C]3.03213333333333[/C][/ROW]
[ROW][C]57[/C][C]112.5[/C][C]116.884533333333[/C][C]-4.38453333333333[/C][/ROW]
[ROW][C]58[/C][C]122.4[/C][C]117.828266666667[/C][C]4.57173333333333[/C][/ROW]
[ROW][C]59[/C][C]113.3[/C][C]111.968266666667[/C][C]1.33173333333333[/C][/ROW]
[ROW][C]60[/C][C]100[/C][C]105.028266666667[/C][C]-5.02826666666667[/C][/ROW]
[ROW][C]61[/C][C]110.7[/C][C]106.052[/C][C]4.64800000000002[/C][/ROW]
[ROW][C]62[/C][C]112.8[/C][C]107.035333333333[/C][C]5.76466666666666[/C][/ROW]
[ROW][C]63[/C][C]109.8[/C][C]116.735333333333[/C][C]-6.93533333333334[/C][/ROW]
[ROW][C]64[/C][C]117.3[/C][C]111.002[/C][C]6.298[/C][/ROW]
[ROW][C]65[/C][C]109.1[/C][C]109.235333333333[/C][C]-0.135333333333341[/C][/ROW]
[ROW][C]66[/C][C]115.9[/C][C]118.502[/C][C]-2.602[/C][/ROW]
[ROW][C]67[/C][C]96[/C][C]93.852[/C][C]2.14799999999999[/C][/ROW]
[ROW][C]68[/C][C]99.8[/C][C]103.402[/C][C]-3.60200000000001[/C][/ROW]
[ROW][C]69[/C][C]116.8[/C][C]119.118666666667[/C][C]-2.31866666666667[/C][/ROW]
[/TABLE]
Source: https://freestatistics.org/blog/index.php?pk=68936&T=4

Globally Unique Identifier (entire table): ba.freestatistics.org/blog/index.php?pk=68936&T=4

As an alternative you can also use a QR Code:  

The GUIDs for individual cells are displayed in the table below:

Multiple Linear Regression - Actuals, Interpolation, and Residuals
Time or IndexActualsInterpolationForecastResidualsPrediction Error
197.494.88133333333342.51866666666658
29795.86466666666671.13533333333334
3105.4105.564666666667-0.164666666666663
4102.799.83133333333342.86866666666665
598.198.06466666666670.0353333333333238
6104.5107.331333333333-2.83133333333333
787.482.68133333333334.71866666666669
889.992.2313333333333-2.33133333333333
9109.8107.9481.852
10111.7108.8917333333332.80826666666668
1198.6103.031733333333-4.43173333333333
1296.996.09173333333330.808266666666674
1395.197.1154666666666-2.01546666666665
149798.0988-1.09880000000000
15112.7107.79884.9012
16102.9102.0654666666670.834533333333344
1797.4100.2988-2.89879999999999
18111.4109.5654666666671.83453333333334
1987.484.91546666666672.48453333333333
2096.894.46546666666672.33453333333333
21114.1110.1821333333333.91786666666667
22110.3111.125866666667-0.825866666666677
23103.9105.265866666667-1.36586666666666
24101.698.32586666666673.27413333333333
2594.699.3496-4.74959999999998
2695.9100.332933333333-4.43293333333333
27104.7110.032933333333-5.33293333333333
28102.8104.2996-1.49960000000000
2998.1102.532933333333-4.43293333333334
30113.9111.79962.10040000000000
3180.987.1496-6.2496
3295.796.6996-0.999599999999998
33113.2112.4162666666670.78373333333334
34105.9113.36-7.46
35108.8107.51.30000000000000
36102.3100.561.74
3799101.583733333333-2.58373333333331
38100.7102.567066666667-1.86706666666666
39115.5112.2670666666673.23293333333333
40100.7106.533733333333-5.83373333333333
41109.9104.7670666666675.13293333333334
42114.6114.0337333333330.566266666666658
4385.489.3837333333333-3.98373333333334
44100.598.93373333333331.56626666666666
45114.8114.65040.149600000000000
46116.5115.5941333333330.905866666666657
47112.9109.7341333333333.16586666666667
48102102.794133333333-0.794133333333331
49106103.8178666666672.18213333333335
50105.3104.80120.498799999999996
51118.8114.50124.2988
52106.1108.767866666667-2.66786666666667
53109.3107.00122.29880000000000
54117.2116.2678666666670.932133333333332
5592.591.61786666666670.882133333333323
56104.2101.1678666666673.03213333333333
57112.5116.884533333333-4.38453333333333
58122.4117.8282666666674.57173333333333
59113.3111.9682666666671.33173333333333
60100105.028266666667-5.02826666666667
61110.7106.0524.64800000000002
62112.8107.0353333333335.76466666666666
63109.8116.735333333333-6.93533333333334
64117.3111.0026.298
65109.1109.235333333333-0.135333333333341
66115.9118.502-2.602
679693.8522.14799999999999
6899.8103.402-3.60200000000001
69116.8119.118666666667-2.31866666666667


Goldfeld-Quandt test for Heteroskedasticity
p-valuesAlternative Hypothesis
breakpoint indexgreater2-sidedless
160.3586465197825590.7172930395651170.641353480217441
170.2232713246072790.4465426492145580.776728675392721
180.2535290978515060.5070581957030110.746470902148495
190.1740328554855920.3480657109711840.825967144514408
200.1792183046048890.3584366092097780.820781695395111
210.1402177904079520.2804355808159040.859782209592048
220.1144363884095650.2288727768191300.885563611590435
230.08420704774354070.1684140954870810.91579295225646
240.06752566727685160.1350513345537030.932474332723148
250.08806679334609090.1761335866921820.91193320665391
260.08207035390502780.1641407078100560.917929646094972
270.1231659419129150.2463318838258290.876834058087085
280.08265870705054850.1653174141010970.917341292949452
290.06608885848976630.1321777169795330.933911141510234
300.07196606454767140.1439321290953430.928033935452329
310.1441136318859100.2882272637718200.85588636811409
320.1026058215282270.2052116430564550.897394178471773
330.07617962791599420.1523592558319880.923820372084006
340.1614578827306530.3229157654613060.838542117269347
350.1900735330605760.3801470661211520.809926466939424
360.1698955584326040.3397911168652080.830104441567396
370.1636650806655510.3273301613311030.836334919334449
380.1563550349199520.3127100698399050.843644965080048
390.1836900287342750.3673800574685490.816309971265725
400.2835749409288420.5671498818576840.716425059071158
410.4095384653536410.8190769307072820.590461534646359
420.3301160814240720.6602321628481450.669883918575928
430.3717049358173690.7434098716347380.628295064182631
440.304125011723650.60825002344730.69587498827635
450.2393629124754510.4787258249509020.760637087524549
460.2207145861411890.4414291722823780.779285413858811
470.1858729206505230.3717458413010450.814127079349477
480.1428263869192900.2856527738385800.85717361308071
490.1163100857266590.2326201714533190.88368991427334
500.1194144236149030.2388288472298050.880585576385097
510.2964970566656370.5929941133312740.703502943334363
520.6938990660767270.6122018678465460.306100933923273
530.5322667388642830.9354665222714340.467733261135717

\begin{tabular}{lllllllll}
\hline
Goldfeld-Quandt test for Heteroskedasticity \tabularnewline
p-values & Alternative Hypothesis \tabularnewline
breakpoint index & greater & 2-sided & less \tabularnewline
16 & 0.358646519782559 & 0.717293039565117 & 0.641353480217441 \tabularnewline
17 & 0.223271324607279 & 0.446542649214558 & 0.776728675392721 \tabularnewline
18 & 0.253529097851506 & 0.507058195703011 & 0.746470902148495 \tabularnewline
19 & 0.174032855485592 & 0.348065710971184 & 0.825967144514408 \tabularnewline
20 & 0.179218304604889 & 0.358436609209778 & 0.820781695395111 \tabularnewline
21 & 0.140217790407952 & 0.280435580815904 & 0.859782209592048 \tabularnewline
22 & 0.114436388409565 & 0.228872776819130 & 0.885563611590435 \tabularnewline
23 & 0.0842070477435407 & 0.168414095487081 & 0.91579295225646 \tabularnewline
24 & 0.0675256672768516 & 0.135051334553703 & 0.932474332723148 \tabularnewline
25 & 0.0880667933460909 & 0.176133586692182 & 0.91193320665391 \tabularnewline
26 & 0.0820703539050278 & 0.164140707810056 & 0.917929646094972 \tabularnewline
27 & 0.123165941912915 & 0.246331883825829 & 0.876834058087085 \tabularnewline
28 & 0.0826587070505485 & 0.165317414101097 & 0.917341292949452 \tabularnewline
29 & 0.0660888584897663 & 0.132177716979533 & 0.933911141510234 \tabularnewline
30 & 0.0719660645476714 & 0.143932129095343 & 0.928033935452329 \tabularnewline
31 & 0.144113631885910 & 0.288227263771820 & 0.85588636811409 \tabularnewline
32 & 0.102605821528227 & 0.205211643056455 & 0.897394178471773 \tabularnewline
33 & 0.0761796279159942 & 0.152359255831988 & 0.923820372084006 \tabularnewline
34 & 0.161457882730653 & 0.322915765461306 & 0.838542117269347 \tabularnewline
35 & 0.190073533060576 & 0.380147066121152 & 0.809926466939424 \tabularnewline
36 & 0.169895558432604 & 0.339791116865208 & 0.830104441567396 \tabularnewline
37 & 0.163665080665551 & 0.327330161331103 & 0.836334919334449 \tabularnewline
38 & 0.156355034919952 & 0.312710069839905 & 0.843644965080048 \tabularnewline
39 & 0.183690028734275 & 0.367380057468549 & 0.816309971265725 \tabularnewline
40 & 0.283574940928842 & 0.567149881857684 & 0.716425059071158 \tabularnewline
41 & 0.409538465353641 & 0.819076930707282 & 0.590461534646359 \tabularnewline
42 & 0.330116081424072 & 0.660232162848145 & 0.669883918575928 \tabularnewline
43 & 0.371704935817369 & 0.743409871634738 & 0.628295064182631 \tabularnewline
44 & 0.30412501172365 & 0.6082500234473 & 0.69587498827635 \tabularnewline
45 & 0.239362912475451 & 0.478725824950902 & 0.760637087524549 \tabularnewline
46 & 0.220714586141189 & 0.441429172282378 & 0.779285413858811 \tabularnewline
47 & 0.185872920650523 & 0.371745841301045 & 0.814127079349477 \tabularnewline
48 & 0.142826386919290 & 0.285652773838580 & 0.85717361308071 \tabularnewline
49 & 0.116310085726659 & 0.232620171453319 & 0.88368991427334 \tabularnewline
50 & 0.119414423614903 & 0.238828847229805 & 0.880585576385097 \tabularnewline
51 & 0.296497056665637 & 0.592994113331274 & 0.703502943334363 \tabularnewline
52 & 0.693899066076727 & 0.612201867846546 & 0.306100933923273 \tabularnewline
53 & 0.532266738864283 & 0.935466522271434 & 0.467733261135717 \tabularnewline
\hline
\end{tabular}
%Source: https://freestatistics.org/blog/index.php?pk=68936&T=5

[TABLE]
[ROW][C]Goldfeld-Quandt test for Heteroskedasticity[/C][/ROW]
[ROW][C]p-values[/C][C]Alternative Hypothesis[/C][/ROW]
[ROW][C]breakpoint index[/C][C]greater[/C][C]2-sided[/C][C]less[/C][/ROW]
[ROW][C]16[/C][C]0.358646519782559[/C][C]0.717293039565117[/C][C]0.641353480217441[/C][/ROW]
[ROW][C]17[/C][C]0.223271324607279[/C][C]0.446542649214558[/C][C]0.776728675392721[/C][/ROW]
[ROW][C]18[/C][C]0.253529097851506[/C][C]0.507058195703011[/C][C]0.746470902148495[/C][/ROW]
[ROW][C]19[/C][C]0.174032855485592[/C][C]0.348065710971184[/C][C]0.825967144514408[/C][/ROW]
[ROW][C]20[/C][C]0.179218304604889[/C][C]0.358436609209778[/C][C]0.820781695395111[/C][/ROW]
[ROW][C]21[/C][C]0.140217790407952[/C][C]0.280435580815904[/C][C]0.859782209592048[/C][/ROW]
[ROW][C]22[/C][C]0.114436388409565[/C][C]0.228872776819130[/C][C]0.885563611590435[/C][/ROW]
[ROW][C]23[/C][C]0.0842070477435407[/C][C]0.168414095487081[/C][C]0.91579295225646[/C][/ROW]
[ROW][C]24[/C][C]0.0675256672768516[/C][C]0.135051334553703[/C][C]0.932474332723148[/C][/ROW]
[ROW][C]25[/C][C]0.0880667933460909[/C][C]0.176133586692182[/C][C]0.91193320665391[/C][/ROW]
[ROW][C]26[/C][C]0.0820703539050278[/C][C]0.164140707810056[/C][C]0.917929646094972[/C][/ROW]
[ROW][C]27[/C][C]0.123165941912915[/C][C]0.246331883825829[/C][C]0.876834058087085[/C][/ROW]
[ROW][C]28[/C][C]0.0826587070505485[/C][C]0.165317414101097[/C][C]0.917341292949452[/C][/ROW]
[ROW][C]29[/C][C]0.0660888584897663[/C][C]0.132177716979533[/C][C]0.933911141510234[/C][/ROW]
[ROW][C]30[/C][C]0.0719660645476714[/C][C]0.143932129095343[/C][C]0.928033935452329[/C][/ROW]
[ROW][C]31[/C][C]0.144113631885910[/C][C]0.288227263771820[/C][C]0.85588636811409[/C][/ROW]
[ROW][C]32[/C][C]0.102605821528227[/C][C]0.205211643056455[/C][C]0.897394178471773[/C][/ROW]
[ROW][C]33[/C][C]0.0761796279159942[/C][C]0.152359255831988[/C][C]0.923820372084006[/C][/ROW]
[ROW][C]34[/C][C]0.161457882730653[/C][C]0.322915765461306[/C][C]0.838542117269347[/C][/ROW]
[ROW][C]35[/C][C]0.190073533060576[/C][C]0.380147066121152[/C][C]0.809926466939424[/C][/ROW]
[ROW][C]36[/C][C]0.169895558432604[/C][C]0.339791116865208[/C][C]0.830104441567396[/C][/ROW]
[ROW][C]37[/C][C]0.163665080665551[/C][C]0.327330161331103[/C][C]0.836334919334449[/C][/ROW]
[ROW][C]38[/C][C]0.156355034919952[/C][C]0.312710069839905[/C][C]0.843644965080048[/C][/ROW]
[ROW][C]39[/C][C]0.183690028734275[/C][C]0.367380057468549[/C][C]0.816309971265725[/C][/ROW]
[ROW][C]40[/C][C]0.283574940928842[/C][C]0.567149881857684[/C][C]0.716425059071158[/C][/ROW]
[ROW][C]41[/C][C]0.409538465353641[/C][C]0.819076930707282[/C][C]0.590461534646359[/C][/ROW]
[ROW][C]42[/C][C]0.330116081424072[/C][C]0.660232162848145[/C][C]0.669883918575928[/C][/ROW]
[ROW][C]43[/C][C]0.371704935817369[/C][C]0.743409871634738[/C][C]0.628295064182631[/C][/ROW]
[ROW][C]44[/C][C]0.30412501172365[/C][C]0.6082500234473[/C][C]0.69587498827635[/C][/ROW]
[ROW][C]45[/C][C]0.239362912475451[/C][C]0.478725824950902[/C][C]0.760637087524549[/C][/ROW]
[ROW][C]46[/C][C]0.220714586141189[/C][C]0.441429172282378[/C][C]0.779285413858811[/C][/ROW]
[ROW][C]47[/C][C]0.185872920650523[/C][C]0.371745841301045[/C][C]0.814127079349477[/C][/ROW]
[ROW][C]48[/C][C]0.142826386919290[/C][C]0.285652773838580[/C][C]0.85717361308071[/C][/ROW]
[ROW][C]49[/C][C]0.116310085726659[/C][C]0.232620171453319[/C][C]0.88368991427334[/C][/ROW]
[ROW][C]50[/C][C]0.119414423614903[/C][C]0.238828847229805[/C][C]0.880585576385097[/C][/ROW]
[ROW][C]51[/C][C]0.296497056665637[/C][C]0.592994113331274[/C][C]0.703502943334363[/C][/ROW]
[ROW][C]52[/C][C]0.693899066076727[/C][C]0.612201867846546[/C][C]0.306100933923273[/C][/ROW]
[ROW][C]53[/C][C]0.532266738864283[/C][C]0.935466522271434[/C][C]0.467733261135717[/C][/ROW]
[/TABLE]
Source: https://freestatistics.org/blog/index.php?pk=68936&T=5

Globally Unique Identifier (entire table): ba.freestatistics.org/blog/index.php?pk=68936&T=5

As an alternative you can also use a QR Code:  

The GUIDs for individual cells are displayed in the table below:

Goldfeld-Quandt test for Heteroskedasticity
p-valuesAlternative Hypothesis
breakpoint indexgreater2-sidedless
160.3586465197825590.7172930395651170.641353480217441
170.2232713246072790.4465426492145580.776728675392721
180.2535290978515060.5070581957030110.746470902148495
190.1740328554855920.3480657109711840.825967144514408
200.1792183046048890.3584366092097780.820781695395111
210.1402177904079520.2804355808159040.859782209592048
220.1144363884095650.2288727768191300.885563611590435
230.08420704774354070.1684140954870810.91579295225646
240.06752566727685160.1350513345537030.932474332723148
250.08806679334609090.1761335866921820.91193320665391
260.08207035390502780.1641407078100560.917929646094972
270.1231659419129150.2463318838258290.876834058087085
280.08265870705054850.1653174141010970.917341292949452
290.06608885848976630.1321777169795330.933911141510234
300.07196606454767140.1439321290953430.928033935452329
310.1441136318859100.2882272637718200.85588636811409
320.1026058215282270.2052116430564550.897394178471773
330.07617962791599420.1523592558319880.923820372084006
340.1614578827306530.3229157654613060.838542117269347
350.1900735330605760.3801470661211520.809926466939424
360.1698955584326040.3397911168652080.830104441567396
370.1636650806655510.3273301613311030.836334919334449
380.1563550349199520.3127100698399050.843644965080048
390.1836900287342750.3673800574685490.816309971265725
400.2835749409288420.5671498818576840.716425059071158
410.4095384653536410.8190769307072820.590461534646359
420.3301160814240720.6602321628481450.669883918575928
430.3717049358173690.7434098716347380.628295064182631
440.304125011723650.60825002344730.69587498827635
450.2393629124754510.4787258249509020.760637087524549
460.2207145861411890.4414291722823780.779285413858811
470.1858729206505230.3717458413010450.814127079349477
480.1428263869192900.2856527738385800.85717361308071
490.1163100857266590.2326201714533190.88368991427334
500.1194144236149030.2388288472298050.880585576385097
510.2964970566656370.5929941133312740.703502943334363
520.6938990660767270.6122018678465460.306100933923273
530.5322667388642830.9354665222714340.467733261135717


Meta Analysis of Goldfeld-Quandt test for Heteroskedasticity
Description# significant tests% significant testsOK/NOK
1% type I error level00OK
5% type I error level00OK
10% type I error level00OK

\begin{tabular}{lllllllll}
\hline
Meta Analysis of Goldfeld-Quandt test for Heteroskedasticity \tabularnewline
Description & # significant tests & % significant tests & OK/NOK \tabularnewline
1% type I error level & 0 & 0 & OK \tabularnewline
5% type I error level & 0 & 0 & OK \tabularnewline
10% type I error level & 0 & 0 & OK \tabularnewline
\hline
\end{tabular}
%Source: https://freestatistics.org/blog/index.php?pk=68936&T=6

[TABLE]
[ROW][C]Meta Analysis of Goldfeld-Quandt test for Heteroskedasticity[/C][/ROW]
[ROW][C]Description[/C][C]# significant tests[/C][C]% significant tests[/C][C]OK/NOK[/C][/ROW]
[ROW][C]1% type I error level[/C][C]0[/C][C]0[/C][C]OK[/C][/ROW]
[ROW][C]5% type I error level[/C][C]0[/C][C]0[/C][C]OK[/C][/ROW]
[ROW][C]10% type I error level[/C][C]0[/C][C]0[/C][C]OK[/C][/ROW]
[/TABLE]
Source: https://freestatistics.org/blog/index.php?pk=68936&T=6

Globally Unique Identifier (entire table): ba.freestatistics.org/blog/index.php?pk=68936&T=6

As an alternative you can also use a QR Code:  

The GUIDs for individual cells are displayed in the table below:

Meta Analysis of Goldfeld-Quandt test for Heteroskedasticity
Description# significant tests% significant testsOK/NOK
1% type I error level00OK
5% type I error level00OK
10% type I error level00OK


Parameters (Session):
Parameters (R input):
par1 = 1 ; par2 = Include Monthly Dummies ; par3 = Linear Trend ;
R code (references can be found in the software module):
library(lattice)
library(lmtest)
n25 <- 25 #minimum number of obs. for Goldfeld-Quandt test
par1 <- as.numeric(par1)
x <- t(y)
k <- length(x[1,])
n <- length(x[,1])
x1 <- cbind(x[,par1], x[,1:k!=par1])
mycolnames <- c(colnames(x)[par1], colnames(x)[1:k!=par1])
colnames(x1) <- mycolnames #colnames(x)[par1]
x <- x1
if (par3 == 'First Differences'){
x2 <- array(0, dim=c(n-1,k), dimnames=list(1:(n-1), paste('(1-B)',colnames(x),sep='')))
for (i in 1:n-1) {
for (j in 1:k) {
x2[i,j] <- x[i+1,j] - x[i,j]
}
}
x <- x2
}
if (par2 == 'Include Monthly Dummies'){
x2 <- array(0, dim=c(n,11), dimnames=list(1:n, paste('M', seq(1:11), sep ='')))
for (i in 1:11){
x2[seq(i,n,12),i] <- 1
}
x <- cbind(x, x2)
}
if (par2 == 'Include Quarterly Dummies'){
x2 <- array(0, dim=c(n,3), dimnames=list(1:n, paste('Q', seq(1:3), sep ='')))
for (i in 1:3){
x2[seq(i,n,4),i] <- 1
}
x <- cbind(x, x2)
}
k <- length(x[1,])
if (par3 == 'Linear Trend'){
x <- cbind(x, c(1:n))
colnames(x)[k+1] <- 't'
}
x
k <- length(x[1,])
df <- as.data.frame(x)
(mylm <- lm(df))
(mysum <- summary(mylm))
if (n > n25) {
kp3 <- k + 3
nmkm3 <- n - k - 3
gqarr <- array(NA, dim=c(nmkm3-kp3+1,3))
numgqtests <- 0
numsignificant1 <- 0
numsignificant5 <- 0
numsignificant10 <- 0
for (mypoint in kp3:nmkm3) {
j <- 0
numgqtests <- numgqtests + 1
for (myalt in c('greater', 'two.sided', 'less')) {
j <- j + 1
gqarr[mypoint-kp3+1,j] <- gqtest(mylm, point=mypoint, alternative=myalt)$p.value
}
if (gqarr[mypoint-kp3+1,2] < 0.01) numsignificant1 <- numsignificant1 + 1
if (gqarr[mypoint-kp3+1,2] < 0.05) numsignificant5 <- numsignificant5 + 1
if (gqarr[mypoint-kp3+1,2] < 0.10) numsignificant10 <- numsignificant10 + 1
}
gqarr
}
bitmap(file='test0.png')
plot(x[,1], type='l', main='Actuals and Interpolation', ylab='value of Actuals and Interpolation (dots)', xlab='time or index')
points(x[,1]-mysum$resid)
grid()
dev.off()
bitmap(file='test1.png')
plot(mysum$resid, type='b', pch=19, main='Residuals', ylab='value of Residuals', xlab='time or index')
grid()
dev.off()
bitmap(file='test2.png')
hist(mysum$resid, main='Residual Histogram', xlab='values of Residuals')
grid()
dev.off()
bitmap(file='test3.png')
densityplot(~mysum$resid,col='black',main='Residual Density Plot', xlab='values of Residuals')
dev.off()
bitmap(file='test4.png')
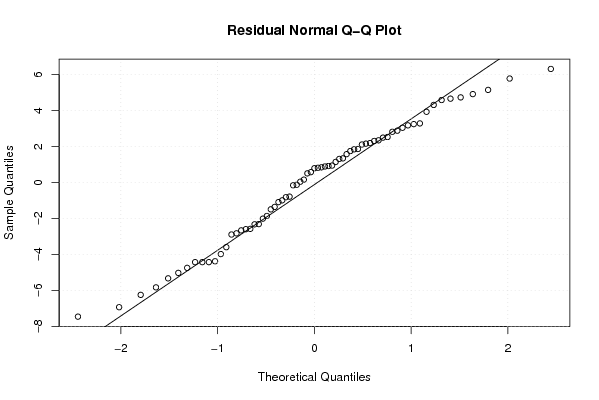
qqnorm(mysum$resid, main='Residual Normal Q-Q Plot')
qqline(mysum$resid)
grid()
dev.off()
(myerror <- as.ts(mysum$resid))
bitmap(file='test5.png')
dum <- cbind(lag(myerror,k=1),myerror)
dum
dum1 <- dum[2:length(myerror),]
dum1
z <- as.data.frame(dum1)
z
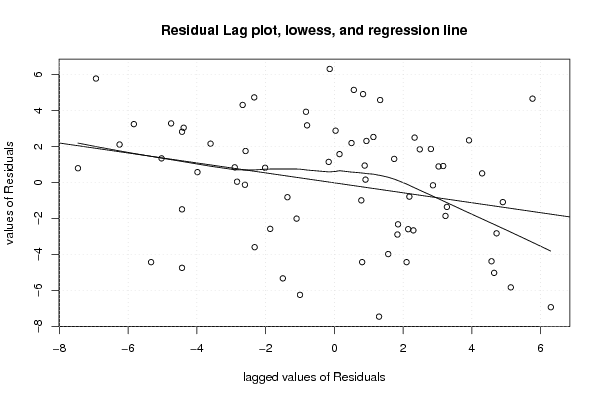
plot(z,main=paste('Residual Lag plot, lowess, and regression line'), ylab='values of Residuals', xlab='lagged values of Residuals')
lines(lowess(z))
abline(lm(z))
grid()
dev.off()
bitmap(file='test6.png')
acf(mysum$resid, lag.max=length(mysum$resid)/2, main='Residual Autocorrelation Function')
grid()
dev.off()
bitmap(file='test7.png')
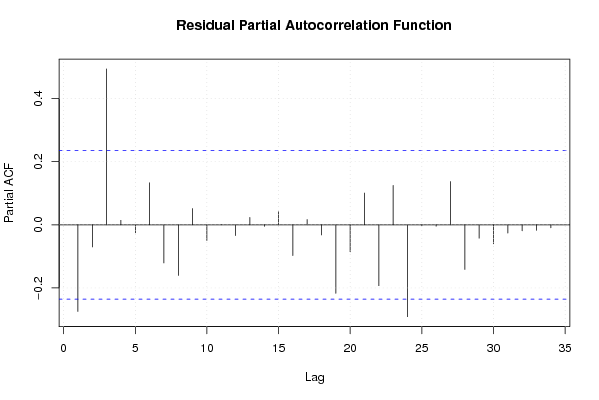
pacf(mysum$resid, lag.max=length(mysum$resid)/2, main='Residual Partial Autocorrelation Function')
grid()
dev.off()
bitmap(file='test8.png')
opar <- par(mfrow = c(2,2), oma = c(0, 0, 1.1, 0))
plot(mylm, las = 1, sub='Residual Diagnostics')
par(opar)
dev.off()
if (n > n25) {
bitmap(file='test9.png')
plot(kp3:nmkm3,gqarr[,2], main='Goldfeld-Quandt test',ylab='2-sided p-value',xlab='breakpoint')
grid()
dev.off()
}
load(file='createtable')
a<-table.start()
a<-table.row.start(a)
a<-table.element(a, 'Multiple Linear Regression - Estimated Regression Equation', 1, TRUE)
a<-table.row.end(a)
myeq <- colnames(x)[1]
myeq <- paste(myeq, '[t] = ', sep='')
for (i in 1:k){
if (mysum$coefficients[i,1] > 0) myeq <- paste(myeq, '+', '')
myeq <- paste(myeq, mysum$coefficients[i,1], sep=' ')
if (rownames(mysum$coefficients)[i] != '(Intercept)') {
myeq <- paste(myeq, rownames(mysum$coefficients)[i], sep='')
if (rownames(mysum$coefficients)[i] != 't') myeq <- paste(myeq, '[t]', sep='')
}
}
myeq <- paste(myeq, ' + e[t]')
a<-table.row.start(a)
a<-table.element(a, myeq)
a<-table.row.end(a)
a<-table.end(a)
table.save(a,file='mytable1.tab')
a<-table.start()
a<-table.row.start(a)
a<-table.element(a,hyperlink('ols1.htm','Multiple Linear Regression - Ordinary Least Squares',''), 6, TRUE)
a<-table.row.end(a)
a<-table.row.start(a)
a<-table.element(a,'Variable',header=TRUE)
a<-table.element(a,'Parameter',header=TRUE)
a<-table.element(a,'S.D.',header=TRUE)
a<-table.element(a,'T-STAT
H0: parameter = 0',header=TRUE)
a<-table.element(a,'2-tail p-value',header=TRUE)
a<-table.element(a,'1-tail p-value',header=TRUE)
a<-table.row.end(a)
for (i in 1:k){
a<-table.row.start(a)
a<-table.element(a,rownames(mysum$coefficients)[i],header=TRUE)
a<-table.element(a,mysum$coefficients[i,1])
a<-table.element(a, round(mysum$coefficients[i,2],6))
a<-table.element(a, round(mysum$coefficients[i,3],4))
a<-table.element(a, round(mysum$coefficients[i,4],6))
a<-table.element(a, round(mysum$coefficients[i,4]/2,6))
a<-table.row.end(a)
}
a<-table.end(a)
table.save(a,file='mytable2.tab')
a<-table.start()
a<-table.row.start(a)
a<-table.element(a, 'Multiple Linear Regression - Regression Statistics', 2, TRUE)
a<-table.row.end(a)
a<-table.row.start(a)
a<-table.element(a, 'Multiple R',1,TRUE)
a<-table.element(a, sqrt(mysum$r.squared))
a<-table.row.end(a)
a<-table.row.start(a)
a<-table.element(a, 'R-squared',1,TRUE)
a<-table.element(a, mysum$r.squared)
a<-table.row.end(a)
a<-table.row.start(a)
a<-table.element(a, 'Adjusted R-squared',1,TRUE)
a<-table.element(a, mysum$adj.r.squared)
a<-table.row.end(a)
a<-table.row.start(a)
a<-table.element(a, 'F-TEST (value)',1,TRUE)
a<-table.element(a, mysum$fstatistic[1])
a<-table.row.end(a)
a<-table.row.start(a)
a<-table.element(a, 'F-TEST (DF numerator)',1,TRUE)
a<-table.element(a, mysum$fstatistic[2])
a<-table.row.end(a)
a<-table.row.start(a)
a<-table.element(a, 'F-TEST (DF denominator)',1,TRUE)
a<-table.element(a, mysum$fstatistic[3])
a<-table.row.end(a)
a<-table.row.start(a)
a<-table.element(a, 'p-value',1,TRUE)
a<-table.element(a, 1-pf(mysum$fstatistic[1],mysum$fstatistic[2],mysum$fstatistic[3]))
a<-table.row.end(a)
a<-table.row.start(a)
a<-table.element(a, 'Multiple Linear Regression - Residual Statistics', 2, TRUE)
a<-table.row.end(a)
a<-table.row.start(a)
a<-table.element(a, 'Residual Standard Deviation',1,TRUE)
a<-table.element(a, mysum$sigma)
a<-table.row.end(a)
a<-table.row.start(a)
a<-table.element(a, 'Sum Squared Residuals',1,TRUE)
a<-table.element(a, sum(myerror*myerror))
a<-table.row.end(a)
a<-table.end(a)
table.save(a,file='mytable3.tab')
a<-table.start()
a<-table.row.start(a)
a<-table.element(a, 'Multiple Linear Regression - Actuals, Interpolation, and Residuals', 4, TRUE)
a<-table.row.end(a)
a<-table.row.start(a)
a<-table.element(a, 'Time or Index', 1, TRUE)
a<-table.element(a, 'Actuals', 1, TRUE)
a<-table.element(a, 'Interpolation
Forecast', 1, TRUE)
a<-table.element(a, 'Residuals
Prediction Error', 1, TRUE)
a<-table.row.end(a)
for (i in 1:n) {
a<-table.row.start(a)
a<-table.element(a,i, 1, TRUE)
a<-table.element(a,x[i])
a<-table.element(a,x[i]-mysum$resid[i])
a<-table.element(a,mysum$resid[i])
a<-table.row.end(a)
}
a<-table.end(a)
table.save(a,file='mytable4.tab')
if (n > n25) {
a<-table.start()
a<-table.row.start(a)
a<-table.element(a,'Goldfeld-Quandt test for Heteroskedasticity',4,TRUE)
a<-table.row.end(a)
a<-table.row.start(a)
a<-table.element(a,'p-values',header=TRUE)
a<-table.element(a,'Alternative Hypothesis',3,header=TRUE)
a<-table.row.end(a)
a<-table.row.start(a)
a<-table.element(a,'breakpoint index',header=TRUE)
a<-table.element(a,'greater',header=TRUE)
a<-table.element(a,'2-sided',header=TRUE)
a<-table.element(a,'less',header=TRUE)
a<-table.row.end(a)
for (mypoint in kp3:nmkm3) {
a<-table.row.start(a)
a<-table.element(a,mypoint,header=TRUE)
a<-table.element(a,gqarr[mypoint-kp3+1,1])
a<-table.element(a,gqarr[mypoint-kp3+1,2])
a<-table.element(a,gqarr[mypoint-kp3+1,3])
a<-table.row.end(a)
}
a<-table.end(a)
table.save(a,file='mytable5.tab')
a<-table.start()
a<-table.row.start(a)
a<-table.element(a,'Meta Analysis of Goldfeld-Quandt test for Heteroskedasticity',4,TRUE)
a<-table.row.end(a)
a<-table.row.start(a)
a<-table.element(a,'Description',header=TRUE)
a<-table.element(a,'# significant tests',header=TRUE)
a<-table.element(a,'% significant tests',header=TRUE)
a<-table.element(a,'OK/NOK',header=TRUE)
a<-table.row.end(a)
a<-table.row.start(a)
a<-table.element(a,'1% type I error level',header=TRUE)
a<-table.element(a,numsignificant1)
a<-table.element(a,numsignificant1/numgqtests)
if (numsignificant1/numgqtests < 0.01) dum <- 'OK' else dum <- 'NOK'
a<-table.element(a,dum)
a<-table.row.end(a)
a<-table.row.start(a)
a<-table.element(a,'5% type I error level',header=TRUE)
a<-table.element(a,numsignificant5)
a<-table.element(a,numsignificant5/numgqtests)
if (numsignificant5/numgqtests < 0.05) dum <- 'OK' else dum <- 'NOK'
a<-table.element(a,dum)
a<-table.row.end(a)
a<-table.row.start(a)
a<-table.element(a,'10% type I error level',header=TRUE)
a<-table.element(a,numsignificant10)
a<-table.element(a,numsignificant10/numgqtests)
if (numsignificant10/numgqtests < 0.1) dum <- 'OK' else dum <- 'NOK'
a<-table.element(a,dum)
a<-table.row.end(a)
a<-table.end(a)
table.save(a,file='mytable6.tab')
}