Free Statistics

of Irreproducible Research!

Author's title

Author*The author of this computation has been verified*
R Software Modulerwasp_autocorrelation.wasp
Title produced by software(Partial) Autocorrelation Function
Date of computationThu, 17 Dec 2009 08:24:21 -0700
Cite this page as followsStatistical Computations at FreeStatistics.org, Office for Research Development and Education, URL https://freestatistics.org/blog/index.php?v=date/2009/Dec/17/t1261063504au59jtjr9xar4fh.htm/, Retrieved Tue, 30 Apr 2024 05:20:56 +0000
Statistical Computations at FreeStatistics.org, Office for Research Development and Education, URL https://freestatistics.org/blog/index.php?pk=68946, Retrieved Tue, 30 Apr 2024 05:20:56 +0000
QR Codes:

Original text written by user:
IsPrivate?No (this computation is public)
User-defined keywords
Estimated Impact91
Family? (F = Feedback message, R = changed R code, M = changed R Module, P = changed Parameters, D = changed Data)
-       [(Partial) Autocorrelation Function] [] [2009-12-17 15:24:21] [71596e6a53ccce532e52aaf6113616ef] [Current]
Feedback Forum

Post a new message
Dataseries X:
97,4
97
105,4
102,7
98,1
104,5
87,4
89,9
109,8
111,7
98,6
96,9
95,1
97
112,7
102,9
97,4
111,4
87,4
96,8
114,1
110,3
103,9
101,6
94,6
95,9
104,7
102,8
98,1
113,9
80,9
95,7
113,2
105,9
108,8
102,3
99
100,7
115,5
100,7
109,9
114,6
85,4
100,5
114,8
116,5
112,9
102
106
105,3
118,8
106,1
109,3
117,2
92,5
104,2
112,5
122,4
113,3
100
110,7
112,8
109,8
117,3
109,1
115,9
96
99,8
116,8


Summary of computational transaction
Raw Inputview raw input (R code)
Raw Outputview raw output of R engine
Computing time3 seconds
R Server'Gwilym Jenkins' @ 72.249.127.135

\begin{tabular}{lllllllll}
\hline
Summary of computational transaction \tabularnewline
Raw Input & view raw input (R code)  \tabularnewline
Raw Output & view raw output of R engine  \tabularnewline
Computing time & 3 seconds \tabularnewline
R Server & 'Gwilym Jenkins' @ 72.249.127.135 \tabularnewline
\hline
\end{tabular}
%Source: https://freestatistics.org/blog/index.php?pk=68946&T=0

[TABLE]
[ROW][C]Summary of computational transaction[/C][/ROW]
[ROW][C]Raw Input[/C][C]view raw input (R code) [/C][/ROW]
[ROW][C]Raw Output[/C][C]view raw output of R engine [/C][/ROW]
[ROW][C]Computing time[/C][C]3 seconds[/C][/ROW]
[ROW][C]R Server[/C][C]'Gwilym Jenkins' @ 72.249.127.135[/C][/ROW]
[/TABLE]
Source: https://freestatistics.org/blog/index.php?pk=68946&T=0

Globally Unique Identifier (entire table): ba.freestatistics.org/blog/index.php?pk=68946&T=0

As an alternative you can also use a QR Code:  

The GUIDs for individual cells are displayed in the table below:

Summary of computational transaction
Raw Inputview raw input (R code)
Raw Outputview raw output of R engine
Computing time3 seconds
R Server'Gwilym Jenkins' @ 72.249.127.135


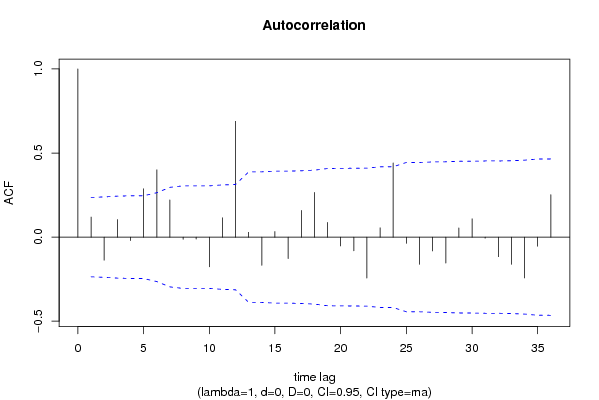
Autocorrelation Function
Time lag kACF(k)T-STATP-value
10.1192890.99090.1626
2-0.136734-1.13580.129986
30.1041080.86480.195077
4-0.020608-0.17120.432291
50.2871682.38540.009906
60.4001433.32380.000712
70.2211141.83670.03528
8-0.012677-0.10530.458219
9-0.011224-0.09320.462993
10-0.176293-1.46440.073813
110.1152590.95740.170851
120.6883515.71790
130.0286330.23780.406352
14-0.167236-1.38920.084625
150.0330490.27450.392251
16-0.127136-1.05610.147309
170.1586071.31750.096016
180.2660942.21030.0152
190.0873020.72520.235397
20-0.052311-0.43450.332632
21-0.081648-0.67820.249951
22-0.243462-2.02230.02351
230.0551190.45790.324248
240.4412163.6650.000241
25-0.036797-0.30570.380391
26-0.161489-1.34140.09209
27-0.082424-0.68470.247925
28-0.154021-1.27940.102522
290.0545710.45330.325876
300.1092790.90770.183587
31-0.006338-0.05260.479083
32-0.116064-0.96410.169181
33-0.161713-1.34330.09179
34-0.242335-2.0130.02401
35-0.053664-0.44580.32858
360.2521692.09470.019937

\begin{tabular}{lllllllll}
\hline
Autocorrelation Function \tabularnewline
Time lag k & ACF(k) & T-STAT & P-value \tabularnewline
1 & 0.119289 & 0.9909 & 0.1626 \tabularnewline
2 & -0.136734 & -1.1358 & 0.129986 \tabularnewline
3 & 0.104108 & 0.8648 & 0.195077 \tabularnewline
4 & -0.020608 & -0.1712 & 0.432291 \tabularnewline
5 & 0.287168 & 2.3854 & 0.009906 \tabularnewline
6 & 0.400143 & 3.3238 & 0.000712 \tabularnewline
7 & 0.221114 & 1.8367 & 0.03528 \tabularnewline
8 & -0.012677 & -0.1053 & 0.458219 \tabularnewline
9 & -0.011224 & -0.0932 & 0.462993 \tabularnewline
10 & -0.176293 & -1.4644 & 0.073813 \tabularnewline
11 & 0.115259 & 0.9574 & 0.170851 \tabularnewline
12 & 0.688351 & 5.7179 & 0 \tabularnewline
13 & 0.028633 & 0.2378 & 0.406352 \tabularnewline
14 & -0.167236 & -1.3892 & 0.084625 \tabularnewline
15 & 0.033049 & 0.2745 & 0.392251 \tabularnewline
16 & -0.127136 & -1.0561 & 0.147309 \tabularnewline
17 & 0.158607 & 1.3175 & 0.096016 \tabularnewline
18 & 0.266094 & 2.2103 & 0.0152 \tabularnewline
19 & 0.087302 & 0.7252 & 0.235397 \tabularnewline
20 & -0.052311 & -0.4345 & 0.332632 \tabularnewline
21 & -0.081648 & -0.6782 & 0.249951 \tabularnewline
22 & -0.243462 & -2.0223 & 0.02351 \tabularnewline
23 & 0.055119 & 0.4579 & 0.324248 \tabularnewline
24 & 0.441216 & 3.665 & 0.000241 \tabularnewline
25 & -0.036797 & -0.3057 & 0.380391 \tabularnewline
26 & -0.161489 & -1.3414 & 0.09209 \tabularnewline
27 & -0.082424 & -0.6847 & 0.247925 \tabularnewline
28 & -0.154021 & -1.2794 & 0.102522 \tabularnewline
29 & 0.054571 & 0.4533 & 0.325876 \tabularnewline
30 & 0.109279 & 0.9077 & 0.183587 \tabularnewline
31 & -0.006338 & -0.0526 & 0.479083 \tabularnewline
32 & -0.116064 & -0.9641 & 0.169181 \tabularnewline
33 & -0.161713 & -1.3433 & 0.09179 \tabularnewline
34 & -0.242335 & -2.013 & 0.02401 \tabularnewline
35 & -0.053664 & -0.4458 & 0.32858 \tabularnewline
36 & 0.252169 & 2.0947 & 0.019937 \tabularnewline
\hline
\end{tabular}
%Source: https://freestatistics.org/blog/index.php?pk=68946&T=1

[TABLE]
[ROW][C]Autocorrelation Function[/C][/ROW]
[ROW][C]Time lag k[/C][C]ACF(k)[/C][C]T-STAT[/C][C]P-value[/C][/ROW]
[ROW][C]1[/C][C]0.119289[/C][C]0.9909[/C][C]0.1626[/C][/ROW]
[ROW][C]2[/C][C]-0.136734[/C][C]-1.1358[/C][C]0.129986[/C][/ROW]
[ROW][C]3[/C][C]0.104108[/C][C]0.8648[/C][C]0.195077[/C][/ROW]
[ROW][C]4[/C][C]-0.020608[/C][C]-0.1712[/C][C]0.432291[/C][/ROW]
[ROW][C]5[/C][C]0.287168[/C][C]2.3854[/C][C]0.009906[/C][/ROW]
[ROW][C]6[/C][C]0.400143[/C][C]3.3238[/C][C]0.000712[/C][/ROW]
[ROW][C]7[/C][C]0.221114[/C][C]1.8367[/C][C]0.03528[/C][/ROW]
[ROW][C]8[/C][C]-0.012677[/C][C]-0.1053[/C][C]0.458219[/C][/ROW]
[ROW][C]9[/C][C]-0.011224[/C][C]-0.0932[/C][C]0.462993[/C][/ROW]
[ROW][C]10[/C][C]-0.176293[/C][C]-1.4644[/C][C]0.073813[/C][/ROW]
[ROW][C]11[/C][C]0.115259[/C][C]0.9574[/C][C]0.170851[/C][/ROW]
[ROW][C]12[/C][C]0.688351[/C][C]5.7179[/C][C]0[/C][/ROW]
[ROW][C]13[/C][C]0.028633[/C][C]0.2378[/C][C]0.406352[/C][/ROW]
[ROW][C]14[/C][C]-0.167236[/C][C]-1.3892[/C][C]0.084625[/C][/ROW]
[ROW][C]15[/C][C]0.033049[/C][C]0.2745[/C][C]0.392251[/C][/ROW]
[ROW][C]16[/C][C]-0.127136[/C][C]-1.0561[/C][C]0.147309[/C][/ROW]
[ROW][C]17[/C][C]0.158607[/C][C]1.3175[/C][C]0.096016[/C][/ROW]
[ROW][C]18[/C][C]0.266094[/C][C]2.2103[/C][C]0.0152[/C][/ROW]
[ROW][C]19[/C][C]0.087302[/C][C]0.7252[/C][C]0.235397[/C][/ROW]
[ROW][C]20[/C][C]-0.052311[/C][C]-0.4345[/C][C]0.332632[/C][/ROW]
[ROW][C]21[/C][C]-0.081648[/C][C]-0.6782[/C][C]0.249951[/C][/ROW]
[ROW][C]22[/C][C]-0.243462[/C][C]-2.0223[/C][C]0.02351[/C][/ROW]
[ROW][C]23[/C][C]0.055119[/C][C]0.4579[/C][C]0.324248[/C][/ROW]
[ROW][C]24[/C][C]0.441216[/C][C]3.665[/C][C]0.000241[/C][/ROW]
[ROW][C]25[/C][C]-0.036797[/C][C]-0.3057[/C][C]0.380391[/C][/ROW]
[ROW][C]26[/C][C]-0.161489[/C][C]-1.3414[/C][C]0.09209[/C][/ROW]
[ROW][C]27[/C][C]-0.082424[/C][C]-0.6847[/C][C]0.247925[/C][/ROW]
[ROW][C]28[/C][C]-0.154021[/C][C]-1.2794[/C][C]0.102522[/C][/ROW]
[ROW][C]29[/C][C]0.054571[/C][C]0.4533[/C][C]0.325876[/C][/ROW]
[ROW][C]30[/C][C]0.109279[/C][C]0.9077[/C][C]0.183587[/C][/ROW]
[ROW][C]31[/C][C]-0.006338[/C][C]-0.0526[/C][C]0.479083[/C][/ROW]
[ROW][C]32[/C][C]-0.116064[/C][C]-0.9641[/C][C]0.169181[/C][/ROW]
[ROW][C]33[/C][C]-0.161713[/C][C]-1.3433[/C][C]0.09179[/C][/ROW]
[ROW][C]34[/C][C]-0.242335[/C][C]-2.013[/C][C]0.02401[/C][/ROW]
[ROW][C]35[/C][C]-0.053664[/C][C]-0.4458[/C][C]0.32858[/C][/ROW]
[ROW][C]36[/C][C]0.252169[/C][C]2.0947[/C][C]0.019937[/C][/ROW]
[/TABLE]
Source: https://freestatistics.org/blog/index.php?pk=68946&T=1

Globally Unique Identifier (entire table): ba.freestatistics.org/blog/index.php?pk=68946&T=1

As an alternative you can also use a QR Code:  

The GUIDs for individual cells are displayed in the table below:

Autocorrelation Function
Time lag kACF(k)T-STATP-value
10.1192890.99090.1626
2-0.136734-1.13580.129986
30.1041080.86480.195077
4-0.020608-0.17120.432291
50.2871682.38540.009906
60.4001433.32380.000712
70.2211141.83670.03528
8-0.012677-0.10530.458219
9-0.011224-0.09320.462993
10-0.176293-1.46440.073813
110.1152590.95740.170851
120.6883515.71790
130.0286330.23780.406352
14-0.167236-1.38920.084625
150.0330490.27450.392251
16-0.127136-1.05610.147309
170.1586071.31750.096016
180.2660942.21030.0152
190.0873020.72520.235397
20-0.052311-0.43450.332632
21-0.081648-0.67820.249951
22-0.243462-2.02230.02351
230.0551190.45790.324248
240.4412163.6650.000241
25-0.036797-0.30570.380391
26-0.161489-1.34140.09209
27-0.082424-0.68470.247925
28-0.154021-1.27940.102522
290.0545710.45330.325876
300.1092790.90770.183587
31-0.006338-0.05260.479083
32-0.116064-0.96410.169181
33-0.161713-1.34330.09179
34-0.242335-2.0130.02401
35-0.053664-0.44580.32858
360.2521692.09470.019937


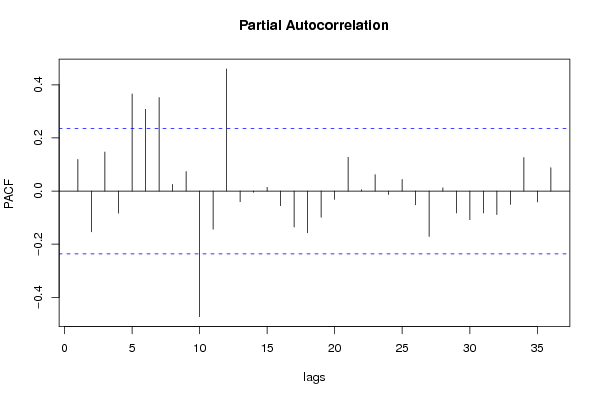
Partial Autocorrelation Function
Time lag kPACF(k)T-STATP-value
10.1192890.99090.1626
2-0.153143-1.27210.103804
30.1466631.21830.113635
4-0.083296-0.69190.245658
50.3656973.03770.001682
60.307822.55690.006381
70.351982.92380.002337
80.0252570.20980.417219
90.0734290.60990.271949
10-0.472615-3.92580.000101
11-0.143507-1.19210.118661
120.459653.81810.000145
13-0.039714-0.32990.371242
14-0.004659-0.03870.484622
150.0141070.11720.45353
16-0.054847-0.45560.325056
17-0.135601-1.12640.131952
18-0.157125-1.30520.098084
19-0.098613-0.81910.207763
20-0.030823-0.2560.399342
210.126951.05450.14766
220.0051630.04290.482959
230.0619380.51450.304275
24-0.012961-0.10770.457287
250.043980.36530.357993
26-0.051678-0.42930.334534
27-0.170566-1.41680.080517
280.0123760.10280.45921
29-0.082177-0.68260.248568
30-0.107537-0.89330.187409
31-0.08243-0.68470.247909
32-0.088246-0.7330.233014
33-0.050105-0.41620.339277
340.1262191.04850.149044
35-0.040844-0.33930.367716
360.0878290.72960.234062

\begin{tabular}{lllllllll}
\hline
Partial Autocorrelation Function \tabularnewline
Time lag k & PACF(k) & T-STAT & P-value \tabularnewline
1 & 0.119289 & 0.9909 & 0.1626 \tabularnewline
2 & -0.153143 & -1.2721 & 0.103804 \tabularnewline
3 & 0.146663 & 1.2183 & 0.113635 \tabularnewline
4 & -0.083296 & -0.6919 & 0.245658 \tabularnewline
5 & 0.365697 & 3.0377 & 0.001682 \tabularnewline
6 & 0.30782 & 2.5569 & 0.006381 \tabularnewline
7 & 0.35198 & 2.9238 & 0.002337 \tabularnewline
8 & 0.025257 & 0.2098 & 0.417219 \tabularnewline
9 & 0.073429 & 0.6099 & 0.271949 \tabularnewline
10 & -0.472615 & -3.9258 & 0.000101 \tabularnewline
11 & -0.143507 & -1.1921 & 0.118661 \tabularnewline
12 & 0.45965 & 3.8181 & 0.000145 \tabularnewline
13 & -0.039714 & -0.3299 & 0.371242 \tabularnewline
14 & -0.004659 & -0.0387 & 0.484622 \tabularnewline
15 & 0.014107 & 0.1172 & 0.45353 \tabularnewline
16 & -0.054847 & -0.4556 & 0.325056 \tabularnewline
17 & -0.135601 & -1.1264 & 0.131952 \tabularnewline
18 & -0.157125 & -1.3052 & 0.098084 \tabularnewline
19 & -0.098613 & -0.8191 & 0.207763 \tabularnewline
20 & -0.030823 & -0.256 & 0.399342 \tabularnewline
21 & 0.12695 & 1.0545 & 0.14766 \tabularnewline
22 & 0.005163 & 0.0429 & 0.482959 \tabularnewline
23 & 0.061938 & 0.5145 & 0.304275 \tabularnewline
24 & -0.012961 & -0.1077 & 0.457287 \tabularnewline
25 & 0.04398 & 0.3653 & 0.357993 \tabularnewline
26 & -0.051678 & -0.4293 & 0.334534 \tabularnewline
27 & -0.170566 & -1.4168 & 0.080517 \tabularnewline
28 & 0.012376 & 0.1028 & 0.45921 \tabularnewline
29 & -0.082177 & -0.6826 & 0.248568 \tabularnewline
30 & -0.107537 & -0.8933 & 0.187409 \tabularnewline
31 & -0.08243 & -0.6847 & 0.247909 \tabularnewline
32 & -0.088246 & -0.733 & 0.233014 \tabularnewline
33 & -0.050105 & -0.4162 & 0.339277 \tabularnewline
34 & 0.126219 & 1.0485 & 0.149044 \tabularnewline
35 & -0.040844 & -0.3393 & 0.367716 \tabularnewline
36 & 0.087829 & 0.7296 & 0.234062 \tabularnewline
\hline
\end{tabular}
%Source: https://freestatistics.org/blog/index.php?pk=68946&T=2

[TABLE]
[ROW][C]Partial Autocorrelation Function[/C][/ROW]
[ROW][C]Time lag k[/C][C]PACF(k)[/C][C]T-STAT[/C][C]P-value[/C][/ROW]
[ROW][C]1[/C][C]0.119289[/C][C]0.9909[/C][C]0.1626[/C][/ROW]
[ROW][C]2[/C][C]-0.153143[/C][C]-1.2721[/C][C]0.103804[/C][/ROW]
[ROW][C]3[/C][C]0.146663[/C][C]1.2183[/C][C]0.113635[/C][/ROW]
[ROW][C]4[/C][C]-0.083296[/C][C]-0.6919[/C][C]0.245658[/C][/ROW]
[ROW][C]5[/C][C]0.365697[/C][C]3.0377[/C][C]0.001682[/C][/ROW]
[ROW][C]6[/C][C]0.30782[/C][C]2.5569[/C][C]0.006381[/C][/ROW]
[ROW][C]7[/C][C]0.35198[/C][C]2.9238[/C][C]0.002337[/C][/ROW]
[ROW][C]8[/C][C]0.025257[/C][C]0.2098[/C][C]0.417219[/C][/ROW]
[ROW][C]9[/C][C]0.073429[/C][C]0.6099[/C][C]0.271949[/C][/ROW]
[ROW][C]10[/C][C]-0.472615[/C][C]-3.9258[/C][C]0.000101[/C][/ROW]
[ROW][C]11[/C][C]-0.143507[/C][C]-1.1921[/C][C]0.118661[/C][/ROW]
[ROW][C]12[/C][C]0.45965[/C][C]3.8181[/C][C]0.000145[/C][/ROW]
[ROW][C]13[/C][C]-0.039714[/C][C]-0.3299[/C][C]0.371242[/C][/ROW]
[ROW][C]14[/C][C]-0.004659[/C][C]-0.0387[/C][C]0.484622[/C][/ROW]
[ROW][C]15[/C][C]0.014107[/C][C]0.1172[/C][C]0.45353[/C][/ROW]
[ROW][C]16[/C][C]-0.054847[/C][C]-0.4556[/C][C]0.325056[/C][/ROW]
[ROW][C]17[/C][C]-0.135601[/C][C]-1.1264[/C][C]0.131952[/C][/ROW]
[ROW][C]18[/C][C]-0.157125[/C][C]-1.3052[/C][C]0.098084[/C][/ROW]
[ROW][C]19[/C][C]-0.098613[/C][C]-0.8191[/C][C]0.207763[/C][/ROW]
[ROW][C]20[/C][C]-0.030823[/C][C]-0.256[/C][C]0.399342[/C][/ROW]
[ROW][C]21[/C][C]0.12695[/C][C]1.0545[/C][C]0.14766[/C][/ROW]
[ROW][C]22[/C][C]0.005163[/C][C]0.0429[/C][C]0.482959[/C][/ROW]
[ROW][C]23[/C][C]0.061938[/C][C]0.5145[/C][C]0.304275[/C][/ROW]
[ROW][C]24[/C][C]-0.012961[/C][C]-0.1077[/C][C]0.457287[/C][/ROW]
[ROW][C]25[/C][C]0.04398[/C][C]0.3653[/C][C]0.357993[/C][/ROW]
[ROW][C]26[/C][C]-0.051678[/C][C]-0.4293[/C][C]0.334534[/C][/ROW]
[ROW][C]27[/C][C]-0.170566[/C][C]-1.4168[/C][C]0.080517[/C][/ROW]
[ROW][C]28[/C][C]0.012376[/C][C]0.1028[/C][C]0.45921[/C][/ROW]
[ROW][C]29[/C][C]-0.082177[/C][C]-0.6826[/C][C]0.248568[/C][/ROW]
[ROW][C]30[/C][C]-0.107537[/C][C]-0.8933[/C][C]0.187409[/C][/ROW]
[ROW][C]31[/C][C]-0.08243[/C][C]-0.6847[/C][C]0.247909[/C][/ROW]
[ROW][C]32[/C][C]-0.088246[/C][C]-0.733[/C][C]0.233014[/C][/ROW]
[ROW][C]33[/C][C]-0.050105[/C][C]-0.4162[/C][C]0.339277[/C][/ROW]
[ROW][C]34[/C][C]0.126219[/C][C]1.0485[/C][C]0.149044[/C][/ROW]
[ROW][C]35[/C][C]-0.040844[/C][C]-0.3393[/C][C]0.367716[/C][/ROW]
[ROW][C]36[/C][C]0.087829[/C][C]0.7296[/C][C]0.234062[/C][/ROW]
[/TABLE]
Source: https://freestatistics.org/blog/index.php?pk=68946&T=2

Globally Unique Identifier (entire table): ba.freestatistics.org/blog/index.php?pk=68946&T=2

As an alternative you can also use a QR Code:  

The GUIDs for individual cells are displayed in the table below:

Partial Autocorrelation Function
Time lag kPACF(k)T-STATP-value
10.1192890.99090.1626
2-0.153143-1.27210.103804
30.1466631.21830.113635
4-0.083296-0.69190.245658
50.3656973.03770.001682
60.307822.55690.006381
70.351982.92380.002337
80.0252570.20980.417219
90.0734290.60990.271949
10-0.472615-3.92580.000101
11-0.143507-1.19210.118661
120.459653.81810.000145
13-0.039714-0.32990.371242
14-0.004659-0.03870.484622
150.0141070.11720.45353
16-0.054847-0.45560.325056
17-0.135601-1.12640.131952
18-0.157125-1.30520.098084
19-0.098613-0.81910.207763
20-0.030823-0.2560.399342
210.126951.05450.14766
220.0051630.04290.482959
230.0619380.51450.304275
24-0.012961-0.10770.457287
250.043980.36530.357993
26-0.051678-0.42930.334534
27-0.170566-1.41680.080517
280.0123760.10280.45921
29-0.082177-0.68260.248568
30-0.107537-0.89330.187409
31-0.08243-0.68470.247909
32-0.088246-0.7330.233014
33-0.050105-0.41620.339277
340.1262191.04850.149044
35-0.040844-0.33930.367716
360.0878290.72960.234062


Parameters (Session):
Parameters (R input):
par1 = 36 ; par2 = 1 ; par3 = 0 ; par4 = 0 ; par5 = 12 ; par6 = MA ; par7 = 0.95 ;
R code (references can be found in the software module):
if (par1 == 'Default') {
par1 = 10*log10(length(x))
} else {
par1 <- as.numeric(par1)
}
par2 <- as.numeric(par2)
par3 <- as.numeric(par3)
par4 <- as.numeric(par4)
par5 <- as.numeric(par5)
if (par6 == 'White Noise') par6 <- 'white' else par6 <- 'ma'
par7 <- as.numeric(par7)
if (par2 == 0) {
x <- log(x)
} else {
x <- (x ^ par2 - 1) / par2
}
if (par3 > 0) x <- diff(x,lag=1,difference=par3)
if (par4 > 0) x <- diff(x,lag=par5,difference=par4)
bitmap(file='pic1.png')
racf <- acf(x, par1, main='Autocorrelation', xlab='time lag', ylab='ACF', ci.type=par6, ci=par7, sub=paste('(lambda=',par2,', d=',par3,', D=',par4,', CI=', par7, ', CI type=',par6,')',sep=''))
dev.off()
bitmap(file='pic2.png')
rpacf <- pacf(x,par1,main='Partial Autocorrelation',xlab='lags',ylab='PACF')
dev.off()
(myacf <- c(racf$acf))
(mypacf <- c(rpacf$acf))
lengthx <- length(x)
sqrtn <- sqrt(lengthx)
load(file='createtable')
a<-table.start()
a<-table.row.start(a)
a<-table.element(a,'Autocorrelation Function',4,TRUE)
a<-table.row.end(a)
a<-table.row.start(a)
a<-table.element(a,'Time lag k',header=TRUE)
a<-table.element(a,hyperlink('basics.htm','ACF(k)','click here for more information about the Autocorrelation Function'),header=TRUE)
a<-table.element(a,'T-STAT',header=TRUE)
a<-table.element(a,'P-value',header=TRUE)
a<-table.row.end(a)
for (i in 2:(par1+1)) {
a<-table.row.start(a)
a<-table.element(a,i-1,header=TRUE)
a<-table.element(a,round(myacf[i],6))
mytstat <- myacf[i]*sqrtn
a<-table.element(a,round(mytstat,4))
a<-table.element(a,round(1-pt(abs(mytstat),lengthx),6))
a<-table.row.end(a)
}
a<-table.end(a)
table.save(a,file='mytable.tab')
a<-table.start()
a<-table.row.start(a)
a<-table.element(a,'Partial Autocorrelation Function',4,TRUE)
a<-table.row.end(a)
a<-table.row.start(a)
a<-table.element(a,'Time lag k',header=TRUE)
a<-table.element(a,hyperlink('basics.htm','PACF(k)','click here for more information about the Partial Autocorrelation Function'),header=TRUE)
a<-table.element(a,'T-STAT',header=TRUE)
a<-table.element(a,'P-value',header=TRUE)
a<-table.row.end(a)
for (i in 1:par1) {
a<-table.row.start(a)
a<-table.element(a,i,header=TRUE)
a<-table.element(a,round(mypacf[i],6))
mytstat <- mypacf[i]*sqrtn
a<-table.element(a,round(mytstat,4))
a<-table.element(a,round(1-pt(abs(mytstat),lengthx),6))
a<-table.row.end(a)
}
a<-table.end(a)
table.save(a,file='mytable1.tab')