Free Statistics

of Irreproducible Research!

Author's title

Author*The author of this computation has been verified*
R Software Modulerwasp_autocorrelation.wasp
Title produced by software(Partial) Autocorrelation Function
Date of computationThu, 17 Dec 2009 08:26:58 -0700
Cite this page as followsStatistical Computations at FreeStatistics.org, Office for Research Development and Education, URL https://freestatistics.org/blog/index.php?v=date/2009/Dec/17/t12610636609tum2s6qirl80yc.htm/, Retrieved Tue, 30 Apr 2024 01:21:06 +0000
Statistical Computations at FreeStatistics.org, Office for Research Development and Education, URL https://freestatistics.org/blog/index.php?pk=68947, Retrieved Tue, 30 Apr 2024 01:21:06 +0000
QR Codes:

Original text written by user:
IsPrivate?No (this computation is public)
User-defined keywords
Estimated Impact97
Family? (F = Feedback message, R = changed R code, M = changed R Module, P = changed Parameters, D = changed Data)
-       [(Partial) Autocorrelation Function] [] [2009-12-17 15:26:58] [71596e6a53ccce532e52aaf6113616ef] [Current]
Feedback Forum

Post a new message
Dataseries X:
97.4
97
105.4
102.7
98.1
104.5
87.4
89.9
109.8
111.7
98.6
96.9
95.1
97
112.7
102.9
97.4
111.4
87.4
96.8
114.1
110.3
103.9
101.6
94.6
95.9
104.7
102.8
98.1
113.9
80.9
95.7
113.2
105.9
108.8
102.3
99
100.7
115.5
100.7
109.9
114.6
85.4
100.5
114.8
116.5
112.9
102
106
105.3
118.8
106.1
109.3
117.2
92.5
104.2
112.5
122.4
113.3
100
110.7
112.8
109.8
117.3
109.1
115.9
96
99.8
116.8


Summary of computational transaction
Raw Inputview raw input (R code)
Raw Outputview raw output of R engine
Computing time1 seconds
R Server'Gwilym Jenkins' @ 72.249.127.135

\begin{tabular}{lllllllll}
\hline
Summary of computational transaction \tabularnewline
Raw Input & view raw input (R code)  \tabularnewline
Raw Output & view raw output of R engine  \tabularnewline
Computing time & 1 seconds \tabularnewline
R Server & 'Gwilym Jenkins' @ 72.249.127.135 \tabularnewline
\hline
\end{tabular}
%Source: https://freestatistics.org/blog/index.php?pk=68947&T=0

[TABLE]
[ROW][C]Summary of computational transaction[/C][/ROW]
[ROW][C]Raw Input[/C][C]view raw input (R code) [/C][/ROW]
[ROW][C]Raw Output[/C][C]view raw output of R engine [/C][/ROW]
[ROW][C]Computing time[/C][C]1 seconds[/C][/ROW]
[ROW][C]R Server[/C][C]'Gwilym Jenkins' @ 72.249.127.135[/C][/ROW]
[/TABLE]
Source: https://freestatistics.org/blog/index.php?pk=68947&T=0

Globally Unique Identifier (entire table): ba.freestatistics.org/blog/index.php?pk=68947&T=0

As an alternative you can also use a QR Code:  

The GUIDs for individual cells are displayed in the table below:

Summary of computational transaction
Raw Inputview raw input (R code)
Raw Outputview raw output of R engine
Computing time1 seconds
R Server'Gwilym Jenkins' @ 72.249.127.135


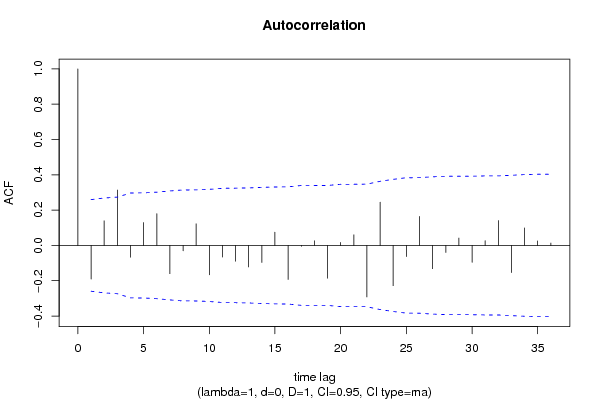
Autocorrelation Function
Time lag kACF(k)T-STATP-value
1-0.190507-1.43830.077909
20.1394011.05250.148517
30.3138262.36930.010615
4-0.066946-0.50540.307603
50.1294420.97730.166283
60.1795861.35580.090248
7-0.160435-1.21130.115398
8-0.03048-0.23010.409412
90.12260.92560.179276
10-0.166213-1.25490.107321
11-0.06569-0.49590.310919
12-0.088956-0.67160.252274
13-0.121927-0.92050.180589
14-0.096737-0.73030.234085
150.0751190.56710.286425
16-0.19289-1.45630.0754
17-0.00519-0.03920.484441
180.0259940.19620.422557
19-0.185592-1.40120.08329
200.0167240.12630.449983
210.0602210.45470.325541
22-0.291921-2.2040.015791
230.2450721.85030.034731
24-0.228021-1.72150.04529
25-0.063349-0.47830.317142
260.1644741.24180.109707
27-0.131571-0.99330.162372
28-0.039885-0.30110.382208
290.041510.31340.377562
30-0.095469-0.72080.236996
310.0268560.20280.420024
320.1406451.06180.146392
33-0.153747-1.16080.125287
340.0991490.74860.228601
350.0256160.19340.423667
360.0131490.09930.460634

\begin{tabular}{lllllllll}
\hline
Autocorrelation Function \tabularnewline
Time lag k & ACF(k) & T-STAT & P-value \tabularnewline
1 & -0.190507 & -1.4383 & 0.077909 \tabularnewline
2 & 0.139401 & 1.0525 & 0.148517 \tabularnewline
3 & 0.313826 & 2.3693 & 0.010615 \tabularnewline
4 & -0.066946 & -0.5054 & 0.307603 \tabularnewline
5 & 0.129442 & 0.9773 & 0.166283 \tabularnewline
6 & 0.179586 & 1.3558 & 0.090248 \tabularnewline
7 & -0.160435 & -1.2113 & 0.115398 \tabularnewline
8 & -0.03048 & -0.2301 & 0.409412 \tabularnewline
9 & 0.1226 & 0.9256 & 0.179276 \tabularnewline
10 & -0.166213 & -1.2549 & 0.107321 \tabularnewline
11 & -0.06569 & -0.4959 & 0.310919 \tabularnewline
12 & -0.088956 & -0.6716 & 0.252274 \tabularnewline
13 & -0.121927 & -0.9205 & 0.180589 \tabularnewline
14 & -0.096737 & -0.7303 & 0.234085 \tabularnewline
15 & 0.075119 & 0.5671 & 0.286425 \tabularnewline
16 & -0.19289 & -1.4563 & 0.0754 \tabularnewline
17 & -0.00519 & -0.0392 & 0.484441 \tabularnewline
18 & 0.025994 & 0.1962 & 0.422557 \tabularnewline
19 & -0.185592 & -1.4012 & 0.08329 \tabularnewline
20 & 0.016724 & 0.1263 & 0.449983 \tabularnewline
21 & 0.060221 & 0.4547 & 0.325541 \tabularnewline
22 & -0.291921 & -2.204 & 0.015791 \tabularnewline
23 & 0.245072 & 1.8503 & 0.034731 \tabularnewline
24 & -0.228021 & -1.7215 & 0.04529 \tabularnewline
25 & -0.063349 & -0.4783 & 0.317142 \tabularnewline
26 & 0.164474 & 1.2418 & 0.109707 \tabularnewline
27 & -0.131571 & -0.9933 & 0.162372 \tabularnewline
28 & -0.039885 & -0.3011 & 0.382208 \tabularnewline
29 & 0.04151 & 0.3134 & 0.377562 \tabularnewline
30 & -0.095469 & -0.7208 & 0.236996 \tabularnewline
31 & 0.026856 & 0.2028 & 0.420024 \tabularnewline
32 & 0.140645 & 1.0618 & 0.146392 \tabularnewline
33 & -0.153747 & -1.1608 & 0.125287 \tabularnewline
34 & 0.099149 & 0.7486 & 0.228601 \tabularnewline
35 & 0.025616 & 0.1934 & 0.423667 \tabularnewline
36 & 0.013149 & 0.0993 & 0.460634 \tabularnewline
\hline
\end{tabular}
%Source: https://freestatistics.org/blog/index.php?pk=68947&T=1

[TABLE]
[ROW][C]Autocorrelation Function[/C][/ROW]
[ROW][C]Time lag k[/C][C]ACF(k)[/C][C]T-STAT[/C][C]P-value[/C][/ROW]
[ROW][C]1[/C][C]-0.190507[/C][C]-1.4383[/C][C]0.077909[/C][/ROW]
[ROW][C]2[/C][C]0.139401[/C][C]1.0525[/C][C]0.148517[/C][/ROW]
[ROW][C]3[/C][C]0.313826[/C][C]2.3693[/C][C]0.010615[/C][/ROW]
[ROW][C]4[/C][C]-0.066946[/C][C]-0.5054[/C][C]0.307603[/C][/ROW]
[ROW][C]5[/C][C]0.129442[/C][C]0.9773[/C][C]0.166283[/C][/ROW]
[ROW][C]6[/C][C]0.179586[/C][C]1.3558[/C][C]0.090248[/C][/ROW]
[ROW][C]7[/C][C]-0.160435[/C][C]-1.2113[/C][C]0.115398[/C][/ROW]
[ROW][C]8[/C][C]-0.03048[/C][C]-0.2301[/C][C]0.409412[/C][/ROW]
[ROW][C]9[/C][C]0.1226[/C][C]0.9256[/C][C]0.179276[/C][/ROW]
[ROW][C]10[/C][C]-0.166213[/C][C]-1.2549[/C][C]0.107321[/C][/ROW]
[ROW][C]11[/C][C]-0.06569[/C][C]-0.4959[/C][C]0.310919[/C][/ROW]
[ROW][C]12[/C][C]-0.088956[/C][C]-0.6716[/C][C]0.252274[/C][/ROW]
[ROW][C]13[/C][C]-0.121927[/C][C]-0.9205[/C][C]0.180589[/C][/ROW]
[ROW][C]14[/C][C]-0.096737[/C][C]-0.7303[/C][C]0.234085[/C][/ROW]
[ROW][C]15[/C][C]0.075119[/C][C]0.5671[/C][C]0.286425[/C][/ROW]
[ROW][C]16[/C][C]-0.19289[/C][C]-1.4563[/C][C]0.0754[/C][/ROW]
[ROW][C]17[/C][C]-0.00519[/C][C]-0.0392[/C][C]0.484441[/C][/ROW]
[ROW][C]18[/C][C]0.025994[/C][C]0.1962[/C][C]0.422557[/C][/ROW]
[ROW][C]19[/C][C]-0.185592[/C][C]-1.4012[/C][C]0.08329[/C][/ROW]
[ROW][C]20[/C][C]0.016724[/C][C]0.1263[/C][C]0.449983[/C][/ROW]
[ROW][C]21[/C][C]0.060221[/C][C]0.4547[/C][C]0.325541[/C][/ROW]
[ROW][C]22[/C][C]-0.291921[/C][C]-2.204[/C][C]0.015791[/C][/ROW]
[ROW][C]23[/C][C]0.245072[/C][C]1.8503[/C][C]0.034731[/C][/ROW]
[ROW][C]24[/C][C]-0.228021[/C][C]-1.7215[/C][C]0.04529[/C][/ROW]
[ROW][C]25[/C][C]-0.063349[/C][C]-0.4783[/C][C]0.317142[/C][/ROW]
[ROW][C]26[/C][C]0.164474[/C][C]1.2418[/C][C]0.109707[/C][/ROW]
[ROW][C]27[/C][C]-0.131571[/C][C]-0.9933[/C][C]0.162372[/C][/ROW]
[ROW][C]28[/C][C]-0.039885[/C][C]-0.3011[/C][C]0.382208[/C][/ROW]
[ROW][C]29[/C][C]0.04151[/C][C]0.3134[/C][C]0.377562[/C][/ROW]
[ROW][C]30[/C][C]-0.095469[/C][C]-0.7208[/C][C]0.236996[/C][/ROW]
[ROW][C]31[/C][C]0.026856[/C][C]0.2028[/C][C]0.420024[/C][/ROW]
[ROW][C]32[/C][C]0.140645[/C][C]1.0618[/C][C]0.146392[/C][/ROW]
[ROW][C]33[/C][C]-0.153747[/C][C]-1.1608[/C][C]0.125287[/C][/ROW]
[ROW][C]34[/C][C]0.099149[/C][C]0.7486[/C][C]0.228601[/C][/ROW]
[ROW][C]35[/C][C]0.025616[/C][C]0.1934[/C][C]0.423667[/C][/ROW]
[ROW][C]36[/C][C]0.013149[/C][C]0.0993[/C][C]0.460634[/C][/ROW]
[/TABLE]
Source: https://freestatistics.org/blog/index.php?pk=68947&T=1

Globally Unique Identifier (entire table): ba.freestatistics.org/blog/index.php?pk=68947&T=1

As an alternative you can also use a QR Code:  

The GUIDs for individual cells are displayed in the table below:

Autocorrelation Function
Time lag kACF(k)T-STATP-value
1-0.190507-1.43830.077909
20.1394011.05250.148517
30.3138262.36930.010615
4-0.066946-0.50540.307603
50.1294420.97730.166283
60.1795861.35580.090248
7-0.160435-1.21130.115398
8-0.03048-0.23010.409412
90.12260.92560.179276
10-0.166213-1.25490.107321
11-0.06569-0.49590.310919
12-0.088956-0.67160.252274
13-0.121927-0.92050.180589
14-0.096737-0.73030.234085
150.0751190.56710.286425
16-0.19289-1.45630.0754
17-0.00519-0.03920.484441
180.0259940.19620.422557
19-0.185592-1.40120.08329
200.0167240.12630.449983
210.0602210.45470.325541
22-0.291921-2.2040.015791
230.2450721.85030.034731
24-0.228021-1.72150.04529
25-0.063349-0.47830.317142
260.1644741.24180.109707
27-0.131571-0.99330.162372
28-0.039885-0.30110.382208
290.041510.31340.377562
30-0.095469-0.72080.236996
310.0268560.20280.420024
320.1406451.06180.146392
33-0.153747-1.16080.125287
340.0991490.74860.228601
350.0256160.19340.423667
360.0131490.09930.460634


Partial Autocorrelation Function
Time lag kPACF(k)T-STATP-value
1-0.190507-1.43830.077909
20.1069910.80780.211293
30.3757032.83650.003152
40.0572080.43190.333717
50.0247750.1870.426143
60.1170960.88410.190191
7-0.140756-1.06270.146203
8-0.244444-1.84550.03508
90.0208040.15710.437874
10-0.007603-0.05740.477212
11-0.114168-0.8620.196163
12-0.176609-1.33340.093858
13-0.012774-0.09640.461754
14-0.039617-0.29910.382975
150.135781.02510.154819
16-0.003239-0.02450.490289
170.0367720.27760.391155
180.0090640.06840.47284
19-0.168914-1.27530.103693
20-0.143675-1.08470.141306
210.0801760.60530.273687
22-0.214375-1.61850.055538
230.1397661.05520.14789
24-0.227215-1.71540.045848
25-0.02219-0.16750.433774
260.0862020.65080.258893
270.0978870.7390.231461
28-0.034874-0.26330.396638
29-0.079284-0.59860.275911
30-0.13488-1.01830.156414
310.0177560.13410.446917
320.0354760.26780.394894
33-0.026802-0.20230.420182
340.0237610.17940.429132
35-0.03397-0.25650.399257
36-0.088745-0.670.252779

\begin{tabular}{lllllllll}
\hline
Partial Autocorrelation Function \tabularnewline
Time lag k & PACF(k) & T-STAT & P-value \tabularnewline
1 & -0.190507 & -1.4383 & 0.077909 \tabularnewline
2 & 0.106991 & 0.8078 & 0.211293 \tabularnewline
3 & 0.375703 & 2.8365 & 0.003152 \tabularnewline
4 & 0.057208 & 0.4319 & 0.333717 \tabularnewline
5 & 0.024775 & 0.187 & 0.426143 \tabularnewline
6 & 0.117096 & 0.8841 & 0.190191 \tabularnewline
7 & -0.140756 & -1.0627 & 0.146203 \tabularnewline
8 & -0.244444 & -1.8455 & 0.03508 \tabularnewline
9 & 0.020804 & 0.1571 & 0.437874 \tabularnewline
10 & -0.007603 & -0.0574 & 0.477212 \tabularnewline
11 & -0.114168 & -0.862 & 0.196163 \tabularnewline
12 & -0.176609 & -1.3334 & 0.093858 \tabularnewline
13 & -0.012774 & -0.0964 & 0.461754 \tabularnewline
14 & -0.039617 & -0.2991 & 0.382975 \tabularnewline
15 & 0.13578 & 1.0251 & 0.154819 \tabularnewline
16 & -0.003239 & -0.0245 & 0.490289 \tabularnewline
17 & 0.036772 & 0.2776 & 0.391155 \tabularnewline
18 & 0.009064 & 0.0684 & 0.47284 \tabularnewline
19 & -0.168914 & -1.2753 & 0.103693 \tabularnewline
20 & -0.143675 & -1.0847 & 0.141306 \tabularnewline
21 & 0.080176 & 0.6053 & 0.273687 \tabularnewline
22 & -0.214375 & -1.6185 & 0.055538 \tabularnewline
23 & 0.139766 & 1.0552 & 0.14789 \tabularnewline
24 & -0.227215 & -1.7154 & 0.045848 \tabularnewline
25 & -0.02219 & -0.1675 & 0.433774 \tabularnewline
26 & 0.086202 & 0.6508 & 0.258893 \tabularnewline
27 & 0.097887 & 0.739 & 0.231461 \tabularnewline
28 & -0.034874 & -0.2633 & 0.396638 \tabularnewline
29 & -0.079284 & -0.5986 & 0.275911 \tabularnewline
30 & -0.13488 & -1.0183 & 0.156414 \tabularnewline
31 & 0.017756 & 0.1341 & 0.446917 \tabularnewline
32 & 0.035476 & 0.2678 & 0.394894 \tabularnewline
33 & -0.026802 & -0.2023 & 0.420182 \tabularnewline
34 & 0.023761 & 0.1794 & 0.429132 \tabularnewline
35 & -0.03397 & -0.2565 & 0.399257 \tabularnewline
36 & -0.088745 & -0.67 & 0.252779 \tabularnewline
\hline
\end{tabular}
%Source: https://freestatistics.org/blog/index.php?pk=68947&T=2

[TABLE]
[ROW][C]Partial Autocorrelation Function[/C][/ROW]
[ROW][C]Time lag k[/C][C]PACF(k)[/C][C]T-STAT[/C][C]P-value[/C][/ROW]
[ROW][C]1[/C][C]-0.190507[/C][C]-1.4383[/C][C]0.077909[/C][/ROW]
[ROW][C]2[/C][C]0.106991[/C][C]0.8078[/C][C]0.211293[/C][/ROW]
[ROW][C]3[/C][C]0.375703[/C][C]2.8365[/C][C]0.003152[/C][/ROW]
[ROW][C]4[/C][C]0.057208[/C][C]0.4319[/C][C]0.333717[/C][/ROW]
[ROW][C]5[/C][C]0.024775[/C][C]0.187[/C][C]0.426143[/C][/ROW]
[ROW][C]6[/C][C]0.117096[/C][C]0.8841[/C][C]0.190191[/C][/ROW]
[ROW][C]7[/C][C]-0.140756[/C][C]-1.0627[/C][C]0.146203[/C][/ROW]
[ROW][C]8[/C][C]-0.244444[/C][C]-1.8455[/C][C]0.03508[/C][/ROW]
[ROW][C]9[/C][C]0.020804[/C][C]0.1571[/C][C]0.437874[/C][/ROW]
[ROW][C]10[/C][C]-0.007603[/C][C]-0.0574[/C][C]0.477212[/C][/ROW]
[ROW][C]11[/C][C]-0.114168[/C][C]-0.862[/C][C]0.196163[/C][/ROW]
[ROW][C]12[/C][C]-0.176609[/C][C]-1.3334[/C][C]0.093858[/C][/ROW]
[ROW][C]13[/C][C]-0.012774[/C][C]-0.0964[/C][C]0.461754[/C][/ROW]
[ROW][C]14[/C][C]-0.039617[/C][C]-0.2991[/C][C]0.382975[/C][/ROW]
[ROW][C]15[/C][C]0.13578[/C][C]1.0251[/C][C]0.154819[/C][/ROW]
[ROW][C]16[/C][C]-0.003239[/C][C]-0.0245[/C][C]0.490289[/C][/ROW]
[ROW][C]17[/C][C]0.036772[/C][C]0.2776[/C][C]0.391155[/C][/ROW]
[ROW][C]18[/C][C]0.009064[/C][C]0.0684[/C][C]0.47284[/C][/ROW]
[ROW][C]19[/C][C]-0.168914[/C][C]-1.2753[/C][C]0.103693[/C][/ROW]
[ROW][C]20[/C][C]-0.143675[/C][C]-1.0847[/C][C]0.141306[/C][/ROW]
[ROW][C]21[/C][C]0.080176[/C][C]0.6053[/C][C]0.273687[/C][/ROW]
[ROW][C]22[/C][C]-0.214375[/C][C]-1.6185[/C][C]0.055538[/C][/ROW]
[ROW][C]23[/C][C]0.139766[/C][C]1.0552[/C][C]0.14789[/C][/ROW]
[ROW][C]24[/C][C]-0.227215[/C][C]-1.7154[/C][C]0.045848[/C][/ROW]
[ROW][C]25[/C][C]-0.02219[/C][C]-0.1675[/C][C]0.433774[/C][/ROW]
[ROW][C]26[/C][C]0.086202[/C][C]0.6508[/C][C]0.258893[/C][/ROW]
[ROW][C]27[/C][C]0.097887[/C][C]0.739[/C][C]0.231461[/C][/ROW]
[ROW][C]28[/C][C]-0.034874[/C][C]-0.2633[/C][C]0.396638[/C][/ROW]
[ROW][C]29[/C][C]-0.079284[/C][C]-0.5986[/C][C]0.275911[/C][/ROW]
[ROW][C]30[/C][C]-0.13488[/C][C]-1.0183[/C][C]0.156414[/C][/ROW]
[ROW][C]31[/C][C]0.017756[/C][C]0.1341[/C][C]0.446917[/C][/ROW]
[ROW][C]32[/C][C]0.035476[/C][C]0.2678[/C][C]0.394894[/C][/ROW]
[ROW][C]33[/C][C]-0.026802[/C][C]-0.2023[/C][C]0.420182[/C][/ROW]
[ROW][C]34[/C][C]0.023761[/C][C]0.1794[/C][C]0.429132[/C][/ROW]
[ROW][C]35[/C][C]-0.03397[/C][C]-0.2565[/C][C]0.399257[/C][/ROW]
[ROW][C]36[/C][C]-0.088745[/C][C]-0.67[/C][C]0.252779[/C][/ROW]
[/TABLE]
Source: https://freestatistics.org/blog/index.php?pk=68947&T=2

Globally Unique Identifier (entire table): ba.freestatistics.org/blog/index.php?pk=68947&T=2

As an alternative you can also use a QR Code:  

The GUIDs for individual cells are displayed in the table below:

Partial Autocorrelation Function
Time lag kPACF(k)T-STATP-value
1-0.190507-1.43830.077909
20.1069910.80780.211293
30.3757032.83650.003152
40.0572080.43190.333717
50.0247750.1870.426143
60.1170960.88410.190191
7-0.140756-1.06270.146203
8-0.244444-1.84550.03508
90.0208040.15710.437874
10-0.007603-0.05740.477212
11-0.114168-0.8620.196163
12-0.176609-1.33340.093858
13-0.012774-0.09640.461754
14-0.039617-0.29910.382975
150.135781.02510.154819
16-0.003239-0.02450.490289
170.0367720.27760.391155
180.0090640.06840.47284
19-0.168914-1.27530.103693
20-0.143675-1.08470.141306
210.0801760.60530.273687
22-0.214375-1.61850.055538
230.1397661.05520.14789
24-0.227215-1.71540.045848
25-0.02219-0.16750.433774
260.0862020.65080.258893
270.0978870.7390.231461
28-0.034874-0.26330.396638
29-0.079284-0.59860.275911
30-0.13488-1.01830.156414
310.0177560.13410.446917
320.0354760.26780.394894
33-0.026802-0.20230.420182
340.0237610.17940.429132
35-0.03397-0.25650.399257
36-0.088745-0.670.252779


Parameters (Session):
Parameters (R input):
par1 = 36 ; par2 = 1 ; par3 = 0 ; par4 = 1 ; par5 = 12 ; par6 = MA ; par7 = 0.95 ;
R code (references can be found in the software module):
if (par1 == 'Default') {
par1 = 10*log10(length(x))
} else {
par1 <- as.numeric(par1)
}
par2 <- as.numeric(par2)
par3 <- as.numeric(par3)
par4 <- as.numeric(par4)
par5 <- as.numeric(par5)
if (par6 == 'White Noise') par6 <- 'white' else par6 <- 'ma'
par7 <- as.numeric(par7)
if (par2 == 0) {
x <- log(x)
} else {
x <- (x ^ par2 - 1) / par2
}
if (par3 > 0) x <- diff(x,lag=1,difference=par3)
if (par4 > 0) x <- diff(x,lag=par5,difference=par4)
bitmap(file='pic1.png')
racf <- acf(x, par1, main='Autocorrelation', xlab='time lag', ylab='ACF', ci.type=par6, ci=par7, sub=paste('(lambda=',par2,', d=',par3,', D=',par4,', CI=', par7, ', CI type=',par6,')',sep=''))
dev.off()
bitmap(file='pic2.png')
rpacf <- pacf(x,par1,main='Partial Autocorrelation',xlab='lags',ylab='PACF')
dev.off()
(myacf <- c(racf$acf))
(mypacf <- c(rpacf$acf))
lengthx <- length(x)
sqrtn <- sqrt(lengthx)
load(file='createtable')
a<-table.start()
a<-table.row.start(a)
a<-table.element(a,'Autocorrelation Function',4,TRUE)
a<-table.row.end(a)
a<-table.row.start(a)
a<-table.element(a,'Time lag k',header=TRUE)
a<-table.element(a,hyperlink('basics.htm','ACF(k)','click here for more information about the Autocorrelation Function'),header=TRUE)
a<-table.element(a,'T-STAT',header=TRUE)
a<-table.element(a,'P-value',header=TRUE)
a<-table.row.end(a)
for (i in 2:(par1+1)) {
a<-table.row.start(a)
a<-table.element(a,i-1,header=TRUE)
a<-table.element(a,round(myacf[i],6))
mytstat <- myacf[i]*sqrtn
a<-table.element(a,round(mytstat,4))
a<-table.element(a,round(1-pt(abs(mytstat),lengthx),6))
a<-table.row.end(a)
}
a<-table.end(a)
table.save(a,file='mytable.tab')
a<-table.start()
a<-table.row.start(a)
a<-table.element(a,'Partial Autocorrelation Function',4,TRUE)
a<-table.row.end(a)
a<-table.row.start(a)
a<-table.element(a,'Time lag k',header=TRUE)
a<-table.element(a,hyperlink('basics.htm','PACF(k)','click here for more information about the Partial Autocorrelation Function'),header=TRUE)
a<-table.element(a,'T-STAT',header=TRUE)
a<-table.element(a,'P-value',header=TRUE)
a<-table.row.end(a)
for (i in 1:par1) {
a<-table.row.start(a)
a<-table.element(a,i,header=TRUE)
a<-table.element(a,round(mypacf[i],6))
mytstat <- mypacf[i]*sqrtn
a<-table.element(a,round(mytstat,4))
a<-table.element(a,round(1-pt(abs(mytstat),lengthx),6))
a<-table.row.end(a)
}
a<-table.end(a)
table.save(a,file='mytable1.tab')