Free Statistics

of Irreproducible Research!

Author's title

Author*The author of this computation has been verified*
R Software Modulerwasp_autocorrelation.wasp
Title produced by software(Partial) Autocorrelation Function
Date of computationThu, 17 Dec 2009 08:28:07 -0700
Cite this page as followsStatistical Computations at FreeStatistics.org, Office for Research Development and Education, URL https://freestatistics.org/blog/index.php?v=date/2009/Dec/17/t1261063733ayb1v7kx42y8cgm.htm/, Retrieved Tue, 30 Apr 2024 05:27:58 +0000
Statistical Computations at FreeStatistics.org, Office for Research Development and Education, URL https://freestatistics.org/blog/index.php?pk=68948, Retrieved Tue, 30 Apr 2024 05:27:58 +0000
QR Codes:

Original text written by user:
IsPrivate?No (this computation is public)
User-defined keywords
Estimated Impact85
Family? (F = Feedback message, R = changed R code, M = changed R Module, P = changed Parameters, D = changed Data)
-       [(Partial) Autocorrelation Function] [] [2009-12-17 15:28:07] [71596e6a53ccce532e52aaf6113616ef] [Current]
Feedback Forum

Post a new message
Dataseries X:
97.4
97
105.4
102.7
98.1
104.5
87.4
89.9
109.8
111.7
98.6
96.9
95.1
97
112.7
102.9
97.4
111.4
87.4
96.8
114.1
110.3
103.9
101.6
94.6
95.9
104.7
102.8
98.1
113.9
80.9
95.7
113.2
105.9
108.8
102.3
99
100.7
115.5
100.7
109.9
114.6
85.4
100.5
114.8
116.5
112.9
102
106
105.3
118.8
106.1
109.3
117.2
92.5
104.2
112.5
122.4
113.3
100
110.7
112.8
109.8
117.3
109.1
115.9
96
99.8
116.8


Summary of computational transaction
Raw Inputview raw input (R code)
Raw Outputview raw output of R engine
Computing time1 seconds
R Server'Gwilym Jenkins' @ 72.249.127.135

\begin{tabular}{lllllllll}
\hline
Summary of computational transaction \tabularnewline
Raw Input & view raw input (R code)  \tabularnewline
Raw Output & view raw output of R engine  \tabularnewline
Computing time & 1 seconds \tabularnewline
R Server & 'Gwilym Jenkins' @ 72.249.127.135 \tabularnewline
\hline
\end{tabular}
%Source: https://freestatistics.org/blog/index.php?pk=68948&T=0

[TABLE]
[ROW][C]Summary of computational transaction[/C][/ROW]
[ROW][C]Raw Input[/C][C]view raw input (R code) [/C][/ROW]
[ROW][C]Raw Output[/C][C]view raw output of R engine [/C][/ROW]
[ROW][C]Computing time[/C][C]1 seconds[/C][/ROW]
[ROW][C]R Server[/C][C]'Gwilym Jenkins' @ 72.249.127.135[/C][/ROW]
[/TABLE]
Source: https://freestatistics.org/blog/index.php?pk=68948&T=0

Globally Unique Identifier (entire table): ba.freestatistics.org/blog/index.php?pk=68948&T=0

As an alternative you can also use a QR Code:  

The GUIDs for individual cells are displayed in the table below:

Summary of computational transaction
Raw Inputview raw input (R code)
Raw Outputview raw output of R engine
Computing time1 seconds
R Server'Gwilym Jenkins' @ 72.249.127.135


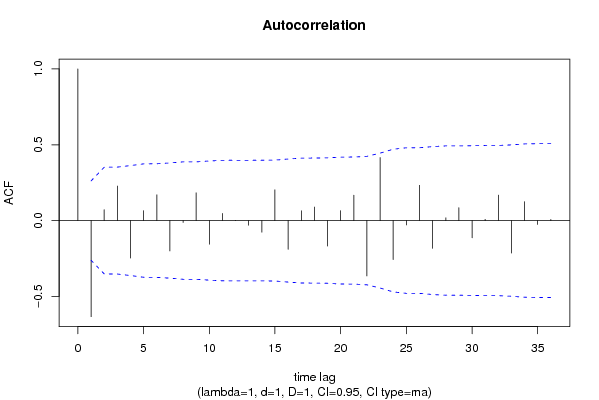
Autocorrelation Function
Time lag kACF(k)T-STATP-value
1-0.633771-4.74277e-06
20.0719490.53840.296213
30.2274341.7020.047155
4-0.247039-1.84870.034894
50.0654410.48970.313125
60.1700841.27280.104175
7-0.200743-1.50220.069329
8-0.011968-0.08960.464479
90.1831171.37030.088027
10-0.155708-1.16520.124437
110.0471030.35250.362897
120.0019380.01450.49424
13-0.03058-0.22880.409913
14-0.076906-0.57550.283626
150.2027771.51740.06739
16-0.189396-1.41730.080966
170.0644370.48220.315771
180.0892010.66750.253591
19-0.167913-1.25650.107068
200.0653440.4890.313379
210.1673361.25220.107846
22-0.365085-2.7320.004202
230.4156623.11050.001468
24-0.257262-1.92520.029646
25-0.028726-0.2150.415289
260.2323251.73860.043804
27-0.182915-1.36880.088262
280.0184890.13840.445227
290.0850620.63650.263508
30-0.114112-0.85390.198389
310.0086180.06450.474405
320.1677841.25560.107241
33-0.214035-1.60170.057425
340.1241940.92940.17834
35-0.025906-0.19390.423491
360.0076630.05730.477237

\begin{tabular}{lllllllll}
\hline
Autocorrelation Function \tabularnewline
Time lag k & ACF(k) & T-STAT & P-value \tabularnewline
1 & -0.633771 & -4.7427 & 7e-06 \tabularnewline
2 & 0.071949 & 0.5384 & 0.296213 \tabularnewline
3 & 0.227434 & 1.702 & 0.047155 \tabularnewline
4 & -0.247039 & -1.8487 & 0.034894 \tabularnewline
5 & 0.065441 & 0.4897 & 0.313125 \tabularnewline
6 & 0.170084 & 1.2728 & 0.104175 \tabularnewline
7 & -0.200743 & -1.5022 & 0.069329 \tabularnewline
8 & -0.011968 & -0.0896 & 0.464479 \tabularnewline
9 & 0.183117 & 1.3703 & 0.088027 \tabularnewline
10 & -0.155708 & -1.1652 & 0.124437 \tabularnewline
11 & 0.047103 & 0.3525 & 0.362897 \tabularnewline
12 & 0.001938 & 0.0145 & 0.49424 \tabularnewline
13 & -0.03058 & -0.2288 & 0.409913 \tabularnewline
14 & -0.076906 & -0.5755 & 0.283626 \tabularnewline
15 & 0.202777 & 1.5174 & 0.06739 \tabularnewline
16 & -0.189396 & -1.4173 & 0.080966 \tabularnewline
17 & 0.064437 & 0.4822 & 0.315771 \tabularnewline
18 & 0.089201 & 0.6675 & 0.253591 \tabularnewline
19 & -0.167913 & -1.2565 & 0.107068 \tabularnewline
20 & 0.065344 & 0.489 & 0.313379 \tabularnewline
21 & 0.167336 & 1.2522 & 0.107846 \tabularnewline
22 & -0.365085 & -2.732 & 0.004202 \tabularnewline
23 & 0.415662 & 3.1105 & 0.001468 \tabularnewline
24 & -0.257262 & -1.9252 & 0.029646 \tabularnewline
25 & -0.028726 & -0.215 & 0.415289 \tabularnewline
26 & 0.232325 & 1.7386 & 0.043804 \tabularnewline
27 & -0.182915 & -1.3688 & 0.088262 \tabularnewline
28 & 0.018489 & 0.1384 & 0.445227 \tabularnewline
29 & 0.085062 & 0.6365 & 0.263508 \tabularnewline
30 & -0.114112 & -0.8539 & 0.198389 \tabularnewline
31 & 0.008618 & 0.0645 & 0.474405 \tabularnewline
32 & 0.167784 & 1.2556 & 0.107241 \tabularnewline
33 & -0.214035 & -1.6017 & 0.057425 \tabularnewline
34 & 0.124194 & 0.9294 & 0.17834 \tabularnewline
35 & -0.025906 & -0.1939 & 0.423491 \tabularnewline
36 & 0.007663 & 0.0573 & 0.477237 \tabularnewline
\hline
\end{tabular}
%Source: https://freestatistics.org/blog/index.php?pk=68948&T=1

[TABLE]
[ROW][C]Autocorrelation Function[/C][/ROW]
[ROW][C]Time lag k[/C][C]ACF(k)[/C][C]T-STAT[/C][C]P-value[/C][/ROW]
[ROW][C]1[/C][C]-0.633771[/C][C]-4.7427[/C][C]7e-06[/C][/ROW]
[ROW][C]2[/C][C]0.071949[/C][C]0.5384[/C][C]0.296213[/C][/ROW]
[ROW][C]3[/C][C]0.227434[/C][C]1.702[/C][C]0.047155[/C][/ROW]
[ROW][C]4[/C][C]-0.247039[/C][C]-1.8487[/C][C]0.034894[/C][/ROW]
[ROW][C]5[/C][C]0.065441[/C][C]0.4897[/C][C]0.313125[/C][/ROW]
[ROW][C]6[/C][C]0.170084[/C][C]1.2728[/C][C]0.104175[/C][/ROW]
[ROW][C]7[/C][C]-0.200743[/C][C]-1.5022[/C][C]0.069329[/C][/ROW]
[ROW][C]8[/C][C]-0.011968[/C][C]-0.0896[/C][C]0.464479[/C][/ROW]
[ROW][C]9[/C][C]0.183117[/C][C]1.3703[/C][C]0.088027[/C][/ROW]
[ROW][C]10[/C][C]-0.155708[/C][C]-1.1652[/C][C]0.124437[/C][/ROW]
[ROW][C]11[/C][C]0.047103[/C][C]0.3525[/C][C]0.362897[/C][/ROW]
[ROW][C]12[/C][C]0.001938[/C][C]0.0145[/C][C]0.49424[/C][/ROW]
[ROW][C]13[/C][C]-0.03058[/C][C]-0.2288[/C][C]0.409913[/C][/ROW]
[ROW][C]14[/C][C]-0.076906[/C][C]-0.5755[/C][C]0.283626[/C][/ROW]
[ROW][C]15[/C][C]0.202777[/C][C]1.5174[/C][C]0.06739[/C][/ROW]
[ROW][C]16[/C][C]-0.189396[/C][C]-1.4173[/C][C]0.080966[/C][/ROW]
[ROW][C]17[/C][C]0.064437[/C][C]0.4822[/C][C]0.315771[/C][/ROW]
[ROW][C]18[/C][C]0.089201[/C][C]0.6675[/C][C]0.253591[/C][/ROW]
[ROW][C]19[/C][C]-0.167913[/C][C]-1.2565[/C][C]0.107068[/C][/ROW]
[ROW][C]20[/C][C]0.065344[/C][C]0.489[/C][C]0.313379[/C][/ROW]
[ROW][C]21[/C][C]0.167336[/C][C]1.2522[/C][C]0.107846[/C][/ROW]
[ROW][C]22[/C][C]-0.365085[/C][C]-2.732[/C][C]0.004202[/C][/ROW]
[ROW][C]23[/C][C]0.415662[/C][C]3.1105[/C][C]0.001468[/C][/ROW]
[ROW][C]24[/C][C]-0.257262[/C][C]-1.9252[/C][C]0.029646[/C][/ROW]
[ROW][C]25[/C][C]-0.028726[/C][C]-0.215[/C][C]0.415289[/C][/ROW]
[ROW][C]26[/C][C]0.232325[/C][C]1.7386[/C][C]0.043804[/C][/ROW]
[ROW][C]27[/C][C]-0.182915[/C][C]-1.3688[/C][C]0.088262[/C][/ROW]
[ROW][C]28[/C][C]0.018489[/C][C]0.1384[/C][C]0.445227[/C][/ROW]
[ROW][C]29[/C][C]0.085062[/C][C]0.6365[/C][C]0.263508[/C][/ROW]
[ROW][C]30[/C][C]-0.114112[/C][C]-0.8539[/C][C]0.198389[/C][/ROW]
[ROW][C]31[/C][C]0.008618[/C][C]0.0645[/C][C]0.474405[/C][/ROW]
[ROW][C]32[/C][C]0.167784[/C][C]1.2556[/C][C]0.107241[/C][/ROW]
[ROW][C]33[/C][C]-0.214035[/C][C]-1.6017[/C][C]0.057425[/C][/ROW]
[ROW][C]34[/C][C]0.124194[/C][C]0.9294[/C][C]0.17834[/C][/ROW]
[ROW][C]35[/C][C]-0.025906[/C][C]-0.1939[/C][C]0.423491[/C][/ROW]
[ROW][C]36[/C][C]0.007663[/C][C]0.0573[/C][C]0.477237[/C][/ROW]
[/TABLE]
Source: https://freestatistics.org/blog/index.php?pk=68948&T=1

Globally Unique Identifier (entire table): ba.freestatistics.org/blog/index.php?pk=68948&T=1

As an alternative you can also use a QR Code:  

The GUIDs for individual cells are displayed in the table below:

Autocorrelation Function
Time lag kACF(k)T-STATP-value
1-0.633771-4.74277e-06
20.0719490.53840.296213
30.2274341.7020.047155
4-0.247039-1.84870.034894
50.0654410.48970.313125
60.1700841.27280.104175
7-0.200743-1.50220.069329
8-0.011968-0.08960.464479
90.1831171.37030.088027
10-0.155708-1.16520.124437
110.0471030.35250.362897
120.0019380.01450.49424
13-0.03058-0.22880.409913
14-0.076906-0.57550.283626
150.2027771.51740.06739
16-0.189396-1.41730.080966
170.0644370.48220.315771
180.0892010.66750.253591
19-0.167913-1.25650.107068
200.0653440.4890.313379
210.1673361.25220.107846
22-0.365085-2.7320.004202
230.4156623.11050.001468
24-0.257262-1.92520.029646
25-0.028726-0.2150.415289
260.2323251.73860.043804
27-0.182915-1.36880.088262
280.0184890.13840.445227
290.0850620.63650.263508
30-0.114112-0.85390.198389
310.0086180.06450.474405
320.1677841.25560.107241
33-0.214035-1.60170.057425
340.1241940.92940.17834
35-0.025906-0.19390.423491
360.0076630.05730.477237


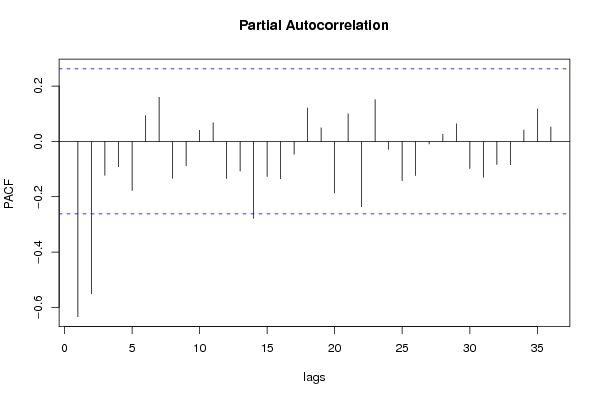
Partial Autocorrelation Function
Time lag kPACF(k)T-STATP-value
1-0.633771-4.74277e-06
2-0.551058-4.12376.2e-05
3-0.12261-0.91750.1814
4-0.091351-0.68360.248522
5-0.177748-1.33010.094431
60.0934060.6990.243726
70.1599751.19710.118146
8-0.133539-0.99930.16097
9-0.088544-0.66260.255151
100.0402520.30120.382182
110.0675530.50550.307588
12-0.134306-1.00510.159598
13-0.107125-0.80160.213073
14-0.278369-2.08310.020909
15-0.126688-0.9480.173589
16-0.135032-1.01050.158305
17-0.046543-0.34830.364463
180.1203420.90060.18584
190.0488550.36560.358021
20-0.187035-1.39960.083568
210.0994950.74460.229828
22-0.236124-1.7670.04134
230.1510161.13010.131625
24-0.028859-0.2160.414902
25-0.142616-1.06720.145221
26-0.123644-0.92530.179398
27-0.009061-0.06780.47309
280.0258720.19360.423592
290.0636970.47670.317729
30-0.098319-0.73580.232475
31-0.130005-0.97290.167401
32-0.083453-0.62450.267417
33-0.084476-0.63220.264928
340.0410250.3070.37999
350.1171250.87650.192256
360.0522510.3910.348637

\begin{tabular}{lllllllll}
\hline
Partial Autocorrelation Function \tabularnewline
Time lag k & PACF(k) & T-STAT & P-value \tabularnewline
1 & -0.633771 & -4.7427 & 7e-06 \tabularnewline
2 & -0.551058 & -4.1237 & 6.2e-05 \tabularnewline
3 & -0.12261 & -0.9175 & 0.1814 \tabularnewline
4 & -0.091351 & -0.6836 & 0.248522 \tabularnewline
5 & -0.177748 & -1.3301 & 0.094431 \tabularnewline
6 & 0.093406 & 0.699 & 0.243726 \tabularnewline
7 & 0.159975 & 1.1971 & 0.118146 \tabularnewline
8 & -0.133539 & -0.9993 & 0.16097 \tabularnewline
9 & -0.088544 & -0.6626 & 0.255151 \tabularnewline
10 & 0.040252 & 0.3012 & 0.382182 \tabularnewline
11 & 0.067553 & 0.5055 & 0.307588 \tabularnewline
12 & -0.134306 & -1.0051 & 0.159598 \tabularnewline
13 & -0.107125 & -0.8016 & 0.213073 \tabularnewline
14 & -0.278369 & -2.0831 & 0.020909 \tabularnewline
15 & -0.126688 & -0.948 & 0.173589 \tabularnewline
16 & -0.135032 & -1.0105 & 0.158305 \tabularnewline
17 & -0.046543 & -0.3483 & 0.364463 \tabularnewline
18 & 0.120342 & 0.9006 & 0.18584 \tabularnewline
19 & 0.048855 & 0.3656 & 0.358021 \tabularnewline
20 & -0.187035 & -1.3996 & 0.083568 \tabularnewline
21 & 0.099495 & 0.7446 & 0.229828 \tabularnewline
22 & -0.236124 & -1.767 & 0.04134 \tabularnewline
23 & 0.151016 & 1.1301 & 0.131625 \tabularnewline
24 & -0.028859 & -0.216 & 0.414902 \tabularnewline
25 & -0.142616 & -1.0672 & 0.145221 \tabularnewline
26 & -0.123644 & -0.9253 & 0.179398 \tabularnewline
27 & -0.009061 & -0.0678 & 0.47309 \tabularnewline
28 & 0.025872 & 0.1936 & 0.423592 \tabularnewline
29 & 0.063697 & 0.4767 & 0.317729 \tabularnewline
30 & -0.098319 & -0.7358 & 0.232475 \tabularnewline
31 & -0.130005 & -0.9729 & 0.167401 \tabularnewline
32 & -0.083453 & -0.6245 & 0.267417 \tabularnewline
33 & -0.084476 & -0.6322 & 0.264928 \tabularnewline
34 & 0.041025 & 0.307 & 0.37999 \tabularnewline
35 & 0.117125 & 0.8765 & 0.192256 \tabularnewline
36 & 0.052251 & 0.391 & 0.348637 \tabularnewline
\hline
\end{tabular}
%Source: https://freestatistics.org/blog/index.php?pk=68948&T=2

[TABLE]
[ROW][C]Partial Autocorrelation Function[/C][/ROW]
[ROW][C]Time lag k[/C][C]PACF(k)[/C][C]T-STAT[/C][C]P-value[/C][/ROW]
[ROW][C]1[/C][C]-0.633771[/C][C]-4.7427[/C][C]7e-06[/C][/ROW]
[ROW][C]2[/C][C]-0.551058[/C][C]-4.1237[/C][C]6.2e-05[/C][/ROW]
[ROW][C]3[/C][C]-0.12261[/C][C]-0.9175[/C][C]0.1814[/C][/ROW]
[ROW][C]4[/C][C]-0.091351[/C][C]-0.6836[/C][C]0.248522[/C][/ROW]
[ROW][C]5[/C][C]-0.177748[/C][C]-1.3301[/C][C]0.094431[/C][/ROW]
[ROW][C]6[/C][C]0.093406[/C][C]0.699[/C][C]0.243726[/C][/ROW]
[ROW][C]7[/C][C]0.159975[/C][C]1.1971[/C][C]0.118146[/C][/ROW]
[ROW][C]8[/C][C]-0.133539[/C][C]-0.9993[/C][C]0.16097[/C][/ROW]
[ROW][C]9[/C][C]-0.088544[/C][C]-0.6626[/C][C]0.255151[/C][/ROW]
[ROW][C]10[/C][C]0.040252[/C][C]0.3012[/C][C]0.382182[/C][/ROW]
[ROW][C]11[/C][C]0.067553[/C][C]0.5055[/C][C]0.307588[/C][/ROW]
[ROW][C]12[/C][C]-0.134306[/C][C]-1.0051[/C][C]0.159598[/C][/ROW]
[ROW][C]13[/C][C]-0.107125[/C][C]-0.8016[/C][C]0.213073[/C][/ROW]
[ROW][C]14[/C][C]-0.278369[/C][C]-2.0831[/C][C]0.020909[/C][/ROW]
[ROW][C]15[/C][C]-0.126688[/C][C]-0.948[/C][C]0.173589[/C][/ROW]
[ROW][C]16[/C][C]-0.135032[/C][C]-1.0105[/C][C]0.158305[/C][/ROW]
[ROW][C]17[/C][C]-0.046543[/C][C]-0.3483[/C][C]0.364463[/C][/ROW]
[ROW][C]18[/C][C]0.120342[/C][C]0.9006[/C][C]0.18584[/C][/ROW]
[ROW][C]19[/C][C]0.048855[/C][C]0.3656[/C][C]0.358021[/C][/ROW]
[ROW][C]20[/C][C]-0.187035[/C][C]-1.3996[/C][C]0.083568[/C][/ROW]
[ROW][C]21[/C][C]0.099495[/C][C]0.7446[/C][C]0.229828[/C][/ROW]
[ROW][C]22[/C][C]-0.236124[/C][C]-1.767[/C][C]0.04134[/C][/ROW]
[ROW][C]23[/C][C]0.151016[/C][C]1.1301[/C][C]0.131625[/C][/ROW]
[ROW][C]24[/C][C]-0.028859[/C][C]-0.216[/C][C]0.414902[/C][/ROW]
[ROW][C]25[/C][C]-0.142616[/C][C]-1.0672[/C][C]0.145221[/C][/ROW]
[ROW][C]26[/C][C]-0.123644[/C][C]-0.9253[/C][C]0.179398[/C][/ROW]
[ROW][C]27[/C][C]-0.009061[/C][C]-0.0678[/C][C]0.47309[/C][/ROW]
[ROW][C]28[/C][C]0.025872[/C][C]0.1936[/C][C]0.423592[/C][/ROW]
[ROW][C]29[/C][C]0.063697[/C][C]0.4767[/C][C]0.317729[/C][/ROW]
[ROW][C]30[/C][C]-0.098319[/C][C]-0.7358[/C][C]0.232475[/C][/ROW]
[ROW][C]31[/C][C]-0.130005[/C][C]-0.9729[/C][C]0.167401[/C][/ROW]
[ROW][C]32[/C][C]-0.083453[/C][C]-0.6245[/C][C]0.267417[/C][/ROW]
[ROW][C]33[/C][C]-0.084476[/C][C]-0.6322[/C][C]0.264928[/C][/ROW]
[ROW][C]34[/C][C]0.041025[/C][C]0.307[/C][C]0.37999[/C][/ROW]
[ROW][C]35[/C][C]0.117125[/C][C]0.8765[/C][C]0.192256[/C][/ROW]
[ROW][C]36[/C][C]0.052251[/C][C]0.391[/C][C]0.348637[/C][/ROW]
[/TABLE]
Source: https://freestatistics.org/blog/index.php?pk=68948&T=2

Globally Unique Identifier (entire table): ba.freestatistics.org/blog/index.php?pk=68948&T=2

As an alternative you can also use a QR Code:  

The GUIDs for individual cells are displayed in the table below:

Partial Autocorrelation Function
Time lag kPACF(k)T-STATP-value
1-0.633771-4.74277e-06
2-0.551058-4.12376.2e-05
3-0.12261-0.91750.1814
4-0.091351-0.68360.248522
5-0.177748-1.33010.094431
60.0934060.6990.243726
70.1599751.19710.118146
8-0.133539-0.99930.16097
9-0.088544-0.66260.255151
100.0402520.30120.382182
110.0675530.50550.307588
12-0.134306-1.00510.159598
13-0.107125-0.80160.213073
14-0.278369-2.08310.020909
15-0.126688-0.9480.173589
16-0.135032-1.01050.158305
17-0.046543-0.34830.364463
180.1203420.90060.18584
190.0488550.36560.358021
20-0.187035-1.39960.083568
210.0994950.74460.229828
22-0.236124-1.7670.04134
230.1510161.13010.131625
24-0.028859-0.2160.414902
25-0.142616-1.06720.145221
26-0.123644-0.92530.179398
27-0.009061-0.06780.47309
280.0258720.19360.423592
290.0636970.47670.317729
30-0.098319-0.73580.232475
31-0.130005-0.97290.167401
32-0.083453-0.62450.267417
33-0.084476-0.63220.264928
340.0410250.3070.37999
350.1171250.87650.192256
360.0522510.3910.348637


Parameters (Session):
Parameters (R input):
par1 = 36 ; par2 = 1 ; par3 = 1 ; par4 = 1 ; par5 = 12 ; par6 = MA ; par7 = 0.95 ;
R code (references can be found in the software module):
if (par1 == 'Default') {
par1 = 10*log10(length(x))
} else {
par1 <- as.numeric(par1)
}
par2 <- as.numeric(par2)
par3 <- as.numeric(par3)
par4 <- as.numeric(par4)
par5 <- as.numeric(par5)
if (par6 == 'White Noise') par6 <- 'white' else par6 <- 'ma'
par7 <- as.numeric(par7)
if (par2 == 0) {
x <- log(x)
} else {
x <- (x ^ par2 - 1) / par2
}
if (par3 > 0) x <- diff(x,lag=1,difference=par3)
if (par4 > 0) x <- diff(x,lag=par5,difference=par4)
bitmap(file='pic1.png')
racf <- acf(x, par1, main='Autocorrelation', xlab='time lag', ylab='ACF', ci.type=par6, ci=par7, sub=paste('(lambda=',par2,', d=',par3,', D=',par4,', CI=', par7, ', CI type=',par6,')',sep=''))
dev.off()
bitmap(file='pic2.png')
rpacf <- pacf(x,par1,main='Partial Autocorrelation',xlab='lags',ylab='PACF')
dev.off()
(myacf <- c(racf$acf))
(mypacf <- c(rpacf$acf))
lengthx <- length(x)
sqrtn <- sqrt(lengthx)
load(file='createtable')
a<-table.start()
a<-table.row.start(a)
a<-table.element(a,'Autocorrelation Function',4,TRUE)
a<-table.row.end(a)
a<-table.row.start(a)
a<-table.element(a,'Time lag k',header=TRUE)
a<-table.element(a,hyperlink('basics.htm','ACF(k)','click here for more information about the Autocorrelation Function'),header=TRUE)
a<-table.element(a,'T-STAT',header=TRUE)
a<-table.element(a,'P-value',header=TRUE)
a<-table.row.end(a)
for (i in 2:(par1+1)) {
a<-table.row.start(a)
a<-table.element(a,i-1,header=TRUE)
a<-table.element(a,round(myacf[i],6))
mytstat <- myacf[i]*sqrtn
a<-table.element(a,round(mytstat,4))
a<-table.element(a,round(1-pt(abs(mytstat),lengthx),6))
a<-table.row.end(a)
}
a<-table.end(a)
table.save(a,file='mytable.tab')
a<-table.start()
a<-table.row.start(a)
a<-table.element(a,'Partial Autocorrelation Function',4,TRUE)
a<-table.row.end(a)
a<-table.row.start(a)
a<-table.element(a,'Time lag k',header=TRUE)
a<-table.element(a,hyperlink('basics.htm','PACF(k)','click here for more information about the Partial Autocorrelation Function'),header=TRUE)
a<-table.element(a,'T-STAT',header=TRUE)
a<-table.element(a,'P-value',header=TRUE)
a<-table.row.end(a)
for (i in 1:par1) {
a<-table.row.start(a)
a<-table.element(a,i,header=TRUE)
a<-table.element(a,round(mypacf[i],6))
mytstat <- mypacf[i]*sqrtn
a<-table.element(a,round(mytstat,4))
a<-table.element(a,round(1-pt(abs(mytstat),lengthx),6))
a<-table.row.end(a)
}
a<-table.end(a)
table.save(a,file='mytable1.tab')