Free Statistics

of Irreproducible Research!

Author's title

Author*The author of this computation has been verified*
R Software Modulerwasp_autocorrelation.wasp
Title produced by software(Partial) Autocorrelation Function
Date of computationThu, 17 Dec 2009 20:25:07 +0100
Cite this page as followsStatistical Computations at FreeStatistics.org, Office for Research Development and Education, URL https://freestatistics.org/blog/index.php?v=date/2009/Dec/17/t1261077932pw478a76xkcwe3g.htm/, Retrieved Tue, 30 Apr 2024 03:39:42 +0000
Statistical Computations at FreeStatistics.org, Office for Research Development and Education, URL https://freestatistics.org/blog/index.php?pk=69060, Retrieved Tue, 30 Apr 2024 03:39:42 +0000
QR Codes:

Original text written by user:
IsPrivate?No (this computation is public)
User-defined keywords
Estimated Impact189
Family? (F = Feedback message, R = changed R code, M = changed R Module, P = changed Parameters, D = changed Data)
-     [Univariate Data Series] [] [2009-12-17 19:09:08] [b98453cac15ba1066b407e146608df68]
- RMP     [(Partial) Autocorrelation Function] [] [2009-12-17 19:25:07] [d76b387543b13b5e3afd8ff9e5fdc89f] [Current]
Feedback Forum

Post a new message
Dataseries X:
277
260.6
291.6
275.4
275.3
231.7
238.8
274.2
277.8
299.1
286.6
232.3
294.1
267.5
309.7
280.7
287.3
235.7
256.4
289
290.8
321.9
291.8
241.4
295.5
258.2
306.1
281.5
283.1
237.4
274.8
299.3
300.4
340.9
318.8
265.7
322.7
281.6
323.5
312.6
310.8
262.8
273.8
320
310.3
342.2
320.1
265.6
327
300.7
346.4
317.3
326.2
270.7
278.2
324.6
321.8
343.5
354
278.2
330.2
307.3
375.9
335.3
339.3
280.3
293.7
341.2
345.1
368.7
369.4
288.4
341
319.1
374.2
344.5
337.3
281
282.2
321
325.4
366.3
380.3
300.7
359.3
327.6
383.6
352.4
329.4
294.5
333.5
334.3
358
396.1
387
307.2
363.9
344.7
397.6
376.8
337.1
299.3
323.1
329.1
347
462
436.5
360.4
415.5
382.1
432.2
424.3
386.7
354.5
375.8
368
402.4
426.5
433.3
338.5
416.8
381.1
445.7
412.4
394
348.2
380.1
373.7
393.6
434.2
430.7
344.5
411.9
370.5
437.3
411.3
385.5
341.3
384.2
373.2
415.8
448.6
454.3
350.3
419.1
398
456.1
430.1
399.8
362.7
384.9
385.3
432.3
468.9
442.7
370.2
439.4
393.9
468.7
438.8
430.1
366.3
391
380.9
431.4
465.4
471.5
387.5
446.4
421.5
504.8
492.1
421.3
396.7
428
421.9
465.6
525.8
499.9
435.3
479.5
473
554.4
489.6
462.2
420.3


Summary of computational transaction
Raw Inputview raw input (R code)
Raw Outputview raw output of R engine
Computing time2 seconds
R Server'RServer@AstonUniversity' @ vre.aston.ac.uk

\begin{tabular}{lllllllll}
\hline
Summary of computational transaction \tabularnewline
Raw Input & view raw input (R code)  \tabularnewline
Raw Output & view raw output of R engine  \tabularnewline
Computing time & 2 seconds \tabularnewline
R Server & 'RServer@AstonUniversity' @ vre.aston.ac.uk \tabularnewline
\hline
\end{tabular}
%Source: https://freestatistics.org/blog/index.php?pk=69060&T=0

[TABLE]
[ROW][C]Summary of computational transaction[/C][/ROW]
[ROW][C]Raw Input[/C][C]view raw input (R code) [/C][/ROW]
[ROW][C]Raw Output[/C][C]view raw output of R engine [/C][/ROW]
[ROW][C]Computing time[/C][C]2 seconds[/C][/ROW]
[ROW][C]R Server[/C][C]'RServer@AstonUniversity' @ vre.aston.ac.uk[/C][/ROW]
[/TABLE]
Source: https://freestatistics.org/blog/index.php?pk=69060&T=0

Globally Unique Identifier (entire table): ba.freestatistics.org/blog/index.php?pk=69060&T=0

As an alternative you can also use a QR Code:  

The GUIDs for individual cells are displayed in the table below:

Summary of computational transaction
Raw Inputview raw input (R code)
Raw Outputview raw output of R engine
Computing time2 seconds
R Server'RServer@AstonUniversity' @ vre.aston.ac.uk


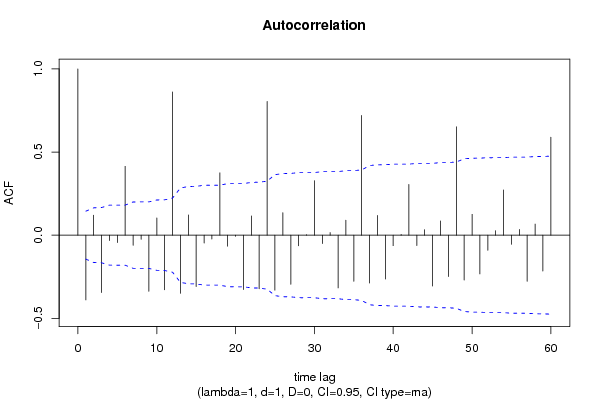
Autocorrelation Function
Time lag kACF(k)T-STATP-value
1-0.389457-5.29720
20.1199221.63110.052284
3-0.345508-4.69943e-06
4-0.032366-0.44020.330142
5-0.044035-0.59890.274973
60.4138625.62910
7-0.06107-0.83060.203623
8-0.024608-0.33470.369115
9-0.33799-4.59724e-06
100.1033231.40530.080798
11-0.328786-4.4727e-06
120.86165211.71970
13-0.350137-4.76242e-06
140.121451.65190.050126
15-0.309017-4.20312e-05
16-0.047494-0.6460.259545
17-0.023172-0.31520.37649
180.3749245.09950
19-0.066244-0.9010.184375
20-0.006537-0.08890.464623
21-0.327611-4.4567e-06
220.115721.5740.058603
23-0.322727-4.38961e-05
240.80456310.94320
25-0.331017-4.50236e-06
260.1352951.84020.03367
27-0.295663-4.02154.2e-05
28-0.063881-0.86890.193022
290.002350.0320.487266
300.3273154.4527e-06
31-0.050876-0.6920.244907
320.0155790.21190.416208
33-0.317455-4.31791.3e-05
340.0895791.21840.112311
35-0.277437-3.77360.000108
360.7203539.79790
37-0.288557-3.92486.1e-05
380.1186151.61330.054188
39-0.263869-3.5890.000213
40-0.063072-0.85790.196036
410.0039280.05340.478725
420.3052144.15142.5e-05
43-0.062023-0.84360.199989
440.03270.44480.328505
45-0.306401-4.16752.4e-05
460.0858581.16780.122196
47-0.248878-3.38510.000434
480.6518078.86550
49-0.270436-3.67830.000154
500.1251151.70170.045242
51-0.233005-3.16920.000894
52-0.091198-1.24040.108194
530.0263870.35890.360041
540.2723793.70480.00014
55-0.055379-0.75320.226134
560.0338570.46050.322848
57-0.277751-3.77780.000107
580.0666150.90610.183041
59-0.216333-2.94240.001837
600.5889378.01040

\begin{tabular}{lllllllll}
\hline
Autocorrelation Function \tabularnewline
Time lag k & ACF(k) & T-STAT & P-value \tabularnewline
1 & -0.389457 & -5.2972 & 0 \tabularnewline
2 & 0.119922 & 1.6311 & 0.052284 \tabularnewline
3 & -0.345508 & -4.6994 & 3e-06 \tabularnewline
4 & -0.032366 & -0.4402 & 0.330142 \tabularnewline
5 & -0.044035 & -0.5989 & 0.274973 \tabularnewline
6 & 0.413862 & 5.6291 & 0 \tabularnewline
7 & -0.06107 & -0.8306 & 0.203623 \tabularnewline
8 & -0.024608 & -0.3347 & 0.369115 \tabularnewline
9 & -0.33799 & -4.5972 & 4e-06 \tabularnewline
10 & 0.103323 & 1.4053 & 0.080798 \tabularnewline
11 & -0.328786 & -4.472 & 7e-06 \tabularnewline
12 & 0.861652 & 11.7197 & 0 \tabularnewline
13 & -0.350137 & -4.7624 & 2e-06 \tabularnewline
14 & 0.12145 & 1.6519 & 0.050126 \tabularnewline
15 & -0.309017 & -4.2031 & 2e-05 \tabularnewline
16 & -0.047494 & -0.646 & 0.259545 \tabularnewline
17 & -0.023172 & -0.3152 & 0.37649 \tabularnewline
18 & 0.374924 & 5.0995 & 0 \tabularnewline
19 & -0.066244 & -0.901 & 0.184375 \tabularnewline
20 & -0.006537 & -0.0889 & 0.464623 \tabularnewline
21 & -0.327611 & -4.456 & 7e-06 \tabularnewline
22 & 0.11572 & 1.574 & 0.058603 \tabularnewline
23 & -0.322727 & -4.3896 & 1e-05 \tabularnewline
24 & 0.804563 & 10.9432 & 0 \tabularnewline
25 & -0.331017 & -4.5023 & 6e-06 \tabularnewline
26 & 0.135295 & 1.8402 & 0.03367 \tabularnewline
27 & -0.295663 & -4.0215 & 4.2e-05 \tabularnewline
28 & -0.063881 & -0.8689 & 0.193022 \tabularnewline
29 & 0.00235 & 0.032 & 0.487266 \tabularnewline
30 & 0.327315 & 4.452 & 7e-06 \tabularnewline
31 & -0.050876 & -0.692 & 0.244907 \tabularnewline
32 & 0.015579 & 0.2119 & 0.416208 \tabularnewline
33 & -0.317455 & -4.3179 & 1.3e-05 \tabularnewline
34 & 0.089579 & 1.2184 & 0.112311 \tabularnewline
35 & -0.277437 & -3.7736 & 0.000108 \tabularnewline
36 & 0.720353 & 9.7979 & 0 \tabularnewline
37 & -0.288557 & -3.9248 & 6.1e-05 \tabularnewline
38 & 0.118615 & 1.6133 & 0.054188 \tabularnewline
39 & -0.263869 & -3.589 & 0.000213 \tabularnewline
40 & -0.063072 & -0.8579 & 0.196036 \tabularnewline
41 & 0.003928 & 0.0534 & 0.478725 \tabularnewline
42 & 0.305214 & 4.1514 & 2.5e-05 \tabularnewline
43 & -0.062023 & -0.8436 & 0.199989 \tabularnewline
44 & 0.0327 & 0.4448 & 0.328505 \tabularnewline
45 & -0.306401 & -4.1675 & 2.4e-05 \tabularnewline
46 & 0.085858 & 1.1678 & 0.122196 \tabularnewline
47 & -0.248878 & -3.3851 & 0.000434 \tabularnewline
48 & 0.651807 & 8.8655 & 0 \tabularnewline
49 & -0.270436 & -3.6783 & 0.000154 \tabularnewline
50 & 0.125115 & 1.7017 & 0.045242 \tabularnewline
51 & -0.233005 & -3.1692 & 0.000894 \tabularnewline
52 & -0.091198 & -1.2404 & 0.108194 \tabularnewline
53 & 0.026387 & 0.3589 & 0.360041 \tabularnewline
54 & 0.272379 & 3.7048 & 0.00014 \tabularnewline
55 & -0.055379 & -0.7532 & 0.226134 \tabularnewline
56 & 0.033857 & 0.4605 & 0.322848 \tabularnewline
57 & -0.277751 & -3.7778 & 0.000107 \tabularnewline
58 & 0.066615 & 0.9061 & 0.183041 \tabularnewline
59 & -0.216333 & -2.9424 & 0.001837 \tabularnewline
60 & 0.588937 & 8.0104 & 0 \tabularnewline
\hline
\end{tabular}
%Source: https://freestatistics.org/blog/index.php?pk=69060&T=1

[TABLE]
[ROW][C]Autocorrelation Function[/C][/ROW]
[ROW][C]Time lag k[/C][C]ACF(k)[/C][C]T-STAT[/C][C]P-value[/C][/ROW]
[ROW][C]1[/C][C]-0.389457[/C][C]-5.2972[/C][C]0[/C][/ROW]
[ROW][C]2[/C][C]0.119922[/C][C]1.6311[/C][C]0.052284[/C][/ROW]
[ROW][C]3[/C][C]-0.345508[/C][C]-4.6994[/C][C]3e-06[/C][/ROW]
[ROW][C]4[/C][C]-0.032366[/C][C]-0.4402[/C][C]0.330142[/C][/ROW]
[ROW][C]5[/C][C]-0.044035[/C][C]-0.5989[/C][C]0.274973[/C][/ROW]
[ROW][C]6[/C][C]0.413862[/C][C]5.6291[/C][C]0[/C][/ROW]
[ROW][C]7[/C][C]-0.06107[/C][C]-0.8306[/C][C]0.203623[/C][/ROW]
[ROW][C]8[/C][C]-0.024608[/C][C]-0.3347[/C][C]0.369115[/C][/ROW]
[ROW][C]9[/C][C]-0.33799[/C][C]-4.5972[/C][C]4e-06[/C][/ROW]
[ROW][C]10[/C][C]0.103323[/C][C]1.4053[/C][C]0.080798[/C][/ROW]
[ROW][C]11[/C][C]-0.328786[/C][C]-4.472[/C][C]7e-06[/C][/ROW]
[ROW][C]12[/C][C]0.861652[/C][C]11.7197[/C][C]0[/C][/ROW]
[ROW][C]13[/C][C]-0.350137[/C][C]-4.7624[/C][C]2e-06[/C][/ROW]
[ROW][C]14[/C][C]0.12145[/C][C]1.6519[/C][C]0.050126[/C][/ROW]
[ROW][C]15[/C][C]-0.309017[/C][C]-4.2031[/C][C]2e-05[/C][/ROW]
[ROW][C]16[/C][C]-0.047494[/C][C]-0.646[/C][C]0.259545[/C][/ROW]
[ROW][C]17[/C][C]-0.023172[/C][C]-0.3152[/C][C]0.37649[/C][/ROW]
[ROW][C]18[/C][C]0.374924[/C][C]5.0995[/C][C]0[/C][/ROW]
[ROW][C]19[/C][C]-0.066244[/C][C]-0.901[/C][C]0.184375[/C][/ROW]
[ROW][C]20[/C][C]-0.006537[/C][C]-0.0889[/C][C]0.464623[/C][/ROW]
[ROW][C]21[/C][C]-0.327611[/C][C]-4.456[/C][C]7e-06[/C][/ROW]
[ROW][C]22[/C][C]0.11572[/C][C]1.574[/C][C]0.058603[/C][/ROW]
[ROW][C]23[/C][C]-0.322727[/C][C]-4.3896[/C][C]1e-05[/C][/ROW]
[ROW][C]24[/C][C]0.804563[/C][C]10.9432[/C][C]0[/C][/ROW]
[ROW][C]25[/C][C]-0.331017[/C][C]-4.5023[/C][C]6e-06[/C][/ROW]
[ROW][C]26[/C][C]0.135295[/C][C]1.8402[/C][C]0.03367[/C][/ROW]
[ROW][C]27[/C][C]-0.295663[/C][C]-4.0215[/C][C]4.2e-05[/C][/ROW]
[ROW][C]28[/C][C]-0.063881[/C][C]-0.8689[/C][C]0.193022[/C][/ROW]
[ROW][C]29[/C][C]0.00235[/C][C]0.032[/C][C]0.487266[/C][/ROW]
[ROW][C]30[/C][C]0.327315[/C][C]4.452[/C][C]7e-06[/C][/ROW]
[ROW][C]31[/C][C]-0.050876[/C][C]-0.692[/C][C]0.244907[/C][/ROW]
[ROW][C]32[/C][C]0.015579[/C][C]0.2119[/C][C]0.416208[/C][/ROW]
[ROW][C]33[/C][C]-0.317455[/C][C]-4.3179[/C][C]1.3e-05[/C][/ROW]
[ROW][C]34[/C][C]0.089579[/C][C]1.2184[/C][C]0.112311[/C][/ROW]
[ROW][C]35[/C][C]-0.277437[/C][C]-3.7736[/C][C]0.000108[/C][/ROW]
[ROW][C]36[/C][C]0.720353[/C][C]9.7979[/C][C]0[/C][/ROW]
[ROW][C]37[/C][C]-0.288557[/C][C]-3.9248[/C][C]6.1e-05[/C][/ROW]
[ROW][C]38[/C][C]0.118615[/C][C]1.6133[/C][C]0.054188[/C][/ROW]
[ROW][C]39[/C][C]-0.263869[/C][C]-3.589[/C][C]0.000213[/C][/ROW]
[ROW][C]40[/C][C]-0.063072[/C][C]-0.8579[/C][C]0.196036[/C][/ROW]
[ROW][C]41[/C][C]0.003928[/C][C]0.0534[/C][C]0.478725[/C][/ROW]
[ROW][C]42[/C][C]0.305214[/C][C]4.1514[/C][C]2.5e-05[/C][/ROW]
[ROW][C]43[/C][C]-0.062023[/C][C]-0.8436[/C][C]0.199989[/C][/ROW]
[ROW][C]44[/C][C]0.0327[/C][C]0.4448[/C][C]0.328505[/C][/ROW]
[ROW][C]45[/C][C]-0.306401[/C][C]-4.1675[/C][C]2.4e-05[/C][/ROW]
[ROW][C]46[/C][C]0.085858[/C][C]1.1678[/C][C]0.122196[/C][/ROW]
[ROW][C]47[/C][C]-0.248878[/C][C]-3.3851[/C][C]0.000434[/C][/ROW]
[ROW][C]48[/C][C]0.651807[/C][C]8.8655[/C][C]0[/C][/ROW]
[ROW][C]49[/C][C]-0.270436[/C][C]-3.6783[/C][C]0.000154[/C][/ROW]
[ROW][C]50[/C][C]0.125115[/C][C]1.7017[/C][C]0.045242[/C][/ROW]
[ROW][C]51[/C][C]-0.233005[/C][C]-3.1692[/C][C]0.000894[/C][/ROW]
[ROW][C]52[/C][C]-0.091198[/C][C]-1.2404[/C][C]0.108194[/C][/ROW]
[ROW][C]53[/C][C]0.026387[/C][C]0.3589[/C][C]0.360041[/C][/ROW]
[ROW][C]54[/C][C]0.272379[/C][C]3.7048[/C][C]0.00014[/C][/ROW]
[ROW][C]55[/C][C]-0.055379[/C][C]-0.7532[/C][C]0.226134[/C][/ROW]
[ROW][C]56[/C][C]0.033857[/C][C]0.4605[/C][C]0.322848[/C][/ROW]
[ROW][C]57[/C][C]-0.277751[/C][C]-3.7778[/C][C]0.000107[/C][/ROW]
[ROW][C]58[/C][C]0.066615[/C][C]0.9061[/C][C]0.183041[/C][/ROW]
[ROW][C]59[/C][C]-0.216333[/C][C]-2.9424[/C][C]0.001837[/C][/ROW]
[ROW][C]60[/C][C]0.588937[/C][C]8.0104[/C][C]0[/C][/ROW]
[/TABLE]
Source: https://freestatistics.org/blog/index.php?pk=69060&T=1

Globally Unique Identifier (entire table): ba.freestatistics.org/blog/index.php?pk=69060&T=1

As an alternative you can also use a QR Code:  

The GUIDs for individual cells are displayed in the table below:

Autocorrelation Function
Time lag kACF(k)T-STATP-value
1-0.389457-5.29720
20.1199221.63110.052284
3-0.345508-4.69943e-06
4-0.032366-0.44020.330142
5-0.044035-0.59890.274973
60.4138625.62910
7-0.06107-0.83060.203623
8-0.024608-0.33470.369115
9-0.33799-4.59724e-06
100.1033231.40530.080798
11-0.328786-4.4727e-06
120.86165211.71970
13-0.350137-4.76242e-06
140.121451.65190.050126
15-0.309017-4.20312e-05
16-0.047494-0.6460.259545
17-0.023172-0.31520.37649
180.3749245.09950
19-0.066244-0.9010.184375
20-0.006537-0.08890.464623
21-0.327611-4.4567e-06
220.115721.5740.058603
23-0.322727-4.38961e-05
240.80456310.94320
25-0.331017-4.50236e-06
260.1352951.84020.03367
27-0.295663-4.02154.2e-05
28-0.063881-0.86890.193022
290.002350.0320.487266
300.3273154.4527e-06
31-0.050876-0.6920.244907
320.0155790.21190.416208
33-0.317455-4.31791.3e-05
340.0895791.21840.112311
35-0.277437-3.77360.000108
360.7203539.79790
37-0.288557-3.92486.1e-05
380.1186151.61330.054188
39-0.263869-3.5890.000213
40-0.063072-0.85790.196036
410.0039280.05340.478725
420.3052144.15142.5e-05
43-0.062023-0.84360.199989
440.03270.44480.328505
45-0.306401-4.16752.4e-05
460.0858581.16780.122196
47-0.248878-3.38510.000434
480.6518078.86550
49-0.270436-3.67830.000154
500.1251151.70170.045242
51-0.233005-3.16920.000894
52-0.091198-1.24040.108194
530.0263870.35890.360041
540.2723793.70480.00014
55-0.055379-0.75320.226134
560.0338570.46050.322848
57-0.277751-3.77780.000107
580.0666150.90610.183041
59-0.216333-2.94240.001837
600.5889378.01040


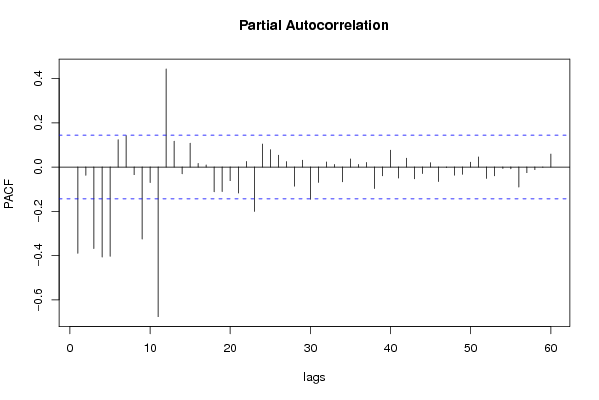
Partial Autocorrelation Function
Time lag kPACF(k)T-STATP-value
1-0.389457-5.29720
2-0.037432-0.50910.305633
3-0.367868-5.00351e-06
4-0.406388-5.52750
5-0.403259-5.48490
60.1231631.67520.047792
70.1418571.92950.027601
8-0.034476-0.46890.319837
9-0.324932-4.41958e-06
10-0.070186-0.95460.170503
11-0.676115-9.19620
120.4433126.02970
130.1168151.58890.0569
14-0.03069-0.41740.338424
150.107911.46770.071938
160.0163630.22260.412061
170.0096230.13090.448005
18-0.111502-1.51660.065538
19-0.110573-1.5040.067149
20-0.06162-0.83810.201521
21-0.11739-1.59670.056022
220.025370.34510.365217
23-0.200347-2.7250.003524
240.1037031.41050.080033
250.0782571.06440.144264
260.0535520.72840.233647
270.0245140.33340.369595
28-0.086495-1.17650.120461
290.0307240.41790.338257
30-0.145316-1.97650.024792
31-0.069333-0.9430.173448
320.0232620.31640.376029
330.0113010.15370.439003
34-0.066668-0.90680.182851
350.036870.50150.308313
360.0116040.15780.437381
370.0207840.28270.388864
38-0.097286-1.32320.093695
39-0.039204-0.53320.297257
400.0759941.03360.15133
41-0.049889-0.67860.249132
420.040160.54620.292783
43-0.05298-0.72060.23603
44-0.029565-0.40210.344029
450.0192630.2620.396804
46-0.06523-0.88720.188055
47-0.001915-0.02610.489622
48-0.036744-0.49980.308916
49-0.0328-0.44610.328012
500.0221590.30140.381728
510.0453120.61630.269223
52-0.051318-0.6980.243028
53-0.039379-0.53560.296433
54-0.006118-0.08320.466886
55-0.007513-0.10220.459359
56-0.090615-1.23250.109664
57-0.025341-0.34470.365367
58-0.011798-0.16050.436341
59-0.001219-0.01660.493393
600.0584870.79550.213668

\begin{tabular}{lllllllll}
\hline
Partial Autocorrelation Function \tabularnewline
Time lag k & PACF(k) & T-STAT & P-value \tabularnewline
1 & -0.389457 & -5.2972 & 0 \tabularnewline
2 & -0.037432 & -0.5091 & 0.305633 \tabularnewline
3 & -0.367868 & -5.0035 & 1e-06 \tabularnewline
4 & -0.406388 & -5.5275 & 0 \tabularnewline
5 & -0.403259 & -5.4849 & 0 \tabularnewline
6 & 0.123163 & 1.6752 & 0.047792 \tabularnewline
7 & 0.141857 & 1.9295 & 0.027601 \tabularnewline
8 & -0.034476 & -0.4689 & 0.319837 \tabularnewline
9 & -0.324932 & -4.4195 & 8e-06 \tabularnewline
10 & -0.070186 & -0.9546 & 0.170503 \tabularnewline
11 & -0.676115 & -9.1962 & 0 \tabularnewline
12 & 0.443312 & 6.0297 & 0 \tabularnewline
13 & 0.116815 & 1.5889 & 0.0569 \tabularnewline
14 & -0.03069 & -0.4174 & 0.338424 \tabularnewline
15 & 0.10791 & 1.4677 & 0.071938 \tabularnewline
16 & 0.016363 & 0.2226 & 0.412061 \tabularnewline
17 & 0.009623 & 0.1309 & 0.448005 \tabularnewline
18 & -0.111502 & -1.5166 & 0.065538 \tabularnewline
19 & -0.110573 & -1.504 & 0.067149 \tabularnewline
20 & -0.06162 & -0.8381 & 0.201521 \tabularnewline
21 & -0.11739 & -1.5967 & 0.056022 \tabularnewline
22 & 0.02537 & 0.3451 & 0.365217 \tabularnewline
23 & -0.200347 & -2.725 & 0.003524 \tabularnewline
24 & 0.103703 & 1.4105 & 0.080033 \tabularnewline
25 & 0.078257 & 1.0644 & 0.144264 \tabularnewline
26 & 0.053552 & 0.7284 & 0.233647 \tabularnewline
27 & 0.024514 & 0.3334 & 0.369595 \tabularnewline
28 & -0.086495 & -1.1765 & 0.120461 \tabularnewline
29 & 0.030724 & 0.4179 & 0.338257 \tabularnewline
30 & -0.145316 & -1.9765 & 0.024792 \tabularnewline
31 & -0.069333 & -0.943 & 0.173448 \tabularnewline
32 & 0.023262 & 0.3164 & 0.376029 \tabularnewline
33 & 0.011301 & 0.1537 & 0.439003 \tabularnewline
34 & -0.066668 & -0.9068 & 0.182851 \tabularnewline
35 & 0.03687 & 0.5015 & 0.308313 \tabularnewline
36 & 0.011604 & 0.1578 & 0.437381 \tabularnewline
37 & 0.020784 & 0.2827 & 0.388864 \tabularnewline
38 & -0.097286 & -1.3232 & 0.093695 \tabularnewline
39 & -0.039204 & -0.5332 & 0.297257 \tabularnewline
40 & 0.075994 & 1.0336 & 0.15133 \tabularnewline
41 & -0.049889 & -0.6786 & 0.249132 \tabularnewline
42 & 0.04016 & 0.5462 & 0.292783 \tabularnewline
43 & -0.05298 & -0.7206 & 0.23603 \tabularnewline
44 & -0.029565 & -0.4021 & 0.344029 \tabularnewline
45 & 0.019263 & 0.262 & 0.396804 \tabularnewline
46 & -0.06523 & -0.8872 & 0.188055 \tabularnewline
47 & -0.001915 & -0.0261 & 0.489622 \tabularnewline
48 & -0.036744 & -0.4998 & 0.308916 \tabularnewline
49 & -0.0328 & -0.4461 & 0.328012 \tabularnewline
50 & 0.022159 & 0.3014 & 0.381728 \tabularnewline
51 & 0.045312 & 0.6163 & 0.269223 \tabularnewline
52 & -0.051318 & -0.698 & 0.243028 \tabularnewline
53 & -0.039379 & -0.5356 & 0.296433 \tabularnewline
54 & -0.006118 & -0.0832 & 0.466886 \tabularnewline
55 & -0.007513 & -0.1022 & 0.459359 \tabularnewline
56 & -0.090615 & -1.2325 & 0.109664 \tabularnewline
57 & -0.025341 & -0.3447 & 0.365367 \tabularnewline
58 & -0.011798 & -0.1605 & 0.436341 \tabularnewline
59 & -0.001219 & -0.0166 & 0.493393 \tabularnewline
60 & 0.058487 & 0.7955 & 0.213668 \tabularnewline
\hline
\end{tabular}
%Source: https://freestatistics.org/blog/index.php?pk=69060&T=2

[TABLE]
[ROW][C]Partial Autocorrelation Function[/C][/ROW]
[ROW][C]Time lag k[/C][C]PACF(k)[/C][C]T-STAT[/C][C]P-value[/C][/ROW]
[ROW][C]1[/C][C]-0.389457[/C][C]-5.2972[/C][C]0[/C][/ROW]
[ROW][C]2[/C][C]-0.037432[/C][C]-0.5091[/C][C]0.305633[/C][/ROW]
[ROW][C]3[/C][C]-0.367868[/C][C]-5.0035[/C][C]1e-06[/C][/ROW]
[ROW][C]4[/C][C]-0.406388[/C][C]-5.5275[/C][C]0[/C][/ROW]
[ROW][C]5[/C][C]-0.403259[/C][C]-5.4849[/C][C]0[/C][/ROW]
[ROW][C]6[/C][C]0.123163[/C][C]1.6752[/C][C]0.047792[/C][/ROW]
[ROW][C]7[/C][C]0.141857[/C][C]1.9295[/C][C]0.027601[/C][/ROW]
[ROW][C]8[/C][C]-0.034476[/C][C]-0.4689[/C][C]0.319837[/C][/ROW]
[ROW][C]9[/C][C]-0.324932[/C][C]-4.4195[/C][C]8e-06[/C][/ROW]
[ROW][C]10[/C][C]-0.070186[/C][C]-0.9546[/C][C]0.170503[/C][/ROW]
[ROW][C]11[/C][C]-0.676115[/C][C]-9.1962[/C][C]0[/C][/ROW]
[ROW][C]12[/C][C]0.443312[/C][C]6.0297[/C][C]0[/C][/ROW]
[ROW][C]13[/C][C]0.116815[/C][C]1.5889[/C][C]0.0569[/C][/ROW]
[ROW][C]14[/C][C]-0.03069[/C][C]-0.4174[/C][C]0.338424[/C][/ROW]
[ROW][C]15[/C][C]0.10791[/C][C]1.4677[/C][C]0.071938[/C][/ROW]
[ROW][C]16[/C][C]0.016363[/C][C]0.2226[/C][C]0.412061[/C][/ROW]
[ROW][C]17[/C][C]0.009623[/C][C]0.1309[/C][C]0.448005[/C][/ROW]
[ROW][C]18[/C][C]-0.111502[/C][C]-1.5166[/C][C]0.065538[/C][/ROW]
[ROW][C]19[/C][C]-0.110573[/C][C]-1.504[/C][C]0.067149[/C][/ROW]
[ROW][C]20[/C][C]-0.06162[/C][C]-0.8381[/C][C]0.201521[/C][/ROW]
[ROW][C]21[/C][C]-0.11739[/C][C]-1.5967[/C][C]0.056022[/C][/ROW]
[ROW][C]22[/C][C]0.02537[/C][C]0.3451[/C][C]0.365217[/C][/ROW]
[ROW][C]23[/C][C]-0.200347[/C][C]-2.725[/C][C]0.003524[/C][/ROW]
[ROW][C]24[/C][C]0.103703[/C][C]1.4105[/C][C]0.080033[/C][/ROW]
[ROW][C]25[/C][C]0.078257[/C][C]1.0644[/C][C]0.144264[/C][/ROW]
[ROW][C]26[/C][C]0.053552[/C][C]0.7284[/C][C]0.233647[/C][/ROW]
[ROW][C]27[/C][C]0.024514[/C][C]0.3334[/C][C]0.369595[/C][/ROW]
[ROW][C]28[/C][C]-0.086495[/C][C]-1.1765[/C][C]0.120461[/C][/ROW]
[ROW][C]29[/C][C]0.030724[/C][C]0.4179[/C][C]0.338257[/C][/ROW]
[ROW][C]30[/C][C]-0.145316[/C][C]-1.9765[/C][C]0.024792[/C][/ROW]
[ROW][C]31[/C][C]-0.069333[/C][C]-0.943[/C][C]0.173448[/C][/ROW]
[ROW][C]32[/C][C]0.023262[/C][C]0.3164[/C][C]0.376029[/C][/ROW]
[ROW][C]33[/C][C]0.011301[/C][C]0.1537[/C][C]0.439003[/C][/ROW]
[ROW][C]34[/C][C]-0.066668[/C][C]-0.9068[/C][C]0.182851[/C][/ROW]
[ROW][C]35[/C][C]0.03687[/C][C]0.5015[/C][C]0.308313[/C][/ROW]
[ROW][C]36[/C][C]0.011604[/C][C]0.1578[/C][C]0.437381[/C][/ROW]
[ROW][C]37[/C][C]0.020784[/C][C]0.2827[/C][C]0.388864[/C][/ROW]
[ROW][C]38[/C][C]-0.097286[/C][C]-1.3232[/C][C]0.093695[/C][/ROW]
[ROW][C]39[/C][C]-0.039204[/C][C]-0.5332[/C][C]0.297257[/C][/ROW]
[ROW][C]40[/C][C]0.075994[/C][C]1.0336[/C][C]0.15133[/C][/ROW]
[ROW][C]41[/C][C]-0.049889[/C][C]-0.6786[/C][C]0.249132[/C][/ROW]
[ROW][C]42[/C][C]0.04016[/C][C]0.5462[/C][C]0.292783[/C][/ROW]
[ROW][C]43[/C][C]-0.05298[/C][C]-0.7206[/C][C]0.23603[/C][/ROW]
[ROW][C]44[/C][C]-0.029565[/C][C]-0.4021[/C][C]0.344029[/C][/ROW]
[ROW][C]45[/C][C]0.019263[/C][C]0.262[/C][C]0.396804[/C][/ROW]
[ROW][C]46[/C][C]-0.06523[/C][C]-0.8872[/C][C]0.188055[/C][/ROW]
[ROW][C]47[/C][C]-0.001915[/C][C]-0.0261[/C][C]0.489622[/C][/ROW]
[ROW][C]48[/C][C]-0.036744[/C][C]-0.4998[/C][C]0.308916[/C][/ROW]
[ROW][C]49[/C][C]-0.0328[/C][C]-0.4461[/C][C]0.328012[/C][/ROW]
[ROW][C]50[/C][C]0.022159[/C][C]0.3014[/C][C]0.381728[/C][/ROW]
[ROW][C]51[/C][C]0.045312[/C][C]0.6163[/C][C]0.269223[/C][/ROW]
[ROW][C]52[/C][C]-0.051318[/C][C]-0.698[/C][C]0.243028[/C][/ROW]
[ROW][C]53[/C][C]-0.039379[/C][C]-0.5356[/C][C]0.296433[/C][/ROW]
[ROW][C]54[/C][C]-0.006118[/C][C]-0.0832[/C][C]0.466886[/C][/ROW]
[ROW][C]55[/C][C]-0.007513[/C][C]-0.1022[/C][C]0.459359[/C][/ROW]
[ROW][C]56[/C][C]-0.090615[/C][C]-1.2325[/C][C]0.109664[/C][/ROW]
[ROW][C]57[/C][C]-0.025341[/C][C]-0.3447[/C][C]0.365367[/C][/ROW]
[ROW][C]58[/C][C]-0.011798[/C][C]-0.1605[/C][C]0.436341[/C][/ROW]
[ROW][C]59[/C][C]-0.001219[/C][C]-0.0166[/C][C]0.493393[/C][/ROW]
[ROW][C]60[/C][C]0.058487[/C][C]0.7955[/C][C]0.213668[/C][/ROW]
[/TABLE]
Source: https://freestatistics.org/blog/index.php?pk=69060&T=2

Globally Unique Identifier (entire table): ba.freestatistics.org/blog/index.php?pk=69060&T=2

As an alternative you can also use a QR Code:  

The GUIDs for individual cells are displayed in the table below:

Partial Autocorrelation Function
Time lag kPACF(k)T-STATP-value
1-0.389457-5.29720
2-0.037432-0.50910.305633
3-0.367868-5.00351e-06
4-0.406388-5.52750
5-0.403259-5.48490
60.1231631.67520.047792
70.1418571.92950.027601
8-0.034476-0.46890.319837
9-0.324932-4.41958e-06
10-0.070186-0.95460.170503
11-0.676115-9.19620
120.4433126.02970
130.1168151.58890.0569
14-0.03069-0.41740.338424
150.107911.46770.071938
160.0163630.22260.412061
170.0096230.13090.448005
18-0.111502-1.51660.065538
19-0.110573-1.5040.067149
20-0.06162-0.83810.201521
21-0.11739-1.59670.056022
220.025370.34510.365217
23-0.200347-2.7250.003524
240.1037031.41050.080033
250.0782571.06440.144264
260.0535520.72840.233647
270.0245140.33340.369595
28-0.086495-1.17650.120461
290.0307240.41790.338257
30-0.145316-1.97650.024792
31-0.069333-0.9430.173448
320.0232620.31640.376029
330.0113010.15370.439003
34-0.066668-0.90680.182851
350.036870.50150.308313
360.0116040.15780.437381
370.0207840.28270.388864
38-0.097286-1.32320.093695
39-0.039204-0.53320.297257
400.0759941.03360.15133
41-0.049889-0.67860.249132
420.040160.54620.292783
43-0.05298-0.72060.23603
44-0.029565-0.40210.344029
450.0192630.2620.396804
46-0.06523-0.88720.188055
47-0.001915-0.02610.489622
48-0.036744-0.49980.308916
49-0.0328-0.44610.328012
500.0221590.30140.381728
510.0453120.61630.269223
52-0.051318-0.6980.243028
53-0.039379-0.53560.296433
54-0.006118-0.08320.466886
55-0.007513-0.10220.459359
56-0.090615-1.23250.109664
57-0.025341-0.34470.365367
58-0.011798-0.16050.436341
59-0.001219-0.01660.493393
600.0584870.79550.213668


Parameters (Session):
par1 = 60 ; par2 = 1 ; par3 = 1 ; par4 = 0 ; par5 = 12 ; par6 = MA ; par7 = 0.95 ;
Parameters (R input):
par1 = 60 ; par2 = 1 ; par3 = 1 ; par4 = 0 ; par5 = 12 ; par6 = MA ; par7 = 0.95 ;
R code (references can be found in the software module):
if (par1 == 'Default') {
par1 = 10*log10(length(x))
} else {
par1 <- as.numeric(par1)
}
par2 <- as.numeric(par2)
par3 <- as.numeric(par3)
par4 <- as.numeric(par4)
par5 <- as.numeric(par5)
if (par6 == 'White Noise') par6 <- 'white' else par6 <- 'ma'
par7 <- as.numeric(par7)
if (par2 == 0) {
x <- log(x)
} else {
x <- (x ^ par2 - 1) / par2
}
if (par3 > 0) x <- diff(x,lag=1,difference=par3)
if (par4 > 0) x <- diff(x,lag=par5,difference=par4)
bitmap(file='pic1.png')
racf <- acf(x, par1, main='Autocorrelation', xlab='time lag', ylab='ACF', ci.type=par6, ci=par7, sub=paste('(lambda=',par2,', d=',par3,', D=',par4,', CI=', par7, ', CI type=',par6,')',sep=''))
dev.off()
bitmap(file='pic2.png')
rpacf <- pacf(x,par1,main='Partial Autocorrelation',xlab='lags',ylab='PACF')
dev.off()
(myacf <- c(racf$acf))
(mypacf <- c(rpacf$acf))
lengthx <- length(x)
sqrtn <- sqrt(lengthx)
load(file='createtable')
a<-table.start()
a<-table.row.start(a)
a<-table.element(a,'Autocorrelation Function',4,TRUE)
a<-table.row.end(a)
a<-table.row.start(a)
a<-table.element(a,'Time lag k',header=TRUE)
a<-table.element(a,hyperlink('basics.htm','ACF(k)','click here for more information about the Autocorrelation Function'),header=TRUE)
a<-table.element(a,'T-STAT',header=TRUE)
a<-table.element(a,'P-value',header=TRUE)
a<-table.row.end(a)
for (i in 2:(par1+1)) {
a<-table.row.start(a)
a<-table.element(a,i-1,header=TRUE)
a<-table.element(a,round(myacf[i],6))
mytstat <- myacf[i]*sqrtn
a<-table.element(a,round(mytstat,4))
a<-table.element(a,round(1-pt(abs(mytstat),lengthx),6))
a<-table.row.end(a)
}
a<-table.end(a)
table.save(a,file='mytable.tab')
a<-table.start()
a<-table.row.start(a)
a<-table.element(a,'Partial Autocorrelation Function',4,TRUE)
a<-table.row.end(a)
a<-table.row.start(a)
a<-table.element(a,'Time lag k',header=TRUE)
a<-table.element(a,hyperlink('basics.htm','PACF(k)','click here for more information about the Partial Autocorrelation Function'),header=TRUE)
a<-table.element(a,'T-STAT',header=TRUE)
a<-table.element(a,'P-value',header=TRUE)
a<-table.row.end(a)
for (i in 1:par1) {
a<-table.row.start(a)
a<-table.element(a,i,header=TRUE)
a<-table.element(a,round(mypacf[i],6))
mytstat <- mypacf[i]*sqrtn
a<-table.element(a,round(mytstat,4))
a<-table.element(a,round(1-pt(abs(mytstat),lengthx),6))
a<-table.row.end(a)
}
a<-table.end(a)
table.save(a,file='mytable1.tab')