Free Statistics

of Irreproducible Research!

Author's title

Author*The author of this computation has been verified*
R Software Modulerwasp_arimaforecasting.wasp
Title produced by softwareARIMA Forecasting
Date of computationThu, 17 Dec 2009 21:12:48 +0100
Cite this page as followsStatistical Computations at FreeStatistics.org, Office for Research Development and Education, URL https://freestatistics.org/blog/index.php?v=date/2009/Dec/17/t12610808505m68j7lwr5vheqj.htm/, Retrieved Tue, 30 Apr 2024 04:33:47 +0000
Statistical Computations at FreeStatistics.org, Office for Research Development and Education, URL https://freestatistics.org/blog/index.php?pk=69088, Retrieved Tue, 30 Apr 2024 04:33:47 +0000
QR Codes:

Original text written by user:
IsPrivate?No (this computation is public)
User-defined keywords
Estimated Impact216
Family? (F = Feedback message, R = changed R code, M = changed R Module, P = changed Parameters, D = changed Data)
-     [Univariate Data Series] [] [2009-12-17 19:09:08] [b98453cac15ba1066b407e146608df68]
- RMP     [ARIMA Forecasting] [] [2009-12-17 20:12:48] [d76b387543b13b5e3afd8ff9e5fdc89f] [Current]
-   P       [ARIMA Forecasting] [Herberekening examen] [2010-01-25 10:47:22] [d31db4f83c6a129f6d3e47077769e868]
Feedback Forum

Post a new message
Dataseries X:
277
260.6
291.6
275.4
275.3
231.7
238.8
274.2
277.8
299.1
286.6
232.3
294.1
267.5
309.7
280.7
287.3
235.7
256.4
289
290.8
321.9
291.8
241.4
295.5
258.2
306.1
281.5
283.1
237.4
274.8
299.3
300.4
340.9
318.8
265.7
322.7
281.6
323.5
312.6
310.8
262.8
273.8
320
310.3
342.2
320.1
265.6
327
300.7
346.4
317.3
326.2
270.7
278.2
324.6
321.8
343.5
354
278.2
330.2
307.3
375.9
335.3
339.3
280.3
293.7
341.2
345.1
368.7
369.4
288.4
341
319.1
374.2
344.5
337.3
281
282.2
321
325.4
366.3
380.3
300.7
359.3
327.6
383.6
352.4
329.4
294.5
333.5
334.3
358
396.1
387
307.2
363.9
344.7
397.6
376.8
337.1
299.3
323.1
329.1
347
462
436.5
360.4
415.5
382.1
432.2
424.3
386.7
354.5
375.8
368
402.4
426.5
433.3
338.5
416.8
381.1
445.7
412.4
394
348.2
380.1
373.7
393.6
434.2
430.7
344.5
411.9
370.5
437.3
411.3
385.5
341.3
384.2
373.2
415.8
448.6
454.3
350.3
419.1
398
456.1
430.1
399.8
362.7
384.9
385.3
432.3
468.9
442.7
370.2
439.4
393.9
468.7
438.8
430.1
366.3
391
380.9
431.4
465.4
471.5
387.5
446.4
421.5
504.8
492.1
421.3
396.7
428
421.9
465.6
525.8
499.9
435.3
479.5
473
554.4
489.6
462.2
420.3


Summary of computational transaction
Raw Inputview raw input (R code)
Raw Outputview raw output of R engine
Computing time5 seconds
R Server'Gwilym Jenkins' @ 72.249.127.135

\begin{tabular}{lllllllll}
\hline
Summary of computational transaction \tabularnewline
Raw Input & view raw input (R code)  \tabularnewline
Raw Output & view raw output of R engine  \tabularnewline
Computing time & 5 seconds \tabularnewline
R Server & 'Gwilym Jenkins' @ 72.249.127.135 \tabularnewline
\hline
\end{tabular}
%Source: https://freestatistics.org/blog/index.php?pk=69088&T=0

[TABLE]
[ROW][C]Summary of computational transaction[/C][/ROW]
[ROW][C]Raw Input[/C][C]view raw input (R code) [/C][/ROW]
[ROW][C]Raw Output[/C][C]view raw output of R engine [/C][/ROW]
[ROW][C]Computing time[/C][C]5 seconds[/C][/ROW]
[ROW][C]R Server[/C][C]'Gwilym Jenkins' @ 72.249.127.135[/C][/ROW]
[/TABLE]
Source: https://freestatistics.org/blog/index.php?pk=69088&T=0

Globally Unique Identifier (entire table): ba.freestatistics.org/blog/index.php?pk=69088&T=0

As an alternative you can also use a QR Code:  

The GUIDs for individual cells are displayed in the table below:

Summary of computational transaction
Raw Inputview raw input (R code)
Raw Outputview raw output of R engine
Computing time5 seconds
R Server'Gwilym Jenkins' @ 72.249.127.135


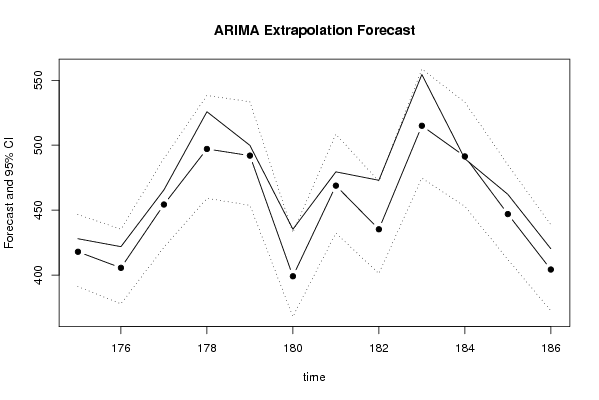
Univariate ARIMA Extrapolation Forecast
timeY[t]F[t]95% LB95% UBp-value(H0: Y[t] = F[t])P(F[t]>Y[t-1])P(F[t]>Y[t-s])P(F[t]>Y[174])
162366.3-------
163391-------
164380.9-------
165431.4-------
166465.4-------
167471.5-------
168387.5-------
169446.4-------
170421.5-------
171504.8-------
172492.1-------
173421.3-------
174396.7-------
175428417.9624391.1409446.62310.24620.9270.96740.927
176421.9405.5914377.8742435.34160.14130.06990.94810.721
177465.6454.3399421.4125489.840.26710.96340.89730.9993
178525.8497.1347459.1054538.3140.08620.93330.93451
179499.9491.9947453.7591533.45220.35430.0550.83371
180435.3399.0994368.0076432.81820.017700.74990.5555
181479.5468.8919432.3001508.5810.30020.95140.86670.9998
182473435.2677401.2277472.19570.02260.00940.76750.9797
183554.4514.9902474.6723558.73260.03870.970.6761
184489.6491.3766452.8959533.12690.46680.00150.48651
185462.2446.9914411.9803484.97790.21630.0140.90750.9953
186420.3404.2912372.6177438.6570.18065e-040.66750.6675

\begin{tabular}{lllllllll}
\hline
Univariate ARIMA Extrapolation Forecast \tabularnewline
time & Y[t] & F[t] & 95% LB & 95% UB & p-value(H0: Y[t] = F[t]) & P(F[t]>Y[t-1]) & P(F[t]>Y[t-s]) & P(F[t]>Y[174]) \tabularnewline
162 & 366.3 & - & - & - & - & - & - & - \tabularnewline
163 & 391 & - & - & - & - & - & - & - \tabularnewline
164 & 380.9 & - & - & - & - & - & - & - \tabularnewline
165 & 431.4 & - & - & - & - & - & - & - \tabularnewline
166 & 465.4 & - & - & - & - & - & - & - \tabularnewline
167 & 471.5 & - & - & - & - & - & - & - \tabularnewline
168 & 387.5 & - & - & - & - & - & - & - \tabularnewline
169 & 446.4 & - & - & - & - & - & - & - \tabularnewline
170 & 421.5 & - & - & - & - & - & - & - \tabularnewline
171 & 504.8 & - & - & - & - & - & - & - \tabularnewline
172 & 492.1 & - & - & - & - & - & - & - \tabularnewline
173 & 421.3 & - & - & - & - & - & - & - \tabularnewline
174 & 396.7 & - & - & - & - & - & - & - \tabularnewline
175 & 428 & 417.9624 & 391.1409 & 446.6231 & 0.2462 & 0.927 & 0.9674 & 0.927 \tabularnewline
176 & 421.9 & 405.5914 & 377.8742 & 435.3416 & 0.1413 & 0.0699 & 0.9481 & 0.721 \tabularnewline
177 & 465.6 & 454.3399 & 421.4125 & 489.84 & 0.2671 & 0.9634 & 0.8973 & 0.9993 \tabularnewline
178 & 525.8 & 497.1347 & 459.1054 & 538.314 & 0.0862 & 0.9333 & 0.9345 & 1 \tabularnewline
179 & 499.9 & 491.9947 & 453.7591 & 533.4522 & 0.3543 & 0.055 & 0.8337 & 1 \tabularnewline
180 & 435.3 & 399.0994 & 368.0076 & 432.8182 & 0.0177 & 0 & 0.7499 & 0.5555 \tabularnewline
181 & 479.5 & 468.8919 & 432.3001 & 508.581 & 0.3002 & 0.9514 & 0.8667 & 0.9998 \tabularnewline
182 & 473 & 435.2677 & 401.2277 & 472.1957 & 0.0226 & 0.0094 & 0.7675 & 0.9797 \tabularnewline
183 & 554.4 & 514.9902 & 474.6723 & 558.7326 & 0.0387 & 0.97 & 0.676 & 1 \tabularnewline
184 & 489.6 & 491.3766 & 452.8959 & 533.1269 & 0.4668 & 0.0015 & 0.4865 & 1 \tabularnewline
185 & 462.2 & 446.9914 & 411.9803 & 484.9779 & 0.2163 & 0.014 & 0.9075 & 0.9953 \tabularnewline
186 & 420.3 & 404.2912 & 372.6177 & 438.657 & 0.1806 & 5e-04 & 0.6675 & 0.6675 \tabularnewline
\hline
\end{tabular}
%Source: https://freestatistics.org/blog/index.php?pk=69088&T=1

[TABLE]
[ROW][C]Univariate ARIMA Extrapolation Forecast[/C][/ROW]
[ROW][C]time[/C][C]Y[t][/C][C]F[t][/C][C]95% LB[/C][C]95% UB[/C][C]p-value(H0: Y[t] = F[t])[/C][C]P(F[t]>Y[t-1])[/C][C]P(F[t]>Y[t-s])[/C][C]P(F[t]>Y[174])[/C][/ROW]
[ROW][C]162[/C][C]366.3[/C][C]-[/C][C]-[/C][C]-[/C][C]-[/C][C]-[/C][C]-[/C][C]-[/C][/ROW]
[ROW][C]163[/C][C]391[/C][C]-[/C][C]-[/C][C]-[/C][C]-[/C][C]-[/C][C]-[/C][C]-[/C][/ROW]
[ROW][C]164[/C][C]380.9[/C][C]-[/C][C]-[/C][C]-[/C][C]-[/C][C]-[/C][C]-[/C][C]-[/C][/ROW]
[ROW][C]165[/C][C]431.4[/C][C]-[/C][C]-[/C][C]-[/C][C]-[/C][C]-[/C][C]-[/C][C]-[/C][/ROW]
[ROW][C]166[/C][C]465.4[/C][C]-[/C][C]-[/C][C]-[/C][C]-[/C][C]-[/C][C]-[/C][C]-[/C][/ROW]
[ROW][C]167[/C][C]471.5[/C][C]-[/C][C]-[/C][C]-[/C][C]-[/C][C]-[/C][C]-[/C][C]-[/C][/ROW]
[ROW][C]168[/C][C]387.5[/C][C]-[/C][C]-[/C][C]-[/C][C]-[/C][C]-[/C][C]-[/C][C]-[/C][/ROW]
[ROW][C]169[/C][C]446.4[/C][C]-[/C][C]-[/C][C]-[/C][C]-[/C][C]-[/C][C]-[/C][C]-[/C][/ROW]
[ROW][C]170[/C][C]421.5[/C][C]-[/C][C]-[/C][C]-[/C][C]-[/C][C]-[/C][C]-[/C][C]-[/C][/ROW]
[ROW][C]171[/C][C]504.8[/C][C]-[/C][C]-[/C][C]-[/C][C]-[/C][C]-[/C][C]-[/C][C]-[/C][/ROW]
[ROW][C]172[/C][C]492.1[/C][C]-[/C][C]-[/C][C]-[/C][C]-[/C][C]-[/C][C]-[/C][C]-[/C][/ROW]
[ROW][C]173[/C][C]421.3[/C][C]-[/C][C]-[/C][C]-[/C][C]-[/C][C]-[/C][C]-[/C][C]-[/C][/ROW]
[ROW][C]174[/C][C]396.7[/C][C]-[/C][C]-[/C][C]-[/C][C]-[/C][C]-[/C][C]-[/C][C]-[/C][/ROW]
[ROW][C]175[/C][C]428[/C][C]417.9624[/C][C]391.1409[/C][C]446.6231[/C][C]0.2462[/C][C]0.927[/C][C]0.9674[/C][C]0.927[/C][/ROW]
[ROW][C]176[/C][C]421.9[/C][C]405.5914[/C][C]377.8742[/C][C]435.3416[/C][C]0.1413[/C][C]0.0699[/C][C]0.9481[/C][C]0.721[/C][/ROW]
[ROW][C]177[/C][C]465.6[/C][C]454.3399[/C][C]421.4125[/C][C]489.84[/C][C]0.2671[/C][C]0.9634[/C][C]0.8973[/C][C]0.9993[/C][/ROW]
[ROW][C]178[/C][C]525.8[/C][C]497.1347[/C][C]459.1054[/C][C]538.314[/C][C]0.0862[/C][C]0.9333[/C][C]0.9345[/C][C]1[/C][/ROW]
[ROW][C]179[/C][C]499.9[/C][C]491.9947[/C][C]453.7591[/C][C]533.4522[/C][C]0.3543[/C][C]0.055[/C][C]0.8337[/C][C]1[/C][/ROW]
[ROW][C]180[/C][C]435.3[/C][C]399.0994[/C][C]368.0076[/C][C]432.8182[/C][C]0.0177[/C][C]0[/C][C]0.7499[/C][C]0.5555[/C][/ROW]
[ROW][C]181[/C][C]479.5[/C][C]468.8919[/C][C]432.3001[/C][C]508.581[/C][C]0.3002[/C][C]0.9514[/C][C]0.8667[/C][C]0.9998[/C][/ROW]
[ROW][C]182[/C][C]473[/C][C]435.2677[/C][C]401.2277[/C][C]472.1957[/C][C]0.0226[/C][C]0.0094[/C][C]0.7675[/C][C]0.9797[/C][/ROW]
[ROW][C]183[/C][C]554.4[/C][C]514.9902[/C][C]474.6723[/C][C]558.7326[/C][C]0.0387[/C][C]0.97[/C][C]0.676[/C][C]1[/C][/ROW]
[ROW][C]184[/C][C]489.6[/C][C]491.3766[/C][C]452.8959[/C][C]533.1269[/C][C]0.4668[/C][C]0.0015[/C][C]0.4865[/C][C]1[/C][/ROW]
[ROW][C]185[/C][C]462.2[/C][C]446.9914[/C][C]411.9803[/C][C]484.9779[/C][C]0.2163[/C][C]0.014[/C][C]0.9075[/C][C]0.9953[/C][/ROW]
[ROW][C]186[/C][C]420.3[/C][C]404.2912[/C][C]372.6177[/C][C]438.657[/C][C]0.1806[/C][C]5e-04[/C][C]0.6675[/C][C]0.6675[/C][/ROW]
[/TABLE]
Source: https://freestatistics.org/blog/index.php?pk=69088&T=1

Globally Unique Identifier (entire table): ba.freestatistics.org/blog/index.php?pk=69088&T=1

As an alternative you can also use a QR Code:  

The GUIDs for individual cells are displayed in the table below:

Univariate ARIMA Extrapolation Forecast
timeY[t]F[t]95% LB95% UBp-value(H0: Y[t] = F[t])P(F[t]>Y[t-1])P(F[t]>Y[t-s])P(F[t]>Y[174])
162366.3-------
163391-------
164380.9-------
165431.4-------
166465.4-------
167471.5-------
168387.5-------
169446.4-------
170421.5-------
171504.8-------
172492.1-------
173421.3-------
174396.7-------
175428417.9624391.1409446.62310.24620.9270.96740.927
176421.9405.5914377.8742435.34160.14130.06990.94810.721
177465.6454.3399421.4125489.840.26710.96340.89730.9993
178525.8497.1347459.1054538.3140.08620.93330.93451
179499.9491.9947453.7591533.45220.35430.0550.83371
180435.3399.0994368.0076432.81820.017700.74990.5555
181479.5468.8919432.3001508.5810.30020.95140.86670.9998
182473435.2677401.2277472.19570.02260.00940.76750.9797
183554.4514.9902474.6723558.73260.03870.970.6761
184489.6491.3766452.8959533.12690.46680.00150.48651
185462.2446.9914411.9803484.97790.21630.0140.90750.9953
186420.3404.2912372.6177438.6570.18065e-040.66750.6675


Univariate ARIMA Extrapolation Forecast Performance
time% S.E.PEMAPESq.EMSERMSE
1750.0350.0240100.754300
1760.03740.04020.0321265.97183.362113.5411
1770.03990.02480.0297126.791164.505112.826
1780.04230.05770.0367821.7021328.804318.133
1790.0430.01610.032562.4934275.542116.5995
1800.04310.09070.04221310.4816448.032121.1668
1810.04320.02260.0394112.5317400.103420.0026
1820.04330.08670.04531423.7274528.056422.9795
1830.04330.07650.04881553.1337641.953925.3368
1840.0433-0.00360.04433.1563578.074124.0432
1850.04340.0340.0434231.3011546.549323.3784
1860.04340.03960.043256.2818522.360422.8552

\begin{tabular}{lllllllll}
\hline
Univariate ARIMA Extrapolation Forecast Performance \tabularnewline
time & % S.E. & PE & MAPE & Sq.E & MSE & RMSE \tabularnewline
175 & 0.035 & 0.024 & 0 & 100.7543 & 0 & 0 \tabularnewline
176 & 0.0374 & 0.0402 & 0.0321 & 265.97 & 183.3621 & 13.5411 \tabularnewline
177 & 0.0399 & 0.0248 & 0.0297 & 126.791 & 164.5051 & 12.826 \tabularnewline
178 & 0.0423 & 0.0577 & 0.0367 & 821.7021 & 328.8043 & 18.133 \tabularnewline
179 & 0.043 & 0.0161 & 0.0325 & 62.4934 & 275.5421 & 16.5995 \tabularnewline
180 & 0.0431 & 0.0907 & 0.0422 & 1310.4816 & 448.0321 & 21.1668 \tabularnewline
181 & 0.0432 & 0.0226 & 0.0394 & 112.5317 & 400.1034 & 20.0026 \tabularnewline
182 & 0.0433 & 0.0867 & 0.0453 & 1423.7274 & 528.0564 & 22.9795 \tabularnewline
183 & 0.0433 & 0.0765 & 0.0488 & 1553.1337 & 641.9539 & 25.3368 \tabularnewline
184 & 0.0433 & -0.0036 & 0.0443 & 3.1563 & 578.0741 & 24.0432 \tabularnewline
185 & 0.0434 & 0.034 & 0.0434 & 231.3011 & 546.5493 & 23.3784 \tabularnewline
186 & 0.0434 & 0.0396 & 0.043 & 256.2818 & 522.3604 & 22.8552 \tabularnewline
\hline
\end{tabular}
%Source: https://freestatistics.org/blog/index.php?pk=69088&T=2

[TABLE]
[ROW][C]Univariate ARIMA Extrapolation Forecast Performance[/C][/ROW]
[ROW][C]time[/C][C]% S.E.[/C][C]PE[/C][C]MAPE[/C][C]Sq.E[/C][C]MSE[/C][C]RMSE[/C][/ROW]
[ROW][C]175[/C][C]0.035[/C][C]0.024[/C][C]0[/C][C]100.7543[/C][C]0[/C][C]0[/C][/ROW]
[ROW][C]176[/C][C]0.0374[/C][C]0.0402[/C][C]0.0321[/C][C]265.97[/C][C]183.3621[/C][C]13.5411[/C][/ROW]
[ROW][C]177[/C][C]0.0399[/C][C]0.0248[/C][C]0.0297[/C][C]126.791[/C][C]164.5051[/C][C]12.826[/C][/ROW]
[ROW][C]178[/C][C]0.0423[/C][C]0.0577[/C][C]0.0367[/C][C]821.7021[/C][C]328.8043[/C][C]18.133[/C][/ROW]
[ROW][C]179[/C][C]0.043[/C][C]0.0161[/C][C]0.0325[/C][C]62.4934[/C][C]275.5421[/C][C]16.5995[/C][/ROW]
[ROW][C]180[/C][C]0.0431[/C][C]0.0907[/C][C]0.0422[/C][C]1310.4816[/C][C]448.0321[/C][C]21.1668[/C][/ROW]
[ROW][C]181[/C][C]0.0432[/C][C]0.0226[/C][C]0.0394[/C][C]112.5317[/C][C]400.1034[/C][C]20.0026[/C][/ROW]
[ROW][C]182[/C][C]0.0433[/C][C]0.0867[/C][C]0.0453[/C][C]1423.7274[/C][C]528.0564[/C][C]22.9795[/C][/ROW]
[ROW][C]183[/C][C]0.0433[/C][C]0.0765[/C][C]0.0488[/C][C]1553.1337[/C][C]641.9539[/C][C]25.3368[/C][/ROW]
[ROW][C]184[/C][C]0.0433[/C][C]-0.0036[/C][C]0.0443[/C][C]3.1563[/C][C]578.0741[/C][C]24.0432[/C][/ROW]
[ROW][C]185[/C][C]0.0434[/C][C]0.034[/C][C]0.0434[/C][C]231.3011[/C][C]546.5493[/C][C]23.3784[/C][/ROW]
[ROW][C]186[/C][C]0.0434[/C][C]0.0396[/C][C]0.043[/C][C]256.2818[/C][C]522.3604[/C][C]22.8552[/C][/ROW]
[/TABLE]
Source: https://freestatistics.org/blog/index.php?pk=69088&T=2

Globally Unique Identifier (entire table): ba.freestatistics.org/blog/index.php?pk=69088&T=2

As an alternative you can also use a QR Code:  

The GUIDs for individual cells are displayed in the table below:

Univariate ARIMA Extrapolation Forecast Performance
time% S.E.PEMAPESq.EMSERMSE
1750.0350.0240100.754300
1760.03740.04020.0321265.97183.362113.5411
1770.03990.02480.0297126.791164.505112.826
1780.04230.05770.0367821.7021328.804318.133
1790.0430.01610.032562.4934275.542116.5995
1800.04310.09070.04221310.4816448.032121.1668
1810.04320.02260.0394112.5317400.103420.0026
1820.04330.08670.04531423.7274528.056422.9795
1830.04330.07650.04881553.1337641.953925.3368
1840.0433-0.00360.04433.1563578.074124.0432
1850.04340.0340.0434231.3011546.549323.3784
1860.04340.03960.043256.2818522.360422.8552


Parameters (Session):
par1 = FALSE ; par2 = 0.0 ; par3 = 1 ; par4 = 1 ; par5 = 12 ; par6 = 3 ; par7 = 0 ; par8 = 2 ; par9 = 1 ;
Parameters (R input):
par1 = 12 ; par2 = 0.0 ; par3 = 1 ; par4 = 1 ; par5 = 12 ; par6 = 3 ; par7 = 0 ; par8 = 0 ; par9 = 1 ; par10 = FALSE ;
R code (references can be found in the software module):
par1 <- as.numeric(par1) #cut off periods
par2 <- as.numeric(par2) #lambda
par3 <- as.numeric(par3) #degree of non-seasonal differencing
par4 <- as.numeric(par4) #degree of seasonal differencing
par5 <- as.numeric(par5) #seasonal period
par6 <- as.numeric(par6) #p
par7 <- as.numeric(par7) #q
par7 <- 3
par8 <- as.numeric(par8) #P
par9 <- as.numeric(par9) #Q
if (par10 == 'TRUE') par10 <- TRUE
if (par10 == 'FALSE') par10 <- FALSE
if (par2 == 0) x <- log(x)
if (par2 != 0) x <- x^par2
lx <- length(x)
first <- lx - 2*par1
nx <- lx - par1
nx1 <- nx + 1
fx <- lx - nx
if (fx < 1) {
fx <- par5
nx1 <- lx + fx - 1
first <- lx - 2*fx
}
first <- 1
if (fx < 3) fx <- round(lx/10,0)
(arima.out <- arima(x[1:nx], order=c(par6,par3,par7), seasonal=list(order=c(par8,par4,par9), period=par5), include.mean=par10, method='ML'))
(forecast <- predict(arima.out,par1))
(lb <- forecast$pred - 1.96 * forecast$se)
(ub <- forecast$pred + 1.96 * forecast$se)
if (par2 == 0) {
x <- exp(x)
forecast$pred <- exp(forecast$pred)
lb <- exp(lb)
ub <- exp(ub)
}
if (par2 != 0) {
x <- x^(1/par2)
forecast$pred <- forecast$pred^(1/par2)
lb <- lb^(1/par2)
ub <- ub^(1/par2)
}
if (par2 < 0) {
olb <- lb
lb <- ub
ub <- olb
}
(actandfor <- c(x[1:nx], forecast$pred))
(perc.se <- (ub-forecast$pred)/1.96/forecast$pred)
bitmap(file='test1.png')
opar <- par(mar=c(4,4,2,2),las=1)
ylim <- c( min(x[first:nx],lb), max(x[first:nx],ub))
plot(x,ylim=ylim,type='n',xlim=c(first,lx))
usr <- par('usr')
rect(usr[1],usr[3],nx+1,usr[4],border=NA,col='lemonchiffon')
rect(nx1,usr[3],usr[2],usr[4],border=NA,col='lavender')
abline(h= (-3:3)*2 , col ='gray', lty =3)
polygon( c(nx1:lx,lx:nx1), c(lb,rev(ub)), col = 'orange', lty=2,border=NA)
lines(nx1:lx, lb , lty=2)
lines(nx1:lx, ub , lty=2)
lines(x, lwd=2)
lines(nx1:lx, forecast$pred , lwd=2 , col ='white')
box()
par(opar)
dev.off()
prob.dec <- array(NA, dim=fx)
prob.sdec <- array(NA, dim=fx)
prob.ldec <- array(NA, dim=fx)
prob.pval <- array(NA, dim=fx)
perf.pe <- array(0, dim=fx)
perf.mape <- array(0, dim=fx)
perf.mape1 <- array(0, dim=fx)
perf.se <- array(0, dim=fx)
perf.mse <- array(0, dim=fx)
perf.mse1 <- array(0, dim=fx)
perf.rmse <- array(0, dim=fx)
for (i in 1:fx) {
locSD <- (ub[i] - forecast$pred[i]) / 1.96
perf.pe[i] = (x[nx+i] - forecast$pred[i]) / forecast$pred[i]
perf.se[i] = (x[nx+i] - forecast$pred[i])^2
prob.dec[i] = pnorm((x[nx+i-1] - forecast$pred[i]) / locSD)
prob.sdec[i] = pnorm((x[nx+i-par5] - forecast$pred[i]) / locSD)
prob.ldec[i] = pnorm((x[nx] - forecast$pred[i]) / locSD)
prob.pval[i] = pnorm(abs(x[nx+i] - forecast$pred[i]) / locSD)
}
perf.mape[1] = abs(perf.pe[1])
perf.mse[1] = abs(perf.se[1])
for (i in 2:fx) {
perf.mape[i] = perf.mape[i-1] + abs(perf.pe[i])
perf.mape1[i] = perf.mape[i] / i
perf.mse[i] = perf.mse[i-1] + perf.se[i]
perf.mse1[i] = perf.mse[i] / i
}
perf.rmse = sqrt(perf.mse1)
bitmap(file='test2.png')
plot(forecast$pred, pch=19, type='b',main='ARIMA Extrapolation Forecast', ylab='Forecast and 95% CI', xlab='time',ylim=c(min(lb),max(ub)))
dum <- forecast$pred
dum[1:par1] <- x[(nx+1):lx]
lines(dum, lty=1)
lines(ub,lty=3)
lines(lb,lty=3)
dev.off()
load(file='createtable')
a<-table.start()
a<-table.row.start(a)
a<-table.element(a,'Univariate ARIMA Extrapolation Forecast',9,TRUE)
a<-table.row.end(a)
a<-table.row.start(a)
a<-table.element(a,'time',1,header=TRUE)
a<-table.element(a,'Y[t]',1,header=TRUE)
a<-table.element(a,'F[t]',1,header=TRUE)
a<-table.element(a,'95% LB',1,header=TRUE)
a<-table.element(a,'95% UB',1,header=TRUE)
a<-table.element(a,'p-value
(H0: Y[t] = F[t])',1,header=TRUE)
a<-table.element(a,'P(F[t]>Y[t-1])',1,header=TRUE)
a<-table.element(a,'P(F[t]>Y[t-s])',1,header=TRUE)
mylab <- paste('P(F[t]>Y[',nx,sep='')
mylab <- paste(mylab,'])',sep='')
a<-table.element(a,mylab,1,header=TRUE)
a<-table.row.end(a)
for (i in (nx-par5):nx) {
a<-table.row.start(a)
a<-table.element(a,i,header=TRUE)
a<-table.element(a,x[i])
a<-table.element(a,'-')
a<-table.row.end(a)
}
for (i in 1:fx) {
a<-table.row.start(a)
a<-table.element(a,nx+i,header=TRUE)
a<-table.element(a,round(x[nx+i],4))
a<-table.element(a,round(forecast$pred[i],4))
a<-table.element(a,round(lb[i],4))
a<-table.element(a,round(ub[i],4))
a<-table.element(a,round((1-prob.pval[i]),4))
a<-table.element(a,round((1-prob.dec[i]),4))
a<-table.element(a,round((1-prob.sdec[i]),4))
a<-table.element(a,round((1-prob.ldec[i]),4))
a<-table.row.end(a)
}
a<-table.end(a)
table.save(a,file='mytable.tab')
a<-table.start()
a<-table.row.start(a)
a<-table.element(a,'Univariate ARIMA Extrapolation Forecast Performance',7,TRUE)
a<-table.row.end(a)
a<-table.row.start(a)
a<-table.element(a,'time',1,header=TRUE)
a<-table.element(a,'% S.E.',1,header=TRUE)
a<-table.element(a,'PE',1,header=TRUE)
a<-table.element(a,'MAPE',1,header=TRUE)
a<-table.element(a,'Sq.E',1,header=TRUE)
a<-table.element(a,'MSE',1,header=TRUE)
a<-table.element(a,'RMSE',1,header=TRUE)
a<-table.row.end(a)
for (i in 1:fx) {
a<-table.row.start(a)
a<-table.element(a,nx+i,header=TRUE)
a<-table.element(a,round(perc.se[i],4))
a<-table.element(a,round(perf.pe[i],4))
a<-table.element(a,round(perf.mape1[i],4))
a<-table.element(a,round(perf.se[i],4))
a<-table.element(a,round(perf.mse1[i],4))
a<-table.element(a,round(perf.rmse[i],4))
a<-table.row.end(a)
}
a<-table.end(a)
table.save(a,file='mytable1.tab')