Free Statistics
of Irreproducible Research!
Description of Statistical Computation | |||||||||||||||||||||||||||||||||||||||||||||||||||||||||||||||||||||||||||||||||||||||||||||||||||||||||||||||||||||||||||||||||||||||||||||||||||||||||||||||||||||||||||||||||||||||||||||||||||||||||
|---|---|---|---|---|---|---|---|---|---|---|---|---|---|---|---|---|---|---|---|---|---|---|---|---|---|---|---|---|---|---|---|---|---|---|---|---|---|---|---|---|---|---|---|---|---|---|---|---|---|---|---|---|---|---|---|---|---|---|---|---|---|---|---|---|---|---|---|---|---|---|---|---|---|---|---|---|---|---|---|---|---|---|---|---|---|---|---|---|---|---|---|---|---|---|---|---|---|---|---|---|---|---|---|---|---|---|---|---|---|---|---|---|---|---|---|---|---|---|---|---|---|---|---|---|---|---|---|---|---|---|---|---|---|---|---|---|---|---|---|---|---|---|---|---|---|---|---|---|---|---|---|---|---|---|---|---|---|---|---|---|---|---|---|---|---|---|---|---|---|---|---|---|---|---|---|---|---|---|---|---|---|---|---|---|---|---|---|---|---|---|---|---|---|---|---|---|---|---|---|---|---|
| Author's title | |||||||||||||||||||||||||||||||||||||||||||||||||||||||||||||||||||||||||||||||||||||||||||||||||||||||||||||||||||||||||||||||||||||||||||||||||||||||||||||||||||||||||||||||||||||||||||||||||||||||||
| Author | *The author of this computation has been verified* | ||||||||||||||||||||||||||||||||||||||||||||||||||||||||||||||||||||||||||||||||||||||||||||||||||||||||||||||||||||||||||||||||||||||||||||||||||||||||||||||||||||||||||||||||||||||||||||||||||||||||
| R Software Module | rwasp_notchedbox1.wasp | ||||||||||||||||||||||||||||||||||||||||||||||||||||||||||||||||||||||||||||||||||||||||||||||||||||||||||||||||||||||||||||||||||||||||||||||||||||||||||||||||||||||||||||||||||||||||||||||||||||||||
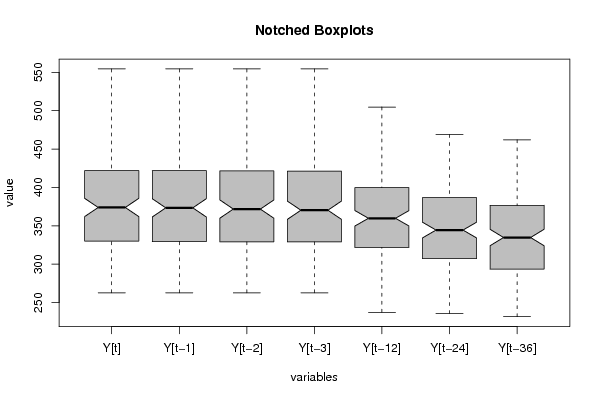
| Title produced by software | Notched Boxplots | ||||||||||||||||||||||||||||||||||||||||||||||||||||||||||||||||||||||||||||||||||||||||||||||||||||||||||||||||||||||||||||||||||||||||||||||||||||||||||||||||||||||||||||||||||||||||||||||||||||||||
| Date of computation | Thu, 17 Dec 2009 21:59:28 +0100 | ||||||||||||||||||||||||||||||||||||||||||||||||||||||||||||||||||||||||||||||||||||||||||||||||||||||||||||||||||||||||||||||||||||||||||||||||||||||||||||||||||||||||||||||||||||||||||||||||||||||||
| Cite this page as follows | Statistical Computations at FreeStatistics.org, Office for Research Development and Education, URL https://freestatistics.org/blog/index.php?v=date/2009/Dec/17/t126108360103pewgagp6i73mu.htm/, Retrieved Tue, 30 Apr 2024 05:13:42 +0000 | ||||||||||||||||||||||||||||||||||||||||||||||||||||||||||||||||||||||||||||||||||||||||||||||||||||||||||||||||||||||||||||||||||||||||||||||||||||||||||||||||||||||||||||||||||||||||||||||||||||||||
| Statistical Computations at FreeStatistics.org, Office for Research Development and Education, URL https://freestatistics.org/blog/index.php?pk=69109, Retrieved Tue, 30 Apr 2024 05:13:42 +0000 | |||||||||||||||||||||||||||||||||||||||||||||||||||||||||||||||||||||||||||||||||||||||||||||||||||||||||||||||||||||||||||||||||||||||||||||||||||||||||||||||||||||||||||||||||||||||||||||||||||||||||
| QR Codes: | |||||||||||||||||||||||||||||||||||||||||||||||||||||||||||||||||||||||||||||||||||||||||||||||||||||||||||||||||||||||||||||||||||||||||||||||||||||||||||||||||||||||||||||||||||||||||||||||||||||||||
|
| |||||||||||||||||||||||||||||||||||||||||||||||||||||||||||||||||||||||||||||||||||||||||||||||||||||||||||||||||||||||||||||||||||||||||||||||||||||||||||||||||||||||||||||||||||||||||||||||||||||||||
| Original text written by user: | |||||||||||||||||||||||||||||||||||||||||||||||||||||||||||||||||||||||||||||||||||||||||||||||||||||||||||||||||||||||||||||||||||||||||||||||||||||||||||||||||||||||||||||||||||||||||||||||||||||||||
| IsPrivate? | No (this computation is public) | ||||||||||||||||||||||||||||||||||||||||||||||||||||||||||||||||||||||||||||||||||||||||||||||||||||||||||||||||||||||||||||||||||||||||||||||||||||||||||||||||||||||||||||||||||||||||||||||||||||||||
| User-defined keywords | |||||||||||||||||||||||||||||||||||||||||||||||||||||||||||||||||||||||||||||||||||||||||||||||||||||||||||||||||||||||||||||||||||||||||||||||||||||||||||||||||||||||||||||||||||||||||||||||||||||||||
| Estimated Impact | 168 | ||||||||||||||||||||||||||||||||||||||||||||||||||||||||||||||||||||||||||||||||||||||||||||||||||||||||||||||||||||||||||||||||||||||||||||||||||||||||||||||||||||||||||||||||||||||||||||||||||||||||
Tree of Dependent Computations | |||||||||||||||||||||||||||||||||||||||||||||||||||||||||||||||||||||||||||||||||||||||||||||||||||||||||||||||||||||||||||||||||||||||||||||||||||||||||||||||||||||||||||||||||||||||||||||||||||||||||
| Family? (F = Feedback message, R = changed R code, M = changed R Module, P = changed Parameters, D = changed Data) | |||||||||||||||||||||||||||||||||||||||||||||||||||||||||||||||||||||||||||||||||||||||||||||||||||||||||||||||||||||||||||||||||||||||||||||||||||||||||||||||||||||||||||||||||||||||||||||||||||||||||
| - [Univariate Data Series] [] [2009-12-17 19:09:08] [b98453cac15ba1066b407e146608df68] - RMPD [Notched Boxplots] [] [2009-12-17 20:59:28] [d76b387543b13b5e3afd8ff9e5fdc89f] [Current] | |||||||||||||||||||||||||||||||||||||||||||||||||||||||||||||||||||||||||||||||||||||||||||||||||||||||||||||||||||||||||||||||||||||||||||||||||||||||||||||||||||||||||||||||||||||||||||||||||||||||||
| Feedback Forum | |||||||||||||||||||||||||||||||||||||||||||||||||||||||||||||||||||||||||||||||||||||||||||||||||||||||||||||||||||||||||||||||||||||||||||||||||||||||||||||||||||||||||||||||||||||||||||||||||||||||||
Post a new message | |||||||||||||||||||||||||||||||||||||||||||||||||||||||||||||||||||||||||||||||||||||||||||||||||||||||||||||||||||||||||||||||||||||||||||||||||||||||||||||||||||||||||||||||||||||||||||||||||||||||||
Dataset | |||||||||||||||||||||||||||||||||||||||||||||||||||||||||||||||||||||||||||||||||||||||||||||||||||||||||||||||||||||||||||||||||||||||||||||||||||||||||||||||||||||||||||||||||||||||||||||||||||||||||
| Dataseries X: | |||||||||||||||||||||||||||||||||||||||||||||||||||||||||||||||||||||||||||||||||||||||||||||||||||||||||||||||||||||||||||||||||||||||||||||||||||||||||||||||||||||||||||||||||||||||||||||||||||||||||
322.7 265.7 318.8 340.9 295.5 294.1 277 281.6 322.7 265.7 318.8 258.2 267.5 260.6 323.5 281.6 322.7 265.7 306.1 309.7 291.6 312.6 323.5 281.6 322.7 281.5 280.7 275.4 310.8 312.6 323.5 281.6 283.1 287.3 275.3 262.8 310.8 312.6 323.5 237.4 235.7 231.7 273.8 262.8 310.8 312.6 274.8 256.4 238.8 320 273.8 262.8 310.8 299.3 289 274.2 310.3 320 273.8 262.8 300.4 290.8 277.8 342.2 310.3 320 273.8 340.9 321.9 299.1 320.1 342.2 310.3 320 318.8 291.8 286.6 265.6 320.1 342.2 310.3 265.7 241.4 232.3 327 265.6 320.1 342.2 322.7 295.5 294.1 300.7 327 265.6 320.1 281.6 258.2 267.5 346.4 300.7 327 265.6 323.5 306.1 309.7 317.3 346.4 300.7 327 312.6 281.5 280.7 326.2 317.3 346.4 300.7 310.8 283.1 287.3 270.7 326.2 317.3 346.4 262.8 237.4 235.7 278.2 270.7 326.2 317.3 273.8 274.8 256.4 324.6 278.2 270.7 326.2 320 299.3 289 321.8 324.6 278.2 270.7 310.3 300.4 290.8 343.5 321.8 324.6 278.2 342.2 340.9 321.9 354 343.5 321.8 324.6 320.1 318.8 291.8 278.2 354 343.5 321.8 265.6 265.7 241.4 330.2 278.2 354 343.5 327 322.7 295.5 307.3 330.2 278.2 354 300.7 281.6 258.2 375.9 307.3 330.2 278.2 346.4 323.5 306.1 335.3 375.9 307.3 330.2 317.3 312.6 281.5 339.3 335.3 375.9 307.3 326.2 310.8 283.1 280.3 339.3 335.3 375.9 270.7 262.8 237.4 293.7 280.3 339.3 335.3 278.2 273.8 274.8 341.2 293.7 280.3 339.3 324.6 320 299.3 345.1 341.2 293.7 280.3 321.8 310.3 300.4 368.7 345.1 341.2 293.7 343.5 342.2 340.9 369.4 368.7 345.1 341.2 354 320.1 318.8 288.4 369.4 368.7 345.1 278.2 265.6 265.7 341 288.4 369.4 368.7 330.2 327 322.7 319.1 341 288.4 369.4 307.3 300.7 281.6 374.2 319.1 341 288.4 375.9 346.4 323.5 344.5 374.2 319.1 341 335.3 317.3 312.6 337.3 344.5 374.2 319.1 339.3 326.2 310.8 281 337.3 344.5 374.2 280.3 270.7 262.8 282.2 281 337.3 344.5 293.7 278.2 273.8 321 282.2 281 337.3 341.2 324.6 320 325.4 321 282.2 281 345.1 321.8 310.3 366.3 325.4 321 282.2 368.7 343.5 342.2 380.3 366.3 325.4 321 369.4 354 320.1 300.7 380.3 366.3 325.4 288.4 278.2 265.6 359.3 300.7 380.3 366.3 341 330.2 327 327.6 359.3 300.7 380.3 319.1 307.3 300.7 383.6 327.6 359.3 300.7 374.2 375.9 346.4 352.4 383.6 327.6 359.3 344.5 335.3 317.3 329.4 352.4 383.6 327.6 337.3 339.3 326.2 294.5 329.4 352.4 383.6 281 280.3 270.7 333.5 294.5 329.4 352.4 282.2 293.7 278.2 334.3 333.5 294.5 329.4 321 341.2 324.6 358 334.3 333.5 294.5 325.4 345.1 321.8 396.1 358 334.3 333.5 366.3 368.7 343.5 387 396.1 358 334.3 380.3 369.4 354 307.2 387 396.1 358 300.7 288.4 278.2 363.9 307.2 387 396.1 359.3 341 330.2 344.7 363.9 307.2 387 327.6 319.1 307.3 397.6 344.7 363.9 307.2 383.6 374.2 375.9 376.8 397.6 344.7 363.9 352.4 344.5 335.3 337.1 376.8 397.6 344.7 329.4 337.3 339.3 299.3 337.1 376.8 397.6 294.5 281 280.3 323.1 299.3 337.1 376.8 333.5 282.2 293.7 329.1 323.1 299.3 337.1 334.3 321 341.2 347 329.1 323.1 299.3 358 325.4 345.1 462 347 329.1 323.1 396.1 366.3 368.7 436.5 462 347 329.1 387 380.3 369.4 360.4 436.5 462 347 307.2 300.7 288.4 415.5 360.4 436.5 462 363.9 359.3 341 382.1 415.5 360.4 436.5 344.7 327.6 319.1 432.2 382.1 415.5 360.4 397.6 383.6 374.2 424.3 432.2 382.1 415.5 376.8 352.4 344.5 386.7 424.3 432.2 382.1 337.1 329.4 337.3 354.5 386.7 424.3 432.2 299.3 294.5 281 375.8 354.5 386.7 424.3 323.1 333.5 282.2 368 375.8 354.5 386.7 329.1 334.3 321 402.4 368 375.8 354.5 347 358 325.4 426.5 402.4 368 375.8 462 396.1 366.3 433.3 426.5 402.4 368 436.5 387 380.3 338.5 433.3 426.5 402.4 360.4 307.2 300.7 416.8 338.5 433.3 426.5 415.5 363.9 359.3 381.1 416.8 338.5 433.3 382.1 344.7 327.6 445.7 381.1 416.8 338.5 432.2 397.6 383.6 412.4 445.7 381.1 416.8 424.3 376.8 352.4 394 412.4 445.7 381.1 386.7 337.1 329.4 348.2 394 412.4 445.7 354.5 299.3 294.5 380.1 348.2 394 412.4 375.8 323.1 333.5 373.7 380.1 348.2 394 368 329.1 334.3 393.6 373.7 380.1 348.2 402.4 347 358 434.2 393.6 373.7 380.1 426.5 462 396.1 430.7 434.2 393.6 373.7 433.3 436.5 387 344.5 430.7 434.2 393.6 338.5 360.4 307.2 411.9 344.5 430.7 434.2 416.8 415.5 363.9 370.5 411.9 344.5 430.7 381.1 382.1 344.7 437.3 370.5 411.9 344.5 445.7 432.2 397.6 411.3 437.3 370.5 411.9 412.4 424.3 376.8 385.5 411.3 437.3 370.5 394 386.7 337.1 341.3 385.5 411.3 437.3 348.2 354.5 299.3 384.2 341.3 385.5 411.3 380.1 375.8 323.1 373.2 384.2 341.3 385.5 373.7 368 329.1 415.8 373.2 384.2 341.3 393.6 402.4 347 448.6 415.8 373.2 384.2 434.2 426.5 462 454.3 448.6 415.8 373.2 430.7 433.3 436.5 350.3 454.3 448.6 415.8 344.5 338.5 360.4 419.1 350.3 454.3 448.6 411.9 416.8 415.5 398 419.1 350.3 454.3 370.5 381.1 382.1 456.1 398 419.1 350.3 437.3 445.7 432.2 430.1 456.1 398 419.1 411.3 412.4 424.3 399.8 430.1 456.1 398 385.5 394 386.7 362.7 399.8 430.1 456.1 341.3 348.2 354.5 384.9 362.7 399.8 430.1 384.2 380.1 375.8 385.3 384.9 362.7 399.8 373.2 373.7 368 432.3 385.3 384.9 362.7 415.8 393.6 402.4 468.9 432.3 385.3 384.9 448.6 434.2 426.5 442.7 468.9 432.3 385.3 454.3 430.7 433.3 370.2 442.7 468.9 432.3 350.3 344.5 338.5 439.4 370.2 442.7 468.9 419.1 411.9 416.8 393.9 439.4 370.2 442.7 398 370.5 381.1 468.7 393.9 439.4 370.2 456.1 437.3 445.7 438.8 468.7 393.9 439.4 430.1 411.3 412.4 430.1 438.8 468.7 393.9 399.8 385.5 394 366.3 430.1 438.8 468.7 362.7 341.3 348.2 391 366.3 430.1 438.8 384.9 384.2 380.1 380.9 391 366.3 430.1 385.3 373.2 373.7 431.4 380.9 391 366.3 432.3 415.8 393.6 465.4 431.4 380.9 391 468.9 448.6 434.2 471.5 465.4 431.4 380.9 442.7 454.3 430.7 387.5 471.5 465.4 431.4 370.2 350.3 344.5 446.4 387.5 471.5 465.4 439.4 419.1 411.9 421.5 446.4 387.5 471.5 393.9 398 370.5 504.8 421.5 446.4 387.5 468.7 456.1 437.3 492.1 504.8 421.5 446.4 438.8 430.1 411.3 421.3 492.1 504.8 421.5 430.1 399.8 385.5 396.7 421.3 492.1 504.8 366.3 362.7 341.3 428 396.7 421.3 492.1 391 384.9 384.2 421.9 428 396.7 421.3 380.9 385.3 373.2 465.6 421.9 428 396.7 431.4 432.3 415.8 525.8 465.6 421.9 428 465.4 468.9 448.6 499.9 525.8 465.6 421.9 471.5 442.7 454.3 435.3 499.9 525.8 465.6 387.5 370.2 350.3 479.5 435.3 499.9 525.8 446.4 439.4 419.1 473 479.5 435.3 499.9 421.5 393.9 398 554.4 473 479.5 435.3 504.8 468.7 456.1 489.6 554.4 473 479.5 492.1 438.8 430.1 462.2 489.6 554.4 473 421.3 430.1 399.8 420.3 462.2 489.6 554.4 396.7 366.3 362.7 | |||||||||||||||||||||||||||||||||||||||||||||||||||||||||||||||||||||||||||||||||||||||||||||||||||||||||||||||||||||||||||||||||||||||||||||||||||||||||||||||||||||||||||||||||||||||||||||||||||||||||
Tables (Output of Computation) | |||||||||||||||||||||||||||||||||||||||||||||||||||||||||||||||||||||||||||||||||||||||||||||||||||||||||||||||||||||||||||||||||||||||||||||||||||||||||||||||||||||||||||||||||||||||||||||||||||||||||
| |||||||||||||||||||||||||||||||||||||||||||||||||||||||||||||||||||||||||||||||||||||||||||||||||||||||||||||||||||||||||||||||||||||||||||||||||||||||||||||||||||||||||||||||||||||||||||||||||||||||||
Figures (Output of Computation) | |||||||||||||||||||||||||||||||||||||||||||||||||||||||||||||||||||||||||||||||||||||||||||||||||||||||||||||||||||||||||||||||||||||||||||||||||||||||||||||||||||||||||||||||||||||||||||||||||||||||||
Input Parameters & R Code | |||||||||||||||||||||||||||||||||||||||||||||||||||||||||||||||||||||||||||||||||||||||||||||||||||||||||||||||||||||||||||||||||||||||||||||||||||||||||||||||||||||||||||||||||||||||||||||||||||||||||
| Parameters (Session): | |||||||||||||||||||||||||||||||||||||||||||||||||||||||||||||||||||||||||||||||||||||||||||||||||||||||||||||||||||||||||||||||||||||||||||||||||||||||||||||||||||||||||||||||||||||||||||||||||||||||||
| par1 = FALSE ; par2 = 0.0 ; par3 = 1 ; par4 = 1 ; par5 = 12 ; par6 = 3 ; par7 = 0 ; par8 = 2 ; par9 = 1 ; | |||||||||||||||||||||||||||||||||||||||||||||||||||||||||||||||||||||||||||||||||||||||||||||||||||||||||||||||||||||||||||||||||||||||||||||||||||||||||||||||||||||||||||||||||||||||||||||||||||||||||
| Parameters (R input): | |||||||||||||||||||||||||||||||||||||||||||||||||||||||||||||||||||||||||||||||||||||||||||||||||||||||||||||||||||||||||||||||||||||||||||||||||||||||||||||||||||||||||||||||||||||||||||||||||||||||||
| par1 = grey ; | |||||||||||||||||||||||||||||||||||||||||||||||||||||||||||||||||||||||||||||||||||||||||||||||||||||||||||||||||||||||||||||||||||||||||||||||||||||||||||||||||||||||||||||||||||||||||||||||||||||||||
| R code (references can be found in the software module): | |||||||||||||||||||||||||||||||||||||||||||||||||||||||||||||||||||||||||||||||||||||||||||||||||||||||||||||||||||||||||||||||||||||||||||||||||||||||||||||||||||||||||||||||||||||||||||||||||||||||||
z <- as.data.frame(t(y)) | |||||||||||||||||||||||||||||||||||||||||||||||||||||||||||||||||||||||||||||||||||||||||||||||||||||||||||||||||||||||||||||||||||||||||||||||||||||||||||||||||||||||||||||||||||||||||||||||||||||||||