Free Statistics

of Irreproducible Research!

Author's title

Author*The author of this computation has been verified*
R Software Modulerwasp_arimabackwardselection.wasp
Title produced by softwareARIMA Backward Selection
Date of computationFri, 18 Dec 2009 03:36:52 -0700
Cite this page as followsStatistical Computations at FreeStatistics.org, Office for Research Development and Education, URL https://freestatistics.org/blog/index.php?v=date/2009/Dec/18/t12611326782lhj2p8p1ekh4f7.htm/, Retrieved Sat, 27 Apr 2024 08:34:33 +0000
Statistical Computations at FreeStatistics.org, Office for Research Development and Education, URL https://freestatistics.org/blog/index.php?pk=69213, Retrieved Sat, 27 Apr 2024 08:34:33 +0000
QR Codes:

Original text written by user:
IsPrivate?No (this computation is public)
User-defined keywordsshwpaper22
Estimated Impact124
Family? (F = Feedback message, R = changed R code, M = changed R Module, P = changed Parameters, D = changed Data)
-     [ARIMA Backward Selection] [] [2009-12-18 10:19:10] [ebd107afac1bd6180acb277edd05815b]
-    D    [ARIMA Backward Selection] [] [2009-12-18 10:36:52] [4407d6264e55b051ec65750e6dca2820] [Current]
Feedback Forum

Post a new message
Dataseries X:
14497
14398.3
16629.6
16670.7
16614.8
16869.2
15663.9
16359.9
18447.7
16889
16505
18320.9
15052.1
15699.8
18135.3
16768.7
18883
19021
18101.9
17776.1
21489.9
17065.3
18690
18953.1
16398.9
16895.6
18553
19270
19422.1
17579.4
18637.3
18076.7
20438.6
18075.2
19563
19899.2
19227.5
17789.6
19220.8
21968.9
21131.5
19484.6
22168.7
20866.8
22176.2
23533.8
21479.6
24347.7
22751.6
20328.3
23650.4
23335.7
19614.9
18042.3
17282.5
16847.2
18159.5
16540.9
15952.7
18357.8
16394.3


Summary of computational transaction
Raw Inputview raw input (R code)
Raw Outputview raw output of R engine
Computing time8 seconds
R Server'Gwilym Jenkins' @ 72.249.127.135

\begin{tabular}{lllllllll}
\hline
Summary of computational transaction \tabularnewline
Raw Input & view raw input (R code)  \tabularnewline
Raw Output & view raw output of R engine  \tabularnewline
Computing time & 8 seconds \tabularnewline
R Server & 'Gwilym Jenkins' @ 72.249.127.135 \tabularnewline
\hline
\end{tabular}
%Source: https://freestatistics.org/blog/index.php?pk=69213&T=0

[TABLE]
[ROW][C]Summary of computational transaction[/C][/ROW]
[ROW][C]Raw Input[/C][C]view raw input (R code) [/C][/ROW]
[ROW][C]Raw Output[/C][C]view raw output of R engine [/C][/ROW]
[ROW][C]Computing time[/C][C]8 seconds[/C][/ROW]
[ROW][C]R Server[/C][C]'Gwilym Jenkins' @ 72.249.127.135[/C][/ROW]
[/TABLE]
Source: https://freestatistics.org/blog/index.php?pk=69213&T=0

Globally Unique Identifier (entire table): ba.freestatistics.org/blog/index.php?pk=69213&T=0

As an alternative you can also use a QR Code:  

The GUIDs for individual cells are displayed in the table below:

Summary of computational transaction
Raw Inputview raw input (R code)
Raw Outputview raw output of R engine
Computing time8 seconds
R Server'Gwilym Jenkins' @ 72.249.127.135


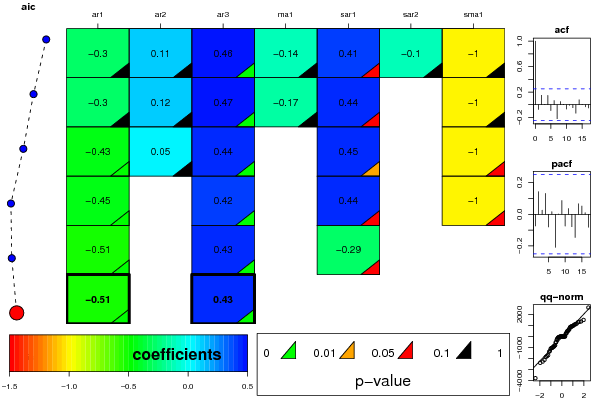
ARIMA Parameter Estimation and Backward Selection
Iterationar1ar2ar3ma1sar1sar2sma1
Estimates ( 1 )-0.29970.11370.4611-0.13970.409-0.1032-0.9999
(p-val)(0.1957 )(0.4827 )(6e-04 )(0.6016 )(0.0938 )(0.7514 )(0.2038 )
Estimates ( 2 )-0.29990.12130.4704-0.16830.44210-0.9998
(p-val)(0.1809 )(0.4486 )(3e-04 )(0.4867 )(0.0529 )(NA )(0.1013 )
Estimates ( 3 )-0.43170.05290.441800.45150-1.0002
(p-val)(0.0011 )(0.7104 )(7e-04 )(NA )(0.0454 )(NA )(0.0624 )
Estimates ( 4 )-0.451900.419100.43820-1.0001
(p-val)(2e-04 )(NA )(2e-04 )(NA )(0.052 )(NA )(0.0725 )
Estimates ( 5 )-0.512600.42580-0.287500
(p-val)(0 )(NA )(1e-04 )(NA )(0.0887 )(NA )(NA )
Estimates ( 6 )-0.506400.42850000
(p-val)(0 )(NA )(1e-04 )(NA )(NA )(NA )(NA )
Estimates ( 7 )NANANANANANANA
(p-val)(NA )(NA )(NA )(NA )(NA )(NA )(NA )
Estimates ( 8 )NANANANANANANA
(p-val)(NA )(NA )(NA )(NA )(NA )(NA )(NA )
Estimates ( 9 )NANANANANANANA
(p-val)(NA )(NA )(NA )(NA )(NA )(NA )(NA )
Estimates ( 10 )NANANANANANANA
(p-val)(NA )(NA )(NA )(NA )(NA )(NA )(NA )
Estimates ( 11 )NANANANANANANA
(p-val)(NA )(NA )(NA )(NA )(NA )(NA )(NA )
Estimates ( 12 )NANANANANANANA
(p-val)(NA )(NA )(NA )(NA )(NA )(NA )(NA )
Estimates ( 13 )NANANANANANANA
(p-val)(NA )(NA )(NA )(NA )(NA )(NA )(NA )

\begin{tabular}{lllllllll}
\hline
ARIMA Parameter Estimation and Backward Selection \tabularnewline
Iteration & ar1 & ar2 & ar3 & ma1 & sar1 & sar2 & sma1 \tabularnewline
Estimates ( 1 ) & -0.2997 & 0.1137 & 0.4611 & -0.1397 & 0.409 & -0.1032 & -0.9999 \tabularnewline
(p-val) & (0.1957 ) & (0.4827 ) & (6e-04 ) & (0.6016 ) & (0.0938 ) & (0.7514 ) & (0.2038 ) \tabularnewline
Estimates ( 2 ) & -0.2999 & 0.1213 & 0.4704 & -0.1683 & 0.4421 & 0 & -0.9998 \tabularnewline
(p-val) & (0.1809 ) & (0.4486 ) & (3e-04 ) & (0.4867 ) & (0.0529 ) & (NA ) & (0.1013 ) \tabularnewline
Estimates ( 3 ) & -0.4317 & 0.0529 & 0.4418 & 0 & 0.4515 & 0 & -1.0002 \tabularnewline
(p-val) & (0.0011 ) & (0.7104 ) & (7e-04 ) & (NA ) & (0.0454 ) & (NA ) & (0.0624 ) \tabularnewline
Estimates ( 4 ) & -0.4519 & 0 & 0.4191 & 0 & 0.4382 & 0 & -1.0001 \tabularnewline
(p-val) & (2e-04 ) & (NA ) & (2e-04 ) & (NA ) & (0.052 ) & (NA ) & (0.0725 ) \tabularnewline
Estimates ( 5 ) & -0.5126 & 0 & 0.4258 & 0 & -0.2875 & 0 & 0 \tabularnewline
(p-val) & (0 ) & (NA ) & (1e-04 ) & (NA ) & (0.0887 ) & (NA ) & (NA ) \tabularnewline
Estimates ( 6 ) & -0.5064 & 0 & 0.4285 & 0 & 0 & 0 & 0 \tabularnewline
(p-val) & (0 ) & (NA ) & (1e-04 ) & (NA ) & (NA ) & (NA ) & (NA ) \tabularnewline
Estimates ( 7 ) & NA & NA & NA & NA & NA & NA & NA \tabularnewline
(p-val) & (NA ) & (NA ) & (NA ) & (NA ) & (NA ) & (NA ) & (NA ) \tabularnewline
Estimates ( 8 ) & NA & NA & NA & NA & NA & NA & NA \tabularnewline
(p-val) & (NA ) & (NA ) & (NA ) & (NA ) & (NA ) & (NA ) & (NA ) \tabularnewline
Estimates ( 9 ) & NA & NA & NA & NA & NA & NA & NA \tabularnewline
(p-val) & (NA ) & (NA ) & (NA ) & (NA ) & (NA ) & (NA ) & (NA ) \tabularnewline
Estimates ( 10 ) & NA & NA & NA & NA & NA & NA & NA \tabularnewline
(p-val) & (NA ) & (NA ) & (NA ) & (NA ) & (NA ) & (NA ) & (NA ) \tabularnewline
Estimates ( 11 ) & NA & NA & NA & NA & NA & NA & NA \tabularnewline
(p-val) & (NA ) & (NA ) & (NA ) & (NA ) & (NA ) & (NA ) & (NA ) \tabularnewline
Estimates ( 12 ) & NA & NA & NA & NA & NA & NA & NA \tabularnewline
(p-val) & (NA ) & (NA ) & (NA ) & (NA ) & (NA ) & (NA ) & (NA ) \tabularnewline
Estimates ( 13 ) & NA & NA & NA & NA & NA & NA & NA \tabularnewline
(p-val) & (NA ) & (NA ) & (NA ) & (NA ) & (NA ) & (NA ) & (NA ) \tabularnewline
\hline
\end{tabular}
%Source: https://freestatistics.org/blog/index.php?pk=69213&T=1

[TABLE]
[ROW][C]ARIMA Parameter Estimation and Backward Selection[/C][/ROW]
[ROW][C]Iteration[/C][C]ar1[/C][C]ar2[/C][C]ar3[/C][C]ma1[/C][C]sar1[/C][C]sar2[/C][C]sma1[/C][/ROW]
[ROW][C]Estimates ( 1 )[/C][C]-0.2997[/C][C]0.1137[/C][C]0.4611[/C][C]-0.1397[/C][C]0.409[/C][C]-0.1032[/C][C]-0.9999[/C][/ROW]
[ROW][C](p-val)[/C][C](0.1957 )[/C][C](0.4827 )[/C][C](6e-04 )[/C][C](0.6016 )[/C][C](0.0938 )[/C][C](0.7514 )[/C][C](0.2038 )[/C][/ROW]
[ROW][C]Estimates ( 2 )[/C][C]-0.2999[/C][C]0.1213[/C][C]0.4704[/C][C]-0.1683[/C][C]0.4421[/C][C]0[/C][C]-0.9998[/C][/ROW]
[ROW][C](p-val)[/C][C](0.1809 )[/C][C](0.4486 )[/C][C](3e-04 )[/C][C](0.4867 )[/C][C](0.0529 )[/C][C](NA )[/C][C](0.1013 )[/C][/ROW]
[ROW][C]Estimates ( 3 )[/C][C]-0.4317[/C][C]0.0529[/C][C]0.4418[/C][C]0[/C][C]0.4515[/C][C]0[/C][C]-1.0002[/C][/ROW]
[ROW][C](p-val)[/C][C](0.0011 )[/C][C](0.7104 )[/C][C](7e-04 )[/C][C](NA )[/C][C](0.0454 )[/C][C](NA )[/C][C](0.0624 )[/C][/ROW]
[ROW][C]Estimates ( 4 )[/C][C]-0.4519[/C][C]0[/C][C]0.4191[/C][C]0[/C][C]0.4382[/C][C]0[/C][C]-1.0001[/C][/ROW]
[ROW][C](p-val)[/C][C](2e-04 )[/C][C](NA )[/C][C](2e-04 )[/C][C](NA )[/C][C](0.052 )[/C][C](NA )[/C][C](0.0725 )[/C][/ROW]
[ROW][C]Estimates ( 5 )[/C][C]-0.5126[/C][C]0[/C][C]0.4258[/C][C]0[/C][C]-0.2875[/C][C]0[/C][C]0[/C][/ROW]
[ROW][C](p-val)[/C][C](0 )[/C][C](NA )[/C][C](1e-04 )[/C][C](NA )[/C][C](0.0887 )[/C][C](NA )[/C][C](NA )[/C][/ROW]
[ROW][C]Estimates ( 6 )[/C][C]-0.5064[/C][C]0[/C][C]0.4285[/C][C]0[/C][C]0[/C][C]0[/C][C]0[/C][/ROW]
[ROW][C](p-val)[/C][C](0 )[/C][C](NA )[/C][C](1e-04 )[/C][C](NA )[/C][C](NA )[/C][C](NA )[/C][C](NA )[/C][/ROW]
[ROW][C]Estimates ( 7 )[/C][C]NA[/C][C]NA[/C][C]NA[/C][C]NA[/C][C]NA[/C][C]NA[/C][C]NA[/C][/ROW]
[ROW][C](p-val)[/C][C](NA )[/C][C](NA )[/C][C](NA )[/C][C](NA )[/C][C](NA )[/C][C](NA )[/C][C](NA )[/C][/ROW]
[ROW][C]Estimates ( 8 )[/C][C]NA[/C][C]NA[/C][C]NA[/C][C]NA[/C][C]NA[/C][C]NA[/C][C]NA[/C][/ROW]
[ROW][C](p-val)[/C][C](NA )[/C][C](NA )[/C][C](NA )[/C][C](NA )[/C][C](NA )[/C][C](NA )[/C][C](NA )[/C][/ROW]
[ROW][C]Estimates ( 9 )[/C][C]NA[/C][C]NA[/C][C]NA[/C][C]NA[/C][C]NA[/C][C]NA[/C][C]NA[/C][/ROW]
[ROW][C](p-val)[/C][C](NA )[/C][C](NA )[/C][C](NA )[/C][C](NA )[/C][C](NA )[/C][C](NA )[/C][C](NA )[/C][/ROW]
[ROW][C]Estimates ( 10 )[/C][C]NA[/C][C]NA[/C][C]NA[/C][C]NA[/C][C]NA[/C][C]NA[/C][C]NA[/C][/ROW]
[ROW][C](p-val)[/C][C](NA )[/C][C](NA )[/C][C](NA )[/C][C](NA )[/C][C](NA )[/C][C](NA )[/C][C](NA )[/C][/ROW]
[ROW][C]Estimates ( 11 )[/C][C]NA[/C][C]NA[/C][C]NA[/C][C]NA[/C][C]NA[/C][C]NA[/C][C]NA[/C][/ROW]
[ROW][C](p-val)[/C][C](NA )[/C][C](NA )[/C][C](NA )[/C][C](NA )[/C][C](NA )[/C][C](NA )[/C][C](NA )[/C][/ROW]
[ROW][C]Estimates ( 12 )[/C][C]NA[/C][C]NA[/C][C]NA[/C][C]NA[/C][C]NA[/C][C]NA[/C][C]NA[/C][/ROW]
[ROW][C](p-val)[/C][C](NA )[/C][C](NA )[/C][C](NA )[/C][C](NA )[/C][C](NA )[/C][C](NA )[/C][C](NA )[/C][/ROW]
[ROW][C]Estimates ( 13 )[/C][C]NA[/C][C]NA[/C][C]NA[/C][C]NA[/C][C]NA[/C][C]NA[/C][C]NA[/C][/ROW]
[ROW][C](p-val)[/C][C](NA )[/C][C](NA )[/C][C](NA )[/C][C](NA )[/C][C](NA )[/C][C](NA )[/C][C](NA )[/C][/ROW]
[/TABLE]
Source: https://freestatistics.org/blog/index.php?pk=69213&T=1

Globally Unique Identifier (entire table): ba.freestatistics.org/blog/index.php?pk=69213&T=1

As an alternative you can also use a QR Code:  

The GUIDs for individual cells are displayed in the table below:

ARIMA Parameter Estimation and Backward Selection
Iterationar1ar2ar3ma1sar1sar2sma1
Estimates ( 1 )-0.29970.11370.4611-0.13970.409-0.1032-0.9999
(p-val)(0.1957 )(0.4827 )(6e-04 )(0.6016 )(0.0938 )(0.7514 )(0.2038 )
Estimates ( 2 )-0.29990.12130.4704-0.16830.44210-0.9998
(p-val)(0.1809 )(0.4486 )(3e-04 )(0.4867 )(0.0529 )(NA )(0.1013 )
Estimates ( 3 )-0.43170.05290.441800.45150-1.0002
(p-val)(0.0011 )(0.7104 )(7e-04 )(NA )(0.0454 )(NA )(0.0624 )
Estimates ( 4 )-0.451900.419100.43820-1.0001
(p-val)(2e-04 )(NA )(2e-04 )(NA )(0.052 )(NA )(0.0725 )
Estimates ( 5 )-0.512600.42580-0.287500
(p-val)(0 )(NA )(1e-04 )(NA )(0.0887 )(NA )(NA )
Estimates ( 6 )-0.506400.42850000
(p-val)(0 )(NA )(1e-04 )(NA )(NA )(NA )(NA )
Estimates ( 7 )NANANANANANANA
(p-val)(NA )(NA )(NA )(NA )(NA )(NA )(NA )
Estimates ( 8 )NANANANANANANA
(p-val)(NA )(NA )(NA )(NA )(NA )(NA )(NA )
Estimates ( 9 )NANANANANANANA
(p-val)(NA )(NA )(NA )(NA )(NA )(NA )(NA )
Estimates ( 10 )NANANANANANANA
(p-val)(NA )(NA )(NA )(NA )(NA )(NA )(NA )
Estimates ( 11 )NANANANANANANA
(p-val)(NA )(NA )(NA )(NA )(NA )(NA )(NA )
Estimates ( 12 )NANANANANANANA
(p-val)(NA )(NA )(NA )(NA )(NA )(NA )(NA )
Estimates ( 13 )NANANANANANANA
(p-val)(NA )(NA )(NA )(NA )(NA )(NA )(NA )


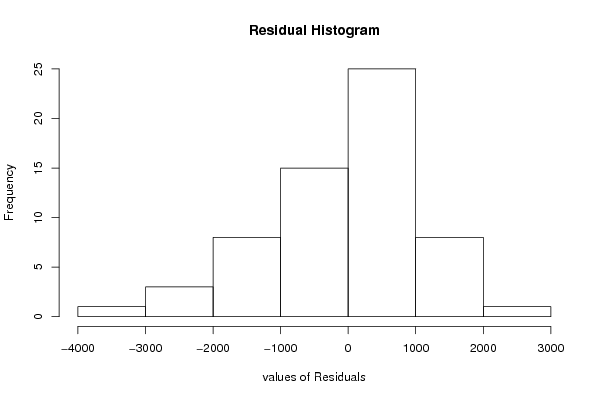
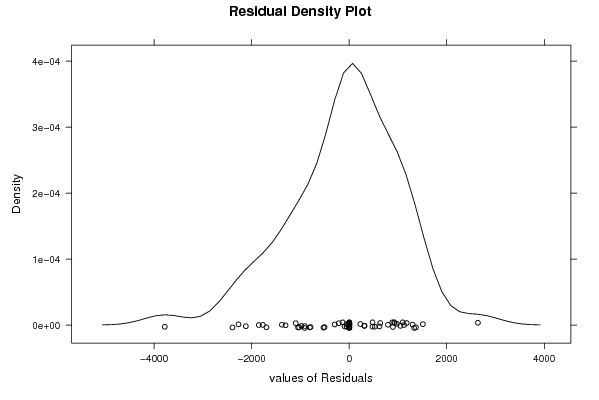
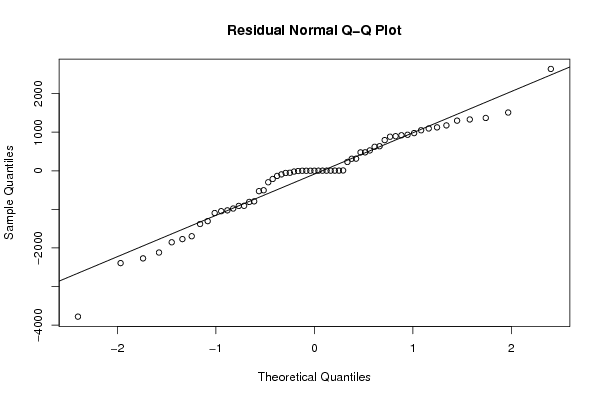
Estimated ARIMA Residuals
Value
-56.404923233245
527.836603046086
478.714348211866
-908.36869953975
1050.52260239472
896.809975301159
795.431903881218
-1771.21958364157
1177.21170861071
-2119.66518035102
920.64060675515
-1047.66382083267
933.973094138826
-528.000966128935
-133.407591549358
1125.75465854243
-504.762600179679
-2393.82902634230
311.89186039671
1096.91429998511
-297.684996323743
-92.9867283359076
1299.88683909719
229.150739388125
1369.70507742263
-1095.34792801021
-1304.85320746412
1510.38605140235
636.881228714159
-978.430535088919
883.058618889536
977.707360415901
-1696.64473497727
2640.32160285349
-1025.81015019782
1330.80561497152
-911.435330053074
-212.950188748477
-51.4533641138587
-1379.76186837010
-3782.08991963700
-2270.77027311182
-1853.8583573614
476.772054338646
-20.3169587413759
-792.62978037154
-807.807186039036
622.005863856947
314.456965319724

\begin{tabular}{lllllllll}
\hline
Estimated ARIMA Residuals \tabularnewline
Value \tabularnewline
-56.404923233245 \tabularnewline
527.836603046086 \tabularnewline
478.714348211866 \tabularnewline
-908.36869953975 \tabularnewline
1050.52260239472 \tabularnewline
896.809975301159 \tabularnewline
795.431903881218 \tabularnewline
-1771.21958364157 \tabularnewline
1177.21170861071 \tabularnewline
-2119.66518035102 \tabularnewline
920.64060675515 \tabularnewline
-1047.66382083267 \tabularnewline
933.973094138826 \tabularnewline
-528.000966128935 \tabularnewline
-133.407591549358 \tabularnewline
1125.75465854243 \tabularnewline
-504.762600179679 \tabularnewline
-2393.82902634230 \tabularnewline
311.89186039671 \tabularnewline
1096.91429998511 \tabularnewline
-297.684996323743 \tabularnewline
-92.9867283359076 \tabularnewline
1299.88683909719 \tabularnewline
229.150739388125 \tabularnewline
1369.70507742263 \tabularnewline
-1095.34792801021 \tabularnewline
-1304.85320746412 \tabularnewline
1510.38605140235 \tabularnewline
636.881228714159 \tabularnewline
-978.430535088919 \tabularnewline
883.058618889536 \tabularnewline
977.707360415901 \tabularnewline
-1696.64473497727 \tabularnewline
2640.32160285349 \tabularnewline
-1025.81015019782 \tabularnewline
1330.80561497152 \tabularnewline
-911.435330053074 \tabularnewline
-212.950188748477 \tabularnewline
-51.4533641138587 \tabularnewline
-1379.76186837010 \tabularnewline
-3782.08991963700 \tabularnewline
-2270.77027311182 \tabularnewline
-1853.8583573614 \tabularnewline
476.772054338646 \tabularnewline
-20.3169587413759 \tabularnewline
-792.62978037154 \tabularnewline
-807.807186039036 \tabularnewline
622.005863856947 \tabularnewline
314.456965319724 \tabularnewline
\hline
\end{tabular}
%Source: https://freestatistics.org/blog/index.php?pk=69213&T=2

[TABLE]
[ROW][C]Estimated ARIMA Residuals[/C][/ROW]
[ROW][C]Value[/C][/ROW]
[ROW][C]-56.404923233245[/C][/ROW]
[ROW][C]527.836603046086[/C][/ROW]
[ROW][C]478.714348211866[/C][/ROW]
[ROW][C]-908.36869953975[/C][/ROW]
[ROW][C]1050.52260239472[/C][/ROW]
[ROW][C]896.809975301159[/C][/ROW]
[ROW][C]795.431903881218[/C][/ROW]
[ROW][C]-1771.21958364157[/C][/ROW]
[ROW][C]1177.21170861071[/C][/ROW]
[ROW][C]-2119.66518035102[/C][/ROW]
[ROW][C]920.64060675515[/C][/ROW]
[ROW][C]-1047.66382083267[/C][/ROW]
[ROW][C]933.973094138826[/C][/ROW]
[ROW][C]-528.000966128935[/C][/ROW]
[ROW][C]-133.407591549358[/C][/ROW]
[ROW][C]1125.75465854243[/C][/ROW]
[ROW][C]-504.762600179679[/C][/ROW]
[ROW][C]-2393.82902634230[/C][/ROW]
[ROW][C]311.89186039671[/C][/ROW]
[ROW][C]1096.91429998511[/C][/ROW]
[ROW][C]-297.684996323743[/C][/ROW]
[ROW][C]-92.9867283359076[/C][/ROW]
[ROW][C]1299.88683909719[/C][/ROW]
[ROW][C]229.150739388125[/C][/ROW]
[ROW][C]1369.70507742263[/C][/ROW]
[ROW][C]-1095.34792801021[/C][/ROW]
[ROW][C]-1304.85320746412[/C][/ROW]
[ROW][C]1510.38605140235[/C][/ROW]
[ROW][C]636.881228714159[/C][/ROW]
[ROW][C]-978.430535088919[/C][/ROW]
[ROW][C]883.058618889536[/C][/ROW]
[ROW][C]977.707360415901[/C][/ROW]
[ROW][C]-1696.64473497727[/C][/ROW]
[ROW][C]2640.32160285349[/C][/ROW]
[ROW][C]-1025.81015019782[/C][/ROW]
[ROW][C]1330.80561497152[/C][/ROW]
[ROW][C]-911.435330053074[/C][/ROW]
[ROW][C]-212.950188748477[/C][/ROW]
[ROW][C]-51.4533641138587[/C][/ROW]
[ROW][C]-1379.76186837010[/C][/ROW]
[ROW][C]-3782.08991963700[/C][/ROW]
[ROW][C]-2270.77027311182[/C][/ROW]
[ROW][C]-1853.8583573614[/C][/ROW]
[ROW][C]476.772054338646[/C][/ROW]
[ROW][C]-20.3169587413759[/C][/ROW]
[ROW][C]-792.62978037154[/C][/ROW]
[ROW][C]-807.807186039036[/C][/ROW]
[ROW][C]622.005863856947[/C][/ROW]
[ROW][C]314.456965319724[/C][/ROW]
[/TABLE]
Source: https://freestatistics.org/blog/index.php?pk=69213&T=2

Globally Unique Identifier (entire table): ba.freestatistics.org/blog/index.php?pk=69213&T=2

As an alternative you can also use a QR Code:  

The GUIDs for individual cells are displayed in the table below:

Estimated ARIMA Residuals
Value
-56.404923233245
527.836603046086
478.714348211866
-908.36869953975
1050.52260239472
896.809975301159
795.431903881218
-1771.21958364157
1177.21170861071
-2119.66518035102
920.64060675515
-1047.66382083267
933.973094138826
-528.000966128935
-133.407591549358
1125.75465854243
-504.762600179679
-2393.82902634230
311.89186039671
1096.91429998511
-297.684996323743
-92.9867283359076
1299.88683909719
229.150739388125
1369.70507742263
-1095.34792801021
-1304.85320746412
1510.38605140235
636.881228714159
-978.430535088919
883.058618889536
977.707360415901
-1696.64473497727
2640.32160285349
-1025.81015019782
1330.80561497152
-911.435330053074
-212.950188748477
-51.4533641138587
-1379.76186837010
-3782.08991963700
-2270.77027311182
-1853.8583573614
476.772054338646
-20.3169587413759
-792.62978037154
-807.807186039036
622.005863856947
314.456965319724


Parameters (Session):
par1 = FALSE ; par2 = 1 ; par3 = 1 ; par4 = 1 ; par5 = 12 ; par6 = 3 ; par7 = 1 ; par8 = 2 ; par9 = 1 ;
Parameters (R input):
par1 = FALSE ; par2 = 1 ; par3 = 1 ; par4 = 1 ; par5 = 12 ; par6 = 3 ; par7 = 1 ; par8 = 2 ; par9 = 1 ;
R code (references can be found in the software module):
library(lattice)
if (par1 == 'TRUE') par1 <- TRUE
if (par1 == 'FALSE') par1 <- FALSE
par2 <- as.numeric(par2) #Box-Cox lambda transformation parameter
par3 <- as.numeric(par3) #degree of non-seasonal differencing
par4 <- as.numeric(par4) #degree of seasonal differencing
par5 <- as.numeric(par5) #seasonal period
par6 <- as.numeric(par6) #degree (p) of the non-seasonal AR(p) polynomial
par7 <- as.numeric(par7) #degree (q) of the non-seasonal MA(q) polynomial
par8 <- as.numeric(par8) #degree (P) of the seasonal AR(P) polynomial
par9 <- as.numeric(par9) #degree (Q) of the seasonal MA(Q) polynomial
armaGR <- function(arima.out, names, n){
try1 <- arima.out$coef
try2 <- sqrt(diag(arima.out$var.coef))
try.data.frame <- data.frame(matrix(NA,ncol=4,nrow=length(names)))
dimnames(try.data.frame) <- list(names,c('coef','std','tstat','pv'))
try.data.frame[,1] <- try1
for(i in 1:length(try2)) try.data.frame[which(rownames(try.data.frame)==names(try2)[i]),2] <- try2[i]
try.data.frame[,3] <- try.data.frame[,1] / try.data.frame[,2]
try.data.frame[,4] <- round((1-pt(abs(try.data.frame[,3]),df=n-(length(try2)+1)))*2,5)
vector <- rep(NA,length(names))
vector[is.na(try.data.frame[,4])] <- 0
maxi <- which.max(try.data.frame[,4])
continue <- max(try.data.frame[,4],na.rm=TRUE) > .05
vector[maxi] <- 0
list(summary=try.data.frame,next.vector=vector,continue=continue)
}
arimaSelect <- function(series, order=c(13,0,0), seasonal=list(order=c(2,0,0),period=12), include.mean=F){
nrc <- order[1]+order[3]+seasonal$order[1]+seasonal$order[3]
coeff <- matrix(NA, nrow=nrc*2, ncol=nrc)
pval <- matrix(NA, nrow=nrc*2, ncol=nrc)
mylist <- rep(list(NULL), nrc)
names <- NULL
if(order[1] > 0) names <- paste('ar',1:order[1],sep='')
if(order[3] > 0) names <- c( names , paste('ma',1:order[3],sep='') )
if(seasonal$order[1] > 0) names <- c(names, paste('sar',1:seasonal$order[1],sep=''))
if(seasonal$order[3] > 0) names <- c(names, paste('sma',1:seasonal$order[3],sep=''))
arima.out <- arima(series, order=order, seasonal=seasonal, include.mean=include.mean, method='ML')
mylist[[1]] <- arima.out
last.arma <- armaGR(arima.out, names, length(series))
mystop <- FALSE
i <- 1
coeff[i,] <- last.arma[[1]][,1]
pval [i,] <- last.arma[[1]][,4]
i <- 2
aic <- arima.out$aic
while(!mystop){
mylist[[i]] <- arima.out
arima.out <- arima(series, order=order, seasonal=seasonal, include.mean=include.mean, method='ML', fixed=last.arma$next.vector)
aic <- c(aic, arima.out$aic)
last.arma <- armaGR(arima.out, names, length(series))
mystop <- !last.arma$continue
coeff[i,] <- last.arma[[1]][,1]
pval [i,] <- last.arma[[1]][,4]
i <- i+1
}
list(coeff, pval, mylist, aic=aic)
}
arimaSelectplot <- function(arimaSelect.out,noms,choix){
noms <- names(arimaSelect.out[[3]][[1]]$coef)
coeff <- arimaSelect.out[[1]]
k <- min(which(is.na(coeff[,1])))-1
coeff <- coeff[1:k,]
pval <- arimaSelect.out[[2]][1:k,]
aic <- arimaSelect.out$aic[1:k]
coeff[coeff==0] <- NA
n <- ncol(coeff)
if(missing(choix)) choix <- k
layout(matrix(c(1,1,1,2,
3,3,3,2,
3,3,3,4,
5,6,7,7),nr=4),
widths=c(10,35,45,15),
heights=c(30,30,15,15))
couleurs <- rainbow(75)[1:50]#(50)
ticks <- pretty(coeff)
par(mar=c(1,1,3,1))
plot(aic,k:1-.5,type='o',pch=21,bg='blue',cex=2,axes=F,lty=2,xpd=NA)
points(aic[choix],k-choix+.5,pch=21,cex=4,bg=2,xpd=NA)
title('aic',line=2)
par(mar=c(3,0,0,0))
plot(0,axes=F,xlab='',ylab='',xlim=range(ticks),ylim=c(.1,1))
rect(xleft = min(ticks) + (0:49)/50*(max(ticks)-min(ticks)),
xright = min(ticks) + (1:50)/50*(max(ticks)-min(ticks)),
ytop = rep(1,50),
ybottom= rep(0,50),col=couleurs,border=NA)
axis(1,ticks)
rect(xleft=min(ticks),xright=max(ticks),ytop=1,ybottom=0)
text(mean(coeff,na.rm=T),.5,'coefficients',cex=2,font=2)
par(mar=c(1,1,3,1))
image(1:n,1:k,t(coeff[k:1,]),axes=F,col=couleurs,zlim=range(ticks))
for(i in 1:n) for(j in 1:k) if(!is.na(coeff[j,i])) {
if(pval[j,i]<.01) symb = 'green'
else if( (pval[j,i]<.05) & (pval[j,i]>=.01)) symb = 'orange'
else if( (pval[j,i]<.1) & (pval[j,i]>=.05)) symb = 'red'
else symb = 'black'
polygon(c(i+.5 ,i+.2 ,i+.5 ,i+.5),
c(k-j+0.5,k-j+0.5,k-j+0.8,k-j+0.5),
col=symb)
if(j==choix) {
rect(xleft=i-.5,
xright=i+.5,
ybottom=k-j+1.5,
ytop=k-j+.5,
lwd=4)
text(i,
k-j+1,
round(coeff[j,i],2),
cex=1.2,
font=2)
}
else{
rect(xleft=i-.5,xright=i+.5,ybottom=k-j+1.5,ytop=k-j+.5)
text(i,k-j+1,round(coeff[j,i],2),cex=1.2,font=1)
}
}
axis(3,1:n,noms)
par(mar=c(0.5,0,0,0.5))
plot(0,axes=F,xlab='',ylab='',type='n',xlim=c(0,8),ylim=c(-.2,.8))
cols <- c('green','orange','red','black')
niv <- c('0','0.01','0.05','0.1')
for(i in 0:3){
polygon(c(1+2*i ,1+2*i ,1+2*i-.5 ,1+2*i),
c(.4 ,.7 , .4 , .4),
col=cols[i+1])
text(2*i,0.5,niv[i+1],cex=1.5)
}
text(8,.5,1,cex=1.5)
text(4,0,'p-value',cex=2)
box()
residus <- arimaSelect.out[[3]][[choix]]$res
par(mar=c(1,2,4,1))
acf(residus,main='')
title('acf',line=.5)
par(mar=c(1,2,4,1))
pacf(residus,main='')
title('pacf',line=.5)
par(mar=c(2,2,4,1))
qqnorm(residus,main='')
title('qq-norm',line=.5)
qqline(residus)
residus
}
if (par2 == 0) x <- log(x)
if (par2 != 0) x <- x^par2
(selection <- arimaSelect(x, order=c(par6,par3,par7), seasonal=list(order=c(par8,par4,par9), period=par5)))
bitmap(file='test1.png')
resid <- arimaSelectplot(selection)
dev.off()
resid
bitmap(file='test2.png')
acf(resid,length(resid)/2, main='Residual Autocorrelation Function')
dev.off()
bitmap(file='test3.png')
pacf(resid,length(resid)/2, main='Residual Partial Autocorrelation Function')
dev.off()
bitmap(file='test4.png')
cpgram(resid, main='Residual Cumulative Periodogram')
dev.off()
bitmap(file='test5.png')
hist(resid, main='Residual Histogram', xlab='values of Residuals')
dev.off()
bitmap(file='test6.png')
densityplot(~resid,col='black',main='Residual Density Plot', xlab='values of Residuals')
dev.off()
bitmap(file='test7.png')
qqnorm(resid, main='Residual Normal Q-Q Plot')
qqline(resid)
dev.off()
ncols <- length(selection[[1]][1,])
nrows <- length(selection[[2]][,1])-1
load(file='createtable')
a<-table.start()
a<-table.row.start(a)
a<-table.element(a,'ARIMA Parameter Estimation and Backward Selection', ncols+1,TRUE)
a<-table.row.end(a)
a<-table.row.start(a)
a<-table.element(a,'Iteration', header=TRUE)
for (i in 1:ncols) {
a<-table.element(a,names(selection[[3]][[1]]$coef)[i],header=TRUE)
}
a<-table.row.end(a)
for (j in 1:nrows) {
a<-table.row.start(a)
mydum <- 'Estimates ('
mydum <- paste(mydum,j)
mydum <- paste(mydum,')')
a<-table.element(a,mydum, header=TRUE)
for (i in 1:ncols) {
a<-table.element(a,round(selection[[1]][j,i],4))
}
a<-table.row.end(a)
a<-table.row.start(a)
a<-table.element(a,'(p-val)', header=TRUE)
for (i in 1:ncols) {
mydum <- '('
mydum <- paste(mydum,round(selection[[2]][j,i],4),sep='')
mydum <- paste(mydum,')')
a<-table.element(a,mydum)
}
a<-table.row.end(a)
}
a<-table.end(a)
table.save(a,file='mytable.tab')
a<-table.start()
a<-table.row.start(a)
a<-table.element(a,'Estimated ARIMA Residuals', 1,TRUE)
a<-table.row.end(a)
a<-table.row.start(a)
a<-table.element(a,'Value', 1,TRUE)
a<-table.row.end(a)
for (i in (par4*par5+par3):length(resid)) {
a<-table.row.start(a)
a<-table.element(a,resid[i])
a<-table.row.end(a)
}
a<-table.end(a)
table.save(a,file='mytable1.tab')