Free Statistics

of Irreproducible Research!

Author's title

Author*The author of this computation has been verified*
R Software Modulerwasp_multipleregression.wasp
Title produced by softwareMultiple Regression
Date of computationFri, 18 Dec 2009 04:10:49 -0700
Cite this page as followsStatistical Computations at FreeStatistics.org, Office for Research Development and Education, URL https://freestatistics.org/blog/index.php?v=date/2009/Dec/18/t1261134680e0lqkj9x1bcj0mz.htm/, Retrieved Sat, 27 Apr 2024 07:16:22 +0000
Statistical Computations at FreeStatistics.org, Office for Research Development and Education, URL https://freestatistics.org/blog/index.php?pk=69234, Retrieved Sat, 27 Apr 2024 07:16:22 +0000
QR Codes:

Original text written by user:
IsPrivate?No (this computation is public)
User-defined keywords
Estimated Impact216
Family? (F = Feedback message, R = changed R code, M = changed R Module, P = changed Parameters, D = changed Data)
-       [Multiple Regression] [] [2009-12-18 11:10:49] [477c9cb8e7bda18f2375c22a66069c90] [Current]
Feedback Forum

Post a new message
Dataseries X:
8.1	92.9
7.7	107.7
7.5	103.5
7.6	91.1
7.8	79.8
7.8	71.9
7.8	82.9
7.5	90.1
7.5	100.7
7.1	90.7
7.5	108.8
7.5	44.1
7.6	93.6
7.7	107.4
7.7	96.5
7.9	93.6
8.1	76.5
8.2	76.7
8.2	84
8.2	103.3
7.9	88.5
7.3	99
6.9	105.9
6.6	44.7
6.7	94
6.9	107.1
7	104.8
7.1	102.5
7.2	77.7
7.1	85.2
6.9	91.3
7	106.5
6.8	92.4
6.4	97.5
6.7	107
6.6	51.1
6.4	98.6
6.3	102.2
6.2	114.3
6.5	99.4
6.8	72.5
6.8	92.3
6.4	99.4
6.1	85.9
5.8	109.4
6.1	97.6
7.2	104.7
7.3	56.9
6.9	86.7
6.1	108.5
5.8	103.4
6.2	86.2
7.1	71
7.7	75.9
7.9	87.1
7.7	102
7.4	88.5
7.5	87.8
8	100.8
8.1	50.6
8	85.9


Summary of computational transaction
Raw Inputview raw input (R code)
Raw Outputview raw output of R engine
Computing time4 seconds
R Server'Gwilym Jenkins' @ 72.249.127.135

\begin{tabular}{lllllllll}
\hline
Summary of computational transaction \tabularnewline
Raw Input & view raw input (R code)  \tabularnewline
Raw Output & view raw output of R engine  \tabularnewline
Computing time & 4 seconds \tabularnewline
R Server & 'Gwilym Jenkins' @ 72.249.127.135 \tabularnewline
\hline
\end{tabular}
%Source: https://freestatistics.org/blog/index.php?pk=69234&T=0

[TABLE]
[ROW][C]Summary of computational transaction[/C][/ROW]
[ROW][C]Raw Input[/C][C]view raw input (R code) [/C][/ROW]
[ROW][C]Raw Output[/C][C]view raw output of R engine [/C][/ROW]
[ROW][C]Computing time[/C][C]4 seconds[/C][/ROW]
[ROW][C]R Server[/C][C]'Gwilym Jenkins' @ 72.249.127.135[/C][/ROW]
[/TABLE]
Source: https://freestatistics.org/blog/index.php?pk=69234&T=0

Globally Unique Identifier (entire table): ba.freestatistics.org/blog/index.php?pk=69234&T=0

As an alternative you can also use a QR Code:  

The GUIDs for individual cells are displayed in the table below:

Summary of computational transaction
Raw Inputview raw input (R code)
Raw Outputview raw output of R engine
Computing time4 seconds
R Server'Gwilym Jenkins' @ 72.249.127.135


Multiple Linear Regression - Estimated Regression Equation
Werkloosheidsgraad[t] = + 9.269949293332 -0.0310552406551667Bruto_index[t] + 1.31095273927571M1[t] + 1.35066091204492M2[t] + 1.20032534441868M3[t] + 1.12589558524283M4[t] + 0.888242031291867M5[t] + 1.17467204343869M6[t] + 1.37414313157033M7[t] + 1.51609863895437M8[t] + 1.25880627240331M9[t] + 1.03020937323569M10[t] + 1.76359193412662M11[t] -0.0142593329365101t + e[t]

\begin{tabular}{lllllllll}
\hline
Multiple Linear Regression - Estimated Regression Equation \tabularnewline
Werkloosheidsgraad[t] =  +  9.269949293332 -0.0310552406551667Bruto_index[t] +  1.31095273927571M1[t] +  1.35066091204492M2[t] +  1.20032534441868M3[t] +  1.12589558524283M4[t] +  0.888242031291867M5[t] +  1.17467204343869M6[t] +  1.37414313157033M7[t] +  1.51609863895437M8[t] +  1.25880627240331M9[t] +  1.03020937323569M10[t] +  1.76359193412662M11[t] -0.0142593329365101t  + e[t] \tabularnewline
\hline
\end{tabular}
%Source: https://freestatistics.org/blog/index.php?pk=69234&T=1

[TABLE]
[ROW][C]Multiple Linear Regression - Estimated Regression Equation[/C][/ROW]
[ROW][C]Werkloosheidsgraad[t] =  +  9.269949293332 -0.0310552406551667Bruto_index[t] +  1.31095273927571M1[t] +  1.35066091204492M2[t] +  1.20032534441868M3[t] +  1.12589558524283M4[t] +  0.888242031291867M5[t] +  1.17467204343869M6[t] +  1.37414313157033M7[t] +  1.51609863895437M8[t] +  1.25880627240331M9[t] +  1.03020937323569M10[t] +  1.76359193412662M11[t] -0.0142593329365101t  + e[t][/C][/ROW]
[/TABLE]
Source: https://freestatistics.org/blog/index.php?pk=69234&T=1

Globally Unique Identifier (entire table): ba.freestatistics.org/blog/index.php?pk=69234&T=1

As an alternative you can also use a QR Code:  

The GUIDs for individual cells are displayed in the table below:

Multiple Linear Regression - Estimated Regression Equation
Werkloosheidsgraad[t] = + 9.269949293332 -0.0310552406551667Bruto_index[t] + 1.31095273927571M1[t] + 1.35066091204492M2[t] + 1.20032534441868M3[t] + 1.12589558524283M4[t] + 0.888242031291867M5[t] + 1.17467204343869M6[t] + 1.37414313157033M7[t] + 1.51609863895437M8[t] + 1.25880627240331M9[t] + 1.03020937323569M10[t] + 1.76359193412662M11[t] -0.0142593329365101t + e[t]


Multiple Linear Regression - Ordinary Least Squares
VariableParameterS.D.T-STATH0: parameter = 02-tail p-value1-tail p-value
(Intercept)9.2699492933320.77148912.015700
Bruto_index-0.03105524065516670.014272-2.1760.0346150.017307
M11.310952739275710.7130431.83850.0723070.036154
M21.350660912044920.9059391.49090.142670.071335
M31.200325344418680.8789481.36560.1785530.089276
M41.125895585242830.7543451.49250.1422390.071119
M50.8882420312918670.540411.64360.1069240.053462
M61.174672043438690.5904351.98950.0524830.026241
M71.374143131570330.6861842.00260.0510090.025505
M81.516098638954370.7901511.91870.0611010.030551
M91.258806272403310.7694451.6360.1085210.054261
M101.030209373235690.7523641.36930.1774140.088707
M111.763591934126620.8891031.98360.0531630.026582
t-0.01425933293651010.004558-3.12840.0030160.001508

\begin{tabular}{lllllllll}
\hline
Multiple Linear Regression - Ordinary Least Squares \tabularnewline
Variable & Parameter & S.D. & T-STATH0: parameter = 0 & 2-tail p-value & 1-tail p-value \tabularnewline
(Intercept) & 9.269949293332 & 0.771489 & 12.0157 & 0 & 0 \tabularnewline
Bruto_index & -0.0310552406551667 & 0.014272 & -2.176 & 0.034615 & 0.017307 \tabularnewline
M1 & 1.31095273927571 & 0.713043 & 1.8385 & 0.072307 & 0.036154 \tabularnewline
M2 & 1.35066091204492 & 0.905939 & 1.4909 & 0.14267 & 0.071335 \tabularnewline
M3 & 1.20032534441868 & 0.878948 & 1.3656 & 0.178553 & 0.089276 \tabularnewline
M4 & 1.12589558524283 & 0.754345 & 1.4925 & 0.142239 & 0.071119 \tabularnewline
M5 & 0.888242031291867 & 0.54041 & 1.6436 & 0.106924 & 0.053462 \tabularnewline
M6 & 1.17467204343869 & 0.590435 & 1.9895 & 0.052483 & 0.026241 \tabularnewline
M7 & 1.37414313157033 & 0.686184 & 2.0026 & 0.051009 & 0.025505 \tabularnewline
M8 & 1.51609863895437 & 0.790151 & 1.9187 & 0.061101 & 0.030551 \tabularnewline
M9 & 1.25880627240331 & 0.769445 & 1.636 & 0.108521 & 0.054261 \tabularnewline
M10 & 1.03020937323569 & 0.752364 & 1.3693 & 0.177414 & 0.088707 \tabularnewline
M11 & 1.76359193412662 & 0.889103 & 1.9836 & 0.053163 & 0.026582 \tabularnewline
t & -0.0142593329365101 & 0.004558 & -3.1284 & 0.003016 & 0.001508 \tabularnewline
\hline
\end{tabular}
%Source: https://freestatistics.org/blog/index.php?pk=69234&T=2

[TABLE]
[ROW][C]Multiple Linear Regression - Ordinary Least Squares[/C][/ROW]
[ROW][C]Variable[/C][C]Parameter[/C][C]S.D.[/C][C]T-STATH0: parameter = 0[/C][C]2-tail p-value[/C][C]1-tail p-value[/C][/ROW]
[ROW][C](Intercept)[/C][C]9.269949293332[/C][C]0.771489[/C][C]12.0157[/C][C]0[/C][C]0[/C][/ROW]
[ROW][C]Bruto_index[/C][C]-0.0310552406551667[/C][C]0.014272[/C][C]-2.176[/C][C]0.034615[/C][C]0.017307[/C][/ROW]
[ROW][C]M1[/C][C]1.31095273927571[/C][C]0.713043[/C][C]1.8385[/C][C]0.072307[/C][C]0.036154[/C][/ROW]
[ROW][C]M2[/C][C]1.35066091204492[/C][C]0.905939[/C][C]1.4909[/C][C]0.14267[/C][C]0.071335[/C][/ROW]
[ROW][C]M3[/C][C]1.20032534441868[/C][C]0.878948[/C][C]1.3656[/C][C]0.178553[/C][C]0.089276[/C][/ROW]
[ROW][C]M4[/C][C]1.12589558524283[/C][C]0.754345[/C][C]1.4925[/C][C]0.142239[/C][C]0.071119[/C][/ROW]
[ROW][C]M5[/C][C]0.888242031291867[/C][C]0.54041[/C][C]1.6436[/C][C]0.106924[/C][C]0.053462[/C][/ROW]
[ROW][C]M6[/C][C]1.17467204343869[/C][C]0.590435[/C][C]1.9895[/C][C]0.052483[/C][C]0.026241[/C][/ROW]
[ROW][C]M7[/C][C]1.37414313157033[/C][C]0.686184[/C][C]2.0026[/C][C]0.051009[/C][C]0.025505[/C][/ROW]
[ROW][C]M8[/C][C]1.51609863895437[/C][C]0.790151[/C][C]1.9187[/C][C]0.061101[/C][C]0.030551[/C][/ROW]
[ROW][C]M9[/C][C]1.25880627240331[/C][C]0.769445[/C][C]1.636[/C][C]0.108521[/C][C]0.054261[/C][/ROW]
[ROW][C]M10[/C][C]1.03020937323569[/C][C]0.752364[/C][C]1.3693[/C][C]0.177414[/C][C]0.088707[/C][/ROW]
[ROW][C]M11[/C][C]1.76359193412662[/C][C]0.889103[/C][C]1.9836[/C][C]0.053163[/C][C]0.026582[/C][/ROW]
[ROW][C]t[/C][C]-0.0142593329365101[/C][C]0.004558[/C][C]-3.1284[/C][C]0.003016[/C][C]0.001508[/C][/ROW]
[/TABLE]
Source: https://freestatistics.org/blog/index.php?pk=69234&T=2

Globally Unique Identifier (entire table): ba.freestatistics.org/blog/index.php?pk=69234&T=2

As an alternative you can also use a QR Code:  

The GUIDs for individual cells are displayed in the table below:

Multiple Linear Regression - Ordinary Least Squares
VariableParameterS.D.T-STATH0: parameter = 02-tail p-value1-tail p-value
(Intercept)9.2699492933320.77148912.015700
Bruto_index-0.03105524065516670.014272-2.1760.0346150.017307
M11.310952739275710.7130431.83850.0723070.036154
M21.350660912044920.9059391.49090.142670.071335
M31.200325344418680.8789481.36560.1785530.089276
M41.125895585242830.7543451.49250.1422390.071119
M50.8882420312918670.540411.64360.1069240.053462
M61.174672043438690.5904351.98950.0524830.026241
M71.374143131570330.6861842.00260.0510090.025505
M81.516098638954370.7901511.91870.0611010.030551
M91.258806272403310.7694451.6360.1085210.054261
M101.030209373235690.7523641.36930.1774140.088707
M111.763591934126620.8891031.98360.0531630.026582
t-0.01425933293651010.004558-3.12840.0030160.001508


Multiple Linear Regression - Regression Statistics
Multiple R0.566302299484839
R-squared0.320698294401816
Adjusted R-squared0.132806333278914
F-TEST (value)1.70682285971801
F-TEST (DF numerator)13
F-TEST (DF denominator)47
p-value0.0907637807319794
Multiple Linear Regression - Residual Statistics
Residual Standard Deviation0.617352823253533
Sum Squared Residuals17.9128518938181

\begin{tabular}{lllllllll}
\hline
Multiple Linear Regression - Regression Statistics \tabularnewline
Multiple R & 0.566302299484839 \tabularnewline
R-squared & 0.320698294401816 \tabularnewline
Adjusted R-squared & 0.132806333278914 \tabularnewline
F-TEST (value) & 1.70682285971801 \tabularnewline
F-TEST (DF numerator) & 13 \tabularnewline
F-TEST (DF denominator) & 47 \tabularnewline
p-value & 0.0907637807319794 \tabularnewline
Multiple Linear Regression - Residual Statistics \tabularnewline
Residual Standard Deviation & 0.617352823253533 \tabularnewline
Sum Squared Residuals & 17.9128518938181 \tabularnewline
\hline
\end{tabular}
%Source: https://freestatistics.org/blog/index.php?pk=69234&T=3

[TABLE]
[ROW][C]Multiple Linear Regression - Regression Statistics[/C][/ROW]
[ROW][C]Multiple R[/C][C]0.566302299484839[/C][/ROW]
[ROW][C]R-squared[/C][C]0.320698294401816[/C][/ROW]
[ROW][C]Adjusted R-squared[/C][C]0.132806333278914[/C][/ROW]
[ROW][C]F-TEST (value)[/C][C]1.70682285971801[/C][/ROW]
[ROW][C]F-TEST (DF numerator)[/C][C]13[/C][/ROW]
[ROW][C]F-TEST (DF denominator)[/C][C]47[/C][/ROW]
[ROW][C]p-value[/C][C]0.0907637807319794[/C][/ROW]
[ROW][C]Multiple Linear Regression - Residual Statistics[/C][/ROW]
[ROW][C]Residual Standard Deviation[/C][C]0.617352823253533[/C][/ROW]
[ROW][C]Sum Squared Residuals[/C][C]17.9128518938181[/C][/ROW]
[/TABLE]
Source: https://freestatistics.org/blog/index.php?pk=69234&T=3

Globally Unique Identifier (entire table): ba.freestatistics.org/blog/index.php?pk=69234&T=3

As an alternative you can also use a QR Code:  

The GUIDs for individual cells are displayed in the table below:

Multiple Linear Regression - Regression Statistics
Multiple R0.566302299484839
R-squared0.320698294401816
Adjusted R-squared0.132806333278914
F-TEST (value)1.70682285971801
F-TEST (DF numerator)13
F-TEST (DF denominator)47
p-value0.0907637807319794
Multiple Linear Regression - Residual Statistics
Residual Standard Deviation0.617352823253533
Sum Squared Residuals17.9128518938181


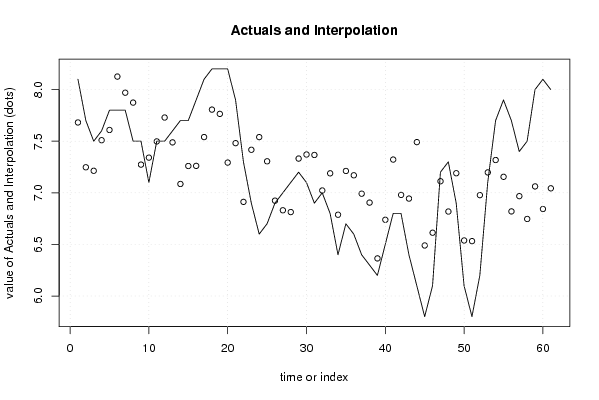
Multiple Linear Regression - Actuals, Interpolation, and Residuals
Time or IndexActualsInterpolationForecastResidualsPrediction Error
18.17.681610842806230.418389157193768
27.77.247442120942450.452557879057546
37.57.213279231131410.286720768868591
47.67.509675123143120.0903248768568812
57.87.608686455659020.191313544340977
67.88.12619353604516-0.326193536045158
77.87.96979764403345-0.169797644033449
87.57.87389608576378-0.373896085763784
97.57.273158835331440.226841164668557
107.17.34085500977898-0.240855009778979
117.57.497878381874880.00212161812511804
127.57.72930118520104-0.229301185201038
137.67.488760179109490.111239820890511
147.77.085646697900880.614353302099116
157.77.259553920479450.440446079520546
167.97.260925026267080.63907497373292
178.17.540056754582950.559943245417045
188.27.806016385662240.393983614337762
198.27.764524884074640.435475115925355
208.27.292854913877460.907145086122535
217.97.480920776086350.419079223913646
227.36.911984517102970.388015482897026
236.97.41682658453674-0.516826584536744
246.67.53955604556982-0.939556045569818
256.77.3052260876093-0.605226087609301
266.96.92385127485931-0.0238512748593132
2776.830683427803450.16931657219655
287.16.813421389197980.286578610802023
297.27.33167847055863-0.131678470558633
307.17.3709348448552-0.2709348448552
316.97.3667096320538-0.466709632053806
3277.02236614854281-0.0223661485428098
336.87.18869334229308-0.388693342293083
346.46.7874553828476-0.387455382847603
356.77.21155382457794-0.51155382457794
366.67.16969051013863-0.56969051013863
376.46.99125998535741-0.591259985357413
386.36.90490995883151-0.60490995883151
396.26.36454664634125-0.164546646341246
406.56.73858063999087-0.238580639990872
416.87.32205372672738-0.52205372672738
426.86.9793306409654-0.179330640965396
436.46.94405018750884-0.544050187508835
446.17.49099211080112-1.39099211080112
455.86.48964225591713-0.689642255917129
466.16.61323786354397-0.513237863543966
477.27.11186888284670.0881311171532975
487.36.818458119100540.481541880899457
496.97.18970535391578-0.289705353915776
506.16.53814994746584-0.438149947465839
515.86.53193677424444-0.731936774244441
526.26.97739782140095-0.777397821400951
537.17.19752459247201-0.0975245924720088
547.77.317524592472010.382475407527992
557.97.154917652329270.745082347670735
567.76.819890741014820.880109258985182
577.46.967584790371990.432415209628008
587.56.746467226726480.753532773273522
5987.061872326163730.938127673836268
608.16.842994139989971.25700586001003
6187.043437551201790.956562448798212

\begin{tabular}{lllllllll}
\hline
Multiple Linear Regression - Actuals, Interpolation, and Residuals \tabularnewline
Time or Index & Actuals & InterpolationForecast & ResidualsPrediction Error \tabularnewline
1 & 8.1 & 7.68161084280623 & 0.418389157193768 \tabularnewline
2 & 7.7 & 7.24744212094245 & 0.452557879057546 \tabularnewline
3 & 7.5 & 7.21327923113141 & 0.286720768868591 \tabularnewline
4 & 7.6 & 7.50967512314312 & 0.0903248768568812 \tabularnewline
5 & 7.8 & 7.60868645565902 & 0.191313544340977 \tabularnewline
6 & 7.8 & 8.12619353604516 & -0.326193536045158 \tabularnewline
7 & 7.8 & 7.96979764403345 & -0.169797644033449 \tabularnewline
8 & 7.5 & 7.87389608576378 & -0.373896085763784 \tabularnewline
9 & 7.5 & 7.27315883533144 & 0.226841164668557 \tabularnewline
10 & 7.1 & 7.34085500977898 & -0.240855009778979 \tabularnewline
11 & 7.5 & 7.49787838187488 & 0.00212161812511804 \tabularnewline
12 & 7.5 & 7.72930118520104 & -0.229301185201038 \tabularnewline
13 & 7.6 & 7.48876017910949 & 0.111239820890511 \tabularnewline
14 & 7.7 & 7.08564669790088 & 0.614353302099116 \tabularnewline
15 & 7.7 & 7.25955392047945 & 0.440446079520546 \tabularnewline
16 & 7.9 & 7.26092502626708 & 0.63907497373292 \tabularnewline
17 & 8.1 & 7.54005675458295 & 0.559943245417045 \tabularnewline
18 & 8.2 & 7.80601638566224 & 0.393983614337762 \tabularnewline
19 & 8.2 & 7.76452488407464 & 0.435475115925355 \tabularnewline
20 & 8.2 & 7.29285491387746 & 0.907145086122535 \tabularnewline
21 & 7.9 & 7.48092077608635 & 0.419079223913646 \tabularnewline
22 & 7.3 & 6.91198451710297 & 0.388015482897026 \tabularnewline
23 & 6.9 & 7.41682658453674 & -0.516826584536744 \tabularnewline
24 & 6.6 & 7.53955604556982 & -0.939556045569818 \tabularnewline
25 & 6.7 & 7.3052260876093 & -0.605226087609301 \tabularnewline
26 & 6.9 & 6.92385127485931 & -0.0238512748593132 \tabularnewline
27 & 7 & 6.83068342780345 & 0.16931657219655 \tabularnewline
28 & 7.1 & 6.81342138919798 & 0.286578610802023 \tabularnewline
29 & 7.2 & 7.33167847055863 & -0.131678470558633 \tabularnewline
30 & 7.1 & 7.3709348448552 & -0.2709348448552 \tabularnewline
31 & 6.9 & 7.3667096320538 & -0.466709632053806 \tabularnewline
32 & 7 & 7.02236614854281 & -0.0223661485428098 \tabularnewline
33 & 6.8 & 7.18869334229308 & -0.388693342293083 \tabularnewline
34 & 6.4 & 6.7874553828476 & -0.387455382847603 \tabularnewline
35 & 6.7 & 7.21155382457794 & -0.51155382457794 \tabularnewline
36 & 6.6 & 7.16969051013863 & -0.56969051013863 \tabularnewline
37 & 6.4 & 6.99125998535741 & -0.591259985357413 \tabularnewline
38 & 6.3 & 6.90490995883151 & -0.60490995883151 \tabularnewline
39 & 6.2 & 6.36454664634125 & -0.164546646341246 \tabularnewline
40 & 6.5 & 6.73858063999087 & -0.238580639990872 \tabularnewline
41 & 6.8 & 7.32205372672738 & -0.52205372672738 \tabularnewline
42 & 6.8 & 6.9793306409654 & -0.179330640965396 \tabularnewline
43 & 6.4 & 6.94405018750884 & -0.544050187508835 \tabularnewline
44 & 6.1 & 7.49099211080112 & -1.39099211080112 \tabularnewline
45 & 5.8 & 6.48964225591713 & -0.689642255917129 \tabularnewline
46 & 6.1 & 6.61323786354397 & -0.513237863543966 \tabularnewline
47 & 7.2 & 7.1118688828467 & 0.0881311171532975 \tabularnewline
48 & 7.3 & 6.81845811910054 & 0.481541880899457 \tabularnewline
49 & 6.9 & 7.18970535391578 & -0.289705353915776 \tabularnewline
50 & 6.1 & 6.53814994746584 & -0.438149947465839 \tabularnewline
51 & 5.8 & 6.53193677424444 & -0.731936774244441 \tabularnewline
52 & 6.2 & 6.97739782140095 & -0.777397821400951 \tabularnewline
53 & 7.1 & 7.19752459247201 & -0.0975245924720088 \tabularnewline
54 & 7.7 & 7.31752459247201 & 0.382475407527992 \tabularnewline
55 & 7.9 & 7.15491765232927 & 0.745082347670735 \tabularnewline
56 & 7.7 & 6.81989074101482 & 0.880109258985182 \tabularnewline
57 & 7.4 & 6.96758479037199 & 0.432415209628008 \tabularnewline
58 & 7.5 & 6.74646722672648 & 0.753532773273522 \tabularnewline
59 & 8 & 7.06187232616373 & 0.938127673836268 \tabularnewline
60 & 8.1 & 6.84299413998997 & 1.25700586001003 \tabularnewline
61 & 8 & 7.04343755120179 & 0.956562448798212 \tabularnewline
\hline
\end{tabular}
%Source: https://freestatistics.org/blog/index.php?pk=69234&T=4

[TABLE]
[ROW][C]Multiple Linear Regression - Actuals, Interpolation, and Residuals[/C][/ROW]
[ROW][C]Time or Index[/C][C]Actuals[/C][C]InterpolationForecast[/C][C]ResidualsPrediction Error[/C][/ROW]
[ROW][C]1[/C][C]8.1[/C][C]7.68161084280623[/C][C]0.418389157193768[/C][/ROW]
[ROW][C]2[/C][C]7.7[/C][C]7.24744212094245[/C][C]0.452557879057546[/C][/ROW]
[ROW][C]3[/C][C]7.5[/C][C]7.21327923113141[/C][C]0.286720768868591[/C][/ROW]
[ROW][C]4[/C][C]7.6[/C][C]7.50967512314312[/C][C]0.0903248768568812[/C][/ROW]
[ROW][C]5[/C][C]7.8[/C][C]7.60868645565902[/C][C]0.191313544340977[/C][/ROW]
[ROW][C]6[/C][C]7.8[/C][C]8.12619353604516[/C][C]-0.326193536045158[/C][/ROW]
[ROW][C]7[/C][C]7.8[/C][C]7.96979764403345[/C][C]-0.169797644033449[/C][/ROW]
[ROW][C]8[/C][C]7.5[/C][C]7.87389608576378[/C][C]-0.373896085763784[/C][/ROW]
[ROW][C]9[/C][C]7.5[/C][C]7.27315883533144[/C][C]0.226841164668557[/C][/ROW]
[ROW][C]10[/C][C]7.1[/C][C]7.34085500977898[/C][C]-0.240855009778979[/C][/ROW]
[ROW][C]11[/C][C]7.5[/C][C]7.49787838187488[/C][C]0.00212161812511804[/C][/ROW]
[ROW][C]12[/C][C]7.5[/C][C]7.72930118520104[/C][C]-0.229301185201038[/C][/ROW]
[ROW][C]13[/C][C]7.6[/C][C]7.48876017910949[/C][C]0.111239820890511[/C][/ROW]
[ROW][C]14[/C][C]7.7[/C][C]7.08564669790088[/C][C]0.614353302099116[/C][/ROW]
[ROW][C]15[/C][C]7.7[/C][C]7.25955392047945[/C][C]0.440446079520546[/C][/ROW]
[ROW][C]16[/C][C]7.9[/C][C]7.26092502626708[/C][C]0.63907497373292[/C][/ROW]
[ROW][C]17[/C][C]8.1[/C][C]7.54005675458295[/C][C]0.559943245417045[/C][/ROW]
[ROW][C]18[/C][C]8.2[/C][C]7.80601638566224[/C][C]0.393983614337762[/C][/ROW]
[ROW][C]19[/C][C]8.2[/C][C]7.76452488407464[/C][C]0.435475115925355[/C][/ROW]
[ROW][C]20[/C][C]8.2[/C][C]7.29285491387746[/C][C]0.907145086122535[/C][/ROW]
[ROW][C]21[/C][C]7.9[/C][C]7.48092077608635[/C][C]0.419079223913646[/C][/ROW]
[ROW][C]22[/C][C]7.3[/C][C]6.91198451710297[/C][C]0.388015482897026[/C][/ROW]
[ROW][C]23[/C][C]6.9[/C][C]7.41682658453674[/C][C]-0.516826584536744[/C][/ROW]
[ROW][C]24[/C][C]6.6[/C][C]7.53955604556982[/C][C]-0.939556045569818[/C][/ROW]
[ROW][C]25[/C][C]6.7[/C][C]7.3052260876093[/C][C]-0.605226087609301[/C][/ROW]
[ROW][C]26[/C][C]6.9[/C][C]6.92385127485931[/C][C]-0.0238512748593132[/C][/ROW]
[ROW][C]27[/C][C]7[/C][C]6.83068342780345[/C][C]0.16931657219655[/C][/ROW]
[ROW][C]28[/C][C]7.1[/C][C]6.81342138919798[/C][C]0.286578610802023[/C][/ROW]
[ROW][C]29[/C][C]7.2[/C][C]7.33167847055863[/C][C]-0.131678470558633[/C][/ROW]
[ROW][C]30[/C][C]7.1[/C][C]7.3709348448552[/C][C]-0.2709348448552[/C][/ROW]
[ROW][C]31[/C][C]6.9[/C][C]7.3667096320538[/C][C]-0.466709632053806[/C][/ROW]
[ROW][C]32[/C][C]7[/C][C]7.02236614854281[/C][C]-0.0223661485428098[/C][/ROW]
[ROW][C]33[/C][C]6.8[/C][C]7.18869334229308[/C][C]-0.388693342293083[/C][/ROW]
[ROW][C]34[/C][C]6.4[/C][C]6.7874553828476[/C][C]-0.387455382847603[/C][/ROW]
[ROW][C]35[/C][C]6.7[/C][C]7.21155382457794[/C][C]-0.51155382457794[/C][/ROW]
[ROW][C]36[/C][C]6.6[/C][C]7.16969051013863[/C][C]-0.56969051013863[/C][/ROW]
[ROW][C]37[/C][C]6.4[/C][C]6.99125998535741[/C][C]-0.591259985357413[/C][/ROW]
[ROW][C]38[/C][C]6.3[/C][C]6.90490995883151[/C][C]-0.60490995883151[/C][/ROW]
[ROW][C]39[/C][C]6.2[/C][C]6.36454664634125[/C][C]-0.164546646341246[/C][/ROW]
[ROW][C]40[/C][C]6.5[/C][C]6.73858063999087[/C][C]-0.238580639990872[/C][/ROW]
[ROW][C]41[/C][C]6.8[/C][C]7.32205372672738[/C][C]-0.52205372672738[/C][/ROW]
[ROW][C]42[/C][C]6.8[/C][C]6.9793306409654[/C][C]-0.179330640965396[/C][/ROW]
[ROW][C]43[/C][C]6.4[/C][C]6.94405018750884[/C][C]-0.544050187508835[/C][/ROW]
[ROW][C]44[/C][C]6.1[/C][C]7.49099211080112[/C][C]-1.39099211080112[/C][/ROW]
[ROW][C]45[/C][C]5.8[/C][C]6.48964225591713[/C][C]-0.689642255917129[/C][/ROW]
[ROW][C]46[/C][C]6.1[/C][C]6.61323786354397[/C][C]-0.513237863543966[/C][/ROW]
[ROW][C]47[/C][C]7.2[/C][C]7.1118688828467[/C][C]0.0881311171532975[/C][/ROW]
[ROW][C]48[/C][C]7.3[/C][C]6.81845811910054[/C][C]0.481541880899457[/C][/ROW]
[ROW][C]49[/C][C]6.9[/C][C]7.18970535391578[/C][C]-0.289705353915776[/C][/ROW]
[ROW][C]50[/C][C]6.1[/C][C]6.53814994746584[/C][C]-0.438149947465839[/C][/ROW]
[ROW][C]51[/C][C]5.8[/C][C]6.53193677424444[/C][C]-0.731936774244441[/C][/ROW]
[ROW][C]52[/C][C]6.2[/C][C]6.97739782140095[/C][C]-0.777397821400951[/C][/ROW]
[ROW][C]53[/C][C]7.1[/C][C]7.19752459247201[/C][C]-0.0975245924720088[/C][/ROW]
[ROW][C]54[/C][C]7.7[/C][C]7.31752459247201[/C][C]0.382475407527992[/C][/ROW]
[ROW][C]55[/C][C]7.9[/C][C]7.15491765232927[/C][C]0.745082347670735[/C][/ROW]
[ROW][C]56[/C][C]7.7[/C][C]6.81989074101482[/C][C]0.880109258985182[/C][/ROW]
[ROW][C]57[/C][C]7.4[/C][C]6.96758479037199[/C][C]0.432415209628008[/C][/ROW]
[ROW][C]58[/C][C]7.5[/C][C]6.74646722672648[/C][C]0.753532773273522[/C][/ROW]
[ROW][C]59[/C][C]8[/C][C]7.06187232616373[/C][C]0.938127673836268[/C][/ROW]
[ROW][C]60[/C][C]8.1[/C][C]6.84299413998997[/C][C]1.25700586001003[/C][/ROW]
[ROW][C]61[/C][C]8[/C][C]7.04343755120179[/C][C]0.956562448798212[/C][/ROW]
[/TABLE]
Source: https://freestatistics.org/blog/index.php?pk=69234&T=4

Globally Unique Identifier (entire table): ba.freestatistics.org/blog/index.php?pk=69234&T=4

As an alternative you can also use a QR Code:  

The GUIDs for individual cells are displayed in the table below:

Multiple Linear Regression - Actuals, Interpolation, and Residuals
Time or IndexActualsInterpolationForecastResidualsPrediction Error
18.17.681610842806230.418389157193768
27.77.247442120942450.452557879057546
37.57.213279231131410.286720768868591
47.67.509675123143120.0903248768568812
57.87.608686455659020.191313544340977
67.88.12619353604516-0.326193536045158
77.87.96979764403345-0.169797644033449
87.57.87389608576378-0.373896085763784
97.57.273158835331440.226841164668557
107.17.34085500977898-0.240855009778979
117.57.497878381874880.00212161812511804
127.57.72930118520104-0.229301185201038
137.67.488760179109490.111239820890511
147.77.085646697900880.614353302099116
157.77.259553920479450.440446079520546
167.97.260925026267080.63907497373292
178.17.540056754582950.559943245417045
188.27.806016385662240.393983614337762
198.27.764524884074640.435475115925355
208.27.292854913877460.907145086122535
217.97.480920776086350.419079223913646
227.36.911984517102970.388015482897026
236.97.41682658453674-0.516826584536744
246.67.53955604556982-0.939556045569818
256.77.3052260876093-0.605226087609301
266.96.92385127485931-0.0238512748593132
2776.830683427803450.16931657219655
287.16.813421389197980.286578610802023
297.27.33167847055863-0.131678470558633
307.17.3709348448552-0.2709348448552
316.97.3667096320538-0.466709632053806
3277.02236614854281-0.0223661485428098
336.87.18869334229308-0.388693342293083
346.46.7874553828476-0.387455382847603
356.77.21155382457794-0.51155382457794
366.67.16969051013863-0.56969051013863
376.46.99125998535741-0.591259985357413
386.36.90490995883151-0.60490995883151
396.26.36454664634125-0.164546646341246
406.56.73858063999087-0.238580639990872
416.87.32205372672738-0.52205372672738
426.86.9793306409654-0.179330640965396
436.46.94405018750884-0.544050187508835
446.17.49099211080112-1.39099211080112
455.86.48964225591713-0.689642255917129
466.16.61323786354397-0.513237863543966
477.27.11186888284670.0881311171532975
487.36.818458119100540.481541880899457
496.97.18970535391578-0.289705353915776
506.16.53814994746584-0.438149947465839
515.86.53193677424444-0.731936774244441
526.26.97739782140095-0.777397821400951
537.17.19752459247201-0.0975245924720088
547.77.317524592472010.382475407527992
557.97.154917652329270.745082347670735
567.76.819890741014820.880109258985182
577.46.967584790371990.432415209628008
587.56.746467226726480.753532773273522
5987.061872326163730.938127673836268
608.16.842994139989971.25700586001003
6187.043437551201790.956562448798212


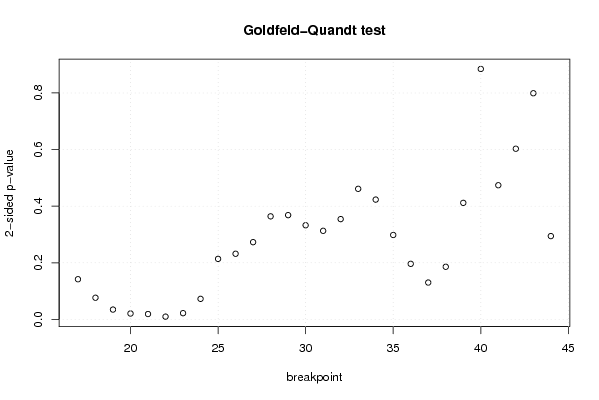
Goldfeld-Quandt test for Heteroskedasticity
p-valuesAlternative Hypothesis
breakpoint indexgreater2-sidedless
170.07092888986278850.1418577797255770.929071110137212
180.03822948357091250.0764589671418250.961770516429088
190.01736076081286970.03472152162573930.98263923918713
200.01037482079612620.02074964159225240.989625179203874
210.009492928490611060.01898585698122210.990507071509389
220.004827688405324230.009655376810648460.995172311594676
230.01099553897161410.02199107794322810.989004461028386
240.03628836894853730.07257673789707450.963711631051463
250.1068588976887850.2137177953775690.893141102311215
260.1159369188032680.2318738376065350.884063081196732
270.1363959723897910.2727919447795820.86360402761021
280.1820115768059280.3640231536118560.817988423194072
290.1841282558819760.3682565117639520.815871744118024
300.1662843274637670.3325686549275330.833715672536233
310.1564582202772140.3129164405544270.843541779722786
320.1771208686782320.3542417373564650.822879131321768
330.2306264022370390.4612528044740770.769373597762961
340.2116090784821840.4232181569643670.788390921517816
350.1490961608423210.2981923216846420.850903839157679
360.09813258709734860.1962651741946970.901867412902651
370.06506125229955970.1301225045991190.93493874770044
380.0929436263185010.1858872526370020.907056373681499
390.2058411001425620.4116822002851240.794158899857438
400.5576279179878960.8847441640242080.442372082012104
410.763046216293020.473907567413960.23695378370698
420.6985754040054710.6028491919890580.301424595994529
430.6005155401734930.7989689196530140.399484459826507
440.852855832374710.2942883352505780.147144167625289

\begin{tabular}{lllllllll}
\hline
Goldfeld-Quandt test for Heteroskedasticity \tabularnewline
p-values & Alternative Hypothesis \tabularnewline
breakpoint index & greater & 2-sided & less \tabularnewline
17 & 0.0709288898627885 & 0.141857779725577 & 0.929071110137212 \tabularnewline
18 & 0.0382294835709125 & 0.076458967141825 & 0.961770516429088 \tabularnewline
19 & 0.0173607608128697 & 0.0347215216257393 & 0.98263923918713 \tabularnewline
20 & 0.0103748207961262 & 0.0207496415922524 & 0.989625179203874 \tabularnewline
21 & 0.00949292849061106 & 0.0189858569812221 & 0.990507071509389 \tabularnewline
22 & 0.00482768840532423 & 0.00965537681064846 & 0.995172311594676 \tabularnewline
23 & 0.0109955389716141 & 0.0219910779432281 & 0.989004461028386 \tabularnewline
24 & 0.0362883689485373 & 0.0725767378970745 & 0.963711631051463 \tabularnewline
25 & 0.106858897688785 & 0.213717795377569 & 0.893141102311215 \tabularnewline
26 & 0.115936918803268 & 0.231873837606535 & 0.884063081196732 \tabularnewline
27 & 0.136395972389791 & 0.272791944779582 & 0.86360402761021 \tabularnewline
28 & 0.182011576805928 & 0.364023153611856 & 0.817988423194072 \tabularnewline
29 & 0.184128255881976 & 0.368256511763952 & 0.815871744118024 \tabularnewline
30 & 0.166284327463767 & 0.332568654927533 & 0.833715672536233 \tabularnewline
31 & 0.156458220277214 & 0.312916440554427 & 0.843541779722786 \tabularnewline
32 & 0.177120868678232 & 0.354241737356465 & 0.822879131321768 \tabularnewline
33 & 0.230626402237039 & 0.461252804474077 & 0.769373597762961 \tabularnewline
34 & 0.211609078482184 & 0.423218156964367 & 0.788390921517816 \tabularnewline
35 & 0.149096160842321 & 0.298192321684642 & 0.850903839157679 \tabularnewline
36 & 0.0981325870973486 & 0.196265174194697 & 0.901867412902651 \tabularnewline
37 & 0.0650612522995597 & 0.130122504599119 & 0.93493874770044 \tabularnewline
38 & 0.092943626318501 & 0.185887252637002 & 0.907056373681499 \tabularnewline
39 & 0.205841100142562 & 0.411682200285124 & 0.794158899857438 \tabularnewline
40 & 0.557627917987896 & 0.884744164024208 & 0.442372082012104 \tabularnewline
41 & 0.76304621629302 & 0.47390756741396 & 0.23695378370698 \tabularnewline
42 & 0.698575404005471 & 0.602849191989058 & 0.301424595994529 \tabularnewline
43 & 0.600515540173493 & 0.798968919653014 & 0.399484459826507 \tabularnewline
44 & 0.85285583237471 & 0.294288335250578 & 0.147144167625289 \tabularnewline
\hline
\end{tabular}
%Source: https://freestatistics.org/blog/index.php?pk=69234&T=5

[TABLE]
[ROW][C]Goldfeld-Quandt test for Heteroskedasticity[/C][/ROW]
[ROW][C]p-values[/C][C]Alternative Hypothesis[/C][/ROW]
[ROW][C]breakpoint index[/C][C]greater[/C][C]2-sided[/C][C]less[/C][/ROW]
[ROW][C]17[/C][C]0.0709288898627885[/C][C]0.141857779725577[/C][C]0.929071110137212[/C][/ROW]
[ROW][C]18[/C][C]0.0382294835709125[/C][C]0.076458967141825[/C][C]0.961770516429088[/C][/ROW]
[ROW][C]19[/C][C]0.0173607608128697[/C][C]0.0347215216257393[/C][C]0.98263923918713[/C][/ROW]
[ROW][C]20[/C][C]0.0103748207961262[/C][C]0.0207496415922524[/C][C]0.989625179203874[/C][/ROW]
[ROW][C]21[/C][C]0.00949292849061106[/C][C]0.0189858569812221[/C][C]0.990507071509389[/C][/ROW]
[ROW][C]22[/C][C]0.00482768840532423[/C][C]0.00965537681064846[/C][C]0.995172311594676[/C][/ROW]
[ROW][C]23[/C][C]0.0109955389716141[/C][C]0.0219910779432281[/C][C]0.989004461028386[/C][/ROW]
[ROW][C]24[/C][C]0.0362883689485373[/C][C]0.0725767378970745[/C][C]0.963711631051463[/C][/ROW]
[ROW][C]25[/C][C]0.106858897688785[/C][C]0.213717795377569[/C][C]0.893141102311215[/C][/ROW]
[ROW][C]26[/C][C]0.115936918803268[/C][C]0.231873837606535[/C][C]0.884063081196732[/C][/ROW]
[ROW][C]27[/C][C]0.136395972389791[/C][C]0.272791944779582[/C][C]0.86360402761021[/C][/ROW]
[ROW][C]28[/C][C]0.182011576805928[/C][C]0.364023153611856[/C][C]0.817988423194072[/C][/ROW]
[ROW][C]29[/C][C]0.184128255881976[/C][C]0.368256511763952[/C][C]0.815871744118024[/C][/ROW]
[ROW][C]30[/C][C]0.166284327463767[/C][C]0.332568654927533[/C][C]0.833715672536233[/C][/ROW]
[ROW][C]31[/C][C]0.156458220277214[/C][C]0.312916440554427[/C][C]0.843541779722786[/C][/ROW]
[ROW][C]32[/C][C]0.177120868678232[/C][C]0.354241737356465[/C][C]0.822879131321768[/C][/ROW]
[ROW][C]33[/C][C]0.230626402237039[/C][C]0.461252804474077[/C][C]0.769373597762961[/C][/ROW]
[ROW][C]34[/C][C]0.211609078482184[/C][C]0.423218156964367[/C][C]0.788390921517816[/C][/ROW]
[ROW][C]35[/C][C]0.149096160842321[/C][C]0.298192321684642[/C][C]0.850903839157679[/C][/ROW]
[ROW][C]36[/C][C]0.0981325870973486[/C][C]0.196265174194697[/C][C]0.901867412902651[/C][/ROW]
[ROW][C]37[/C][C]0.0650612522995597[/C][C]0.130122504599119[/C][C]0.93493874770044[/C][/ROW]
[ROW][C]38[/C][C]0.092943626318501[/C][C]0.185887252637002[/C][C]0.907056373681499[/C][/ROW]
[ROW][C]39[/C][C]0.205841100142562[/C][C]0.411682200285124[/C][C]0.794158899857438[/C][/ROW]
[ROW][C]40[/C][C]0.557627917987896[/C][C]0.884744164024208[/C][C]0.442372082012104[/C][/ROW]
[ROW][C]41[/C][C]0.76304621629302[/C][C]0.47390756741396[/C][C]0.23695378370698[/C][/ROW]
[ROW][C]42[/C][C]0.698575404005471[/C][C]0.602849191989058[/C][C]0.301424595994529[/C][/ROW]
[ROW][C]43[/C][C]0.600515540173493[/C][C]0.798968919653014[/C][C]0.399484459826507[/C][/ROW]
[ROW][C]44[/C][C]0.85285583237471[/C][C]0.294288335250578[/C][C]0.147144167625289[/C][/ROW]
[/TABLE]
Source: https://freestatistics.org/blog/index.php?pk=69234&T=5

Globally Unique Identifier (entire table): ba.freestatistics.org/blog/index.php?pk=69234&T=5

As an alternative you can also use a QR Code:  

The GUIDs for individual cells are displayed in the table below:

Goldfeld-Quandt test for Heteroskedasticity
p-valuesAlternative Hypothesis
breakpoint indexgreater2-sidedless
170.07092888986278850.1418577797255770.929071110137212
180.03822948357091250.0764589671418250.961770516429088
190.01736076081286970.03472152162573930.98263923918713
200.01037482079612620.02074964159225240.989625179203874
210.009492928490611060.01898585698122210.990507071509389
220.004827688405324230.009655376810648460.995172311594676
230.01099553897161410.02199107794322810.989004461028386
240.03628836894853730.07257673789707450.963711631051463
250.1068588976887850.2137177953775690.893141102311215
260.1159369188032680.2318738376065350.884063081196732
270.1363959723897910.2727919447795820.86360402761021
280.1820115768059280.3640231536118560.817988423194072
290.1841282558819760.3682565117639520.815871744118024
300.1662843274637670.3325686549275330.833715672536233
310.1564582202772140.3129164405544270.843541779722786
320.1771208686782320.3542417373564650.822879131321768
330.2306264022370390.4612528044740770.769373597762961
340.2116090784821840.4232181569643670.788390921517816
350.1490961608423210.2981923216846420.850903839157679
360.09813258709734860.1962651741946970.901867412902651
370.06506125229955970.1301225045991190.93493874770044
380.0929436263185010.1858872526370020.907056373681499
390.2058411001425620.4116822002851240.794158899857438
400.5576279179878960.8847441640242080.442372082012104
410.763046216293020.473907567413960.23695378370698
420.6985754040054710.6028491919890580.301424595994529
430.6005155401734930.7989689196530140.399484459826507
440.852855832374710.2942883352505780.147144167625289


Meta Analysis of Goldfeld-Quandt test for Heteroskedasticity
Description# significant tests% significant testsOK/NOK
1% type I error level10.0357142857142857NOK
5% type I error level50.178571428571429NOK
10% type I error level70.25NOK

\begin{tabular}{lllllllll}
\hline
Meta Analysis of Goldfeld-Quandt test for Heteroskedasticity \tabularnewline
Description & # significant tests & % significant tests & OK/NOK \tabularnewline
1% type I error level & 1 & 0.0357142857142857 & NOK \tabularnewline
5% type I error level & 5 & 0.178571428571429 & NOK \tabularnewline
10% type I error level & 7 & 0.25 & NOK \tabularnewline
\hline
\end{tabular}
%Source: https://freestatistics.org/blog/index.php?pk=69234&T=6

[TABLE]
[ROW][C]Meta Analysis of Goldfeld-Quandt test for Heteroskedasticity[/C][/ROW]
[ROW][C]Description[/C][C]# significant tests[/C][C]% significant tests[/C][C]OK/NOK[/C][/ROW]
[ROW][C]1% type I error level[/C][C]1[/C][C]0.0357142857142857[/C][C]NOK[/C][/ROW]
[ROW][C]5% type I error level[/C][C]5[/C][C]0.178571428571429[/C][C]NOK[/C][/ROW]
[ROW][C]10% type I error level[/C][C]7[/C][C]0.25[/C][C]NOK[/C][/ROW]
[/TABLE]
Source: https://freestatistics.org/blog/index.php?pk=69234&T=6

Globally Unique Identifier (entire table): ba.freestatistics.org/blog/index.php?pk=69234&T=6

As an alternative you can also use a QR Code:  

The GUIDs for individual cells are displayed in the table below:

Meta Analysis of Goldfeld-Quandt test for Heteroskedasticity
Description# significant tests% significant testsOK/NOK
1% type I error level10.0357142857142857NOK
5% type I error level50.178571428571429NOK
10% type I error level70.25NOK


Parameters (Session):
par1 = 1 ; par2 = Include Monthly Dummies ; par3 = Linear Trend ;
Parameters (R input):
par1 = 1 ; par2 = Include Monthly Dummies ; par3 = Linear Trend ;
R code (references can be found in the software module):
library(lattice)
library(lmtest)
n25 <- 25 #minimum number of obs. for Goldfeld-Quandt test
par1 <- as.numeric(par1)
x <- t(y)
k <- length(x[1,])
n <- length(x[,1])
x1 <- cbind(x[,par1], x[,1:k!=par1])
mycolnames <- c(colnames(x)[par1], colnames(x)[1:k!=par1])
colnames(x1) <- mycolnames #colnames(x)[par1]
x <- x1
if (par3 == 'First Differences'){
x2 <- array(0, dim=c(n-1,k), dimnames=list(1:(n-1), paste('(1-B)',colnames(x),sep='')))
for (i in 1:n-1) {
for (j in 1:k) {
x2[i,j] <- x[i+1,j] - x[i,j]
}
}
x <- x2
}
if (par2 == 'Include Monthly Dummies'){
x2 <- array(0, dim=c(n,11), dimnames=list(1:n, paste('M', seq(1:11), sep ='')))
for (i in 1:11){
x2[seq(i,n,12),i] <- 1
}
x <- cbind(x, x2)
}
if (par2 == 'Include Quarterly Dummies'){
x2 <- array(0, dim=c(n,3), dimnames=list(1:n, paste('Q', seq(1:3), sep ='')))
for (i in 1:3){
x2[seq(i,n,4),i] <- 1
}
x <- cbind(x, x2)
}
k <- length(x[1,])
if (par3 == 'Linear Trend'){
x <- cbind(x, c(1:n))
colnames(x)[k+1] <- 't'
}
x
k <- length(x[1,])
df <- as.data.frame(x)
(mylm <- lm(df))
(mysum <- summary(mylm))
if (n > n25) {
kp3 <- k + 3
nmkm3 <- n - k - 3
gqarr <- array(NA, dim=c(nmkm3-kp3+1,3))
numgqtests <- 0
numsignificant1 <- 0
numsignificant5 <- 0
numsignificant10 <- 0
for (mypoint in kp3:nmkm3) {
j <- 0
numgqtests <- numgqtests + 1
for (myalt in c('greater', 'two.sided', 'less')) {
j <- j + 1
gqarr[mypoint-kp3+1,j] <- gqtest(mylm, point=mypoint, alternative=myalt)$p.value
}
if (gqarr[mypoint-kp3+1,2] < 0.01) numsignificant1 <- numsignificant1 + 1
if (gqarr[mypoint-kp3+1,2] < 0.05) numsignificant5 <- numsignificant5 + 1
if (gqarr[mypoint-kp3+1,2] < 0.10) numsignificant10 <- numsignificant10 + 1
}
gqarr
}
bitmap(file='test0.png')
plot(x[,1], type='l', main='Actuals and Interpolation', ylab='value of Actuals and Interpolation (dots)', xlab='time or index')
points(x[,1]-mysum$resid)
grid()
dev.off()
bitmap(file='test1.png')
plot(mysum$resid, type='b', pch=19, main='Residuals', ylab='value of Residuals', xlab='time or index')
grid()
dev.off()
bitmap(file='test2.png')
hist(mysum$resid, main='Residual Histogram', xlab='values of Residuals')
grid()
dev.off()
bitmap(file='test3.png')
densityplot(~mysum$resid,col='black',main='Residual Density Plot', xlab='values of Residuals')
dev.off()
bitmap(file='test4.png')
qqnorm(mysum$resid, main='Residual Normal Q-Q Plot')
qqline(mysum$resid)
grid()
dev.off()
(myerror <- as.ts(mysum$resid))
bitmap(file='test5.png')
dum <- cbind(lag(myerror,k=1),myerror)
dum
dum1 <- dum[2:length(myerror),]
dum1
z <- as.data.frame(dum1)
z
plot(z,main=paste('Residual Lag plot, lowess, and regression line'), ylab='values of Residuals', xlab='lagged values of Residuals')
lines(lowess(z))
abline(lm(z))
grid()
dev.off()
bitmap(file='test6.png')
acf(mysum$resid, lag.max=length(mysum$resid)/2, main='Residual Autocorrelation Function')
grid()
dev.off()
bitmap(file='test7.png')
pacf(mysum$resid, lag.max=length(mysum$resid)/2, main='Residual Partial Autocorrelation Function')
grid()
dev.off()
bitmap(file='test8.png')
opar <- par(mfrow = c(2,2), oma = c(0, 0, 1.1, 0))
plot(mylm, las = 1, sub='Residual Diagnostics')
par(opar)
dev.off()
if (n > n25) {
bitmap(file='test9.png')
plot(kp3:nmkm3,gqarr[,2], main='Goldfeld-Quandt test',ylab='2-sided p-value',xlab='breakpoint')
grid()
dev.off()
}
load(file='createtable')
a<-table.start()
a<-table.row.start(a)
a<-table.element(a, 'Multiple Linear Regression - Estimated Regression Equation', 1, TRUE)
a<-table.row.end(a)
myeq <- colnames(x)[1]
myeq <- paste(myeq, '[t] = ', sep='')
for (i in 1:k){
if (mysum$coefficients[i,1] > 0) myeq <- paste(myeq, '+', '')
myeq <- paste(myeq, mysum$coefficients[i,1], sep=' ')
if (rownames(mysum$coefficients)[i] != '(Intercept)') {
myeq <- paste(myeq, rownames(mysum$coefficients)[i], sep='')
if (rownames(mysum$coefficients)[i] != 't') myeq <- paste(myeq, '[t]', sep='')
}
}
myeq <- paste(myeq, ' + e[t]')
a<-table.row.start(a)
a<-table.element(a, myeq)
a<-table.row.end(a)
a<-table.end(a)
table.save(a,file='mytable1.tab')
a<-table.start()
a<-table.row.start(a)
a<-table.element(a,hyperlink('ols1.htm','Multiple Linear Regression - Ordinary Least Squares',''), 6, TRUE)
a<-table.row.end(a)
a<-table.row.start(a)
a<-table.element(a,'Variable',header=TRUE)
a<-table.element(a,'Parameter',header=TRUE)
a<-table.element(a,'S.D.',header=TRUE)
a<-table.element(a,'T-STAT
H0: parameter = 0',header=TRUE)
a<-table.element(a,'2-tail p-value',header=TRUE)
a<-table.element(a,'1-tail p-value',header=TRUE)
a<-table.row.end(a)
for (i in 1:k){
a<-table.row.start(a)
a<-table.element(a,rownames(mysum$coefficients)[i],header=TRUE)
a<-table.element(a,mysum$coefficients[i,1])
a<-table.element(a, round(mysum$coefficients[i,2],6))
a<-table.element(a, round(mysum$coefficients[i,3],4))
a<-table.element(a, round(mysum$coefficients[i,4],6))
a<-table.element(a, round(mysum$coefficients[i,4]/2,6))
a<-table.row.end(a)
}
a<-table.end(a)
table.save(a,file='mytable2.tab')
a<-table.start()
a<-table.row.start(a)
a<-table.element(a, 'Multiple Linear Regression - Regression Statistics', 2, TRUE)
a<-table.row.end(a)
a<-table.row.start(a)
a<-table.element(a, 'Multiple R',1,TRUE)
a<-table.element(a, sqrt(mysum$r.squared))
a<-table.row.end(a)
a<-table.row.start(a)
a<-table.element(a, 'R-squared',1,TRUE)
a<-table.element(a, mysum$r.squared)
a<-table.row.end(a)
a<-table.row.start(a)
a<-table.element(a, 'Adjusted R-squared',1,TRUE)
a<-table.element(a, mysum$adj.r.squared)
a<-table.row.end(a)
a<-table.row.start(a)
a<-table.element(a, 'F-TEST (value)',1,TRUE)
a<-table.element(a, mysum$fstatistic[1])
a<-table.row.end(a)
a<-table.row.start(a)
a<-table.element(a, 'F-TEST (DF numerator)',1,TRUE)
a<-table.element(a, mysum$fstatistic[2])
a<-table.row.end(a)
a<-table.row.start(a)
a<-table.element(a, 'F-TEST (DF denominator)',1,TRUE)
a<-table.element(a, mysum$fstatistic[3])
a<-table.row.end(a)
a<-table.row.start(a)
a<-table.element(a, 'p-value',1,TRUE)
a<-table.element(a, 1-pf(mysum$fstatistic[1],mysum$fstatistic[2],mysum$fstatistic[3]))
a<-table.row.end(a)
a<-table.row.start(a)
a<-table.element(a, 'Multiple Linear Regression - Residual Statistics', 2, TRUE)
a<-table.row.end(a)
a<-table.row.start(a)
a<-table.element(a, 'Residual Standard Deviation',1,TRUE)
a<-table.element(a, mysum$sigma)
a<-table.row.end(a)
a<-table.row.start(a)
a<-table.element(a, 'Sum Squared Residuals',1,TRUE)
a<-table.element(a, sum(myerror*myerror))
a<-table.row.end(a)
a<-table.end(a)
table.save(a,file='mytable3.tab')
a<-table.start()
a<-table.row.start(a)
a<-table.element(a, 'Multiple Linear Regression - Actuals, Interpolation, and Residuals', 4, TRUE)
a<-table.row.end(a)
a<-table.row.start(a)
a<-table.element(a, 'Time or Index', 1, TRUE)
a<-table.element(a, 'Actuals', 1, TRUE)
a<-table.element(a, 'Interpolation
Forecast', 1, TRUE)
a<-table.element(a, 'Residuals
Prediction Error', 1, TRUE)
a<-table.row.end(a)
for (i in 1:n) {
a<-table.row.start(a)
a<-table.element(a,i, 1, TRUE)
a<-table.element(a,x[i])
a<-table.element(a,x[i]-mysum$resid[i])
a<-table.element(a,mysum$resid[i])
a<-table.row.end(a)
}
a<-table.end(a)
table.save(a,file='mytable4.tab')
if (n > n25) {
a<-table.start()
a<-table.row.start(a)
a<-table.element(a,'Goldfeld-Quandt test for Heteroskedasticity',4,TRUE)
a<-table.row.end(a)
a<-table.row.start(a)
a<-table.element(a,'p-values',header=TRUE)
a<-table.element(a,'Alternative Hypothesis',3,header=TRUE)
a<-table.row.end(a)
a<-table.row.start(a)
a<-table.element(a,'breakpoint index',header=TRUE)
a<-table.element(a,'greater',header=TRUE)
a<-table.element(a,'2-sided',header=TRUE)
a<-table.element(a,'less',header=TRUE)
a<-table.row.end(a)
for (mypoint in kp3:nmkm3) {
a<-table.row.start(a)
a<-table.element(a,mypoint,header=TRUE)
a<-table.element(a,gqarr[mypoint-kp3+1,1])
a<-table.element(a,gqarr[mypoint-kp3+1,2])
a<-table.element(a,gqarr[mypoint-kp3+1,3])
a<-table.row.end(a)
}
a<-table.end(a)
table.save(a,file='mytable5.tab')
a<-table.start()
a<-table.row.start(a)
a<-table.element(a,'Meta Analysis of Goldfeld-Quandt test for Heteroskedasticity',4,TRUE)
a<-table.row.end(a)
a<-table.row.start(a)
a<-table.element(a,'Description',header=TRUE)
a<-table.element(a,'# significant tests',header=TRUE)
a<-table.element(a,'% significant tests',header=TRUE)
a<-table.element(a,'OK/NOK',header=TRUE)
a<-table.row.end(a)
a<-table.row.start(a)
a<-table.element(a,'1% type I error level',header=TRUE)
a<-table.element(a,numsignificant1)
a<-table.element(a,numsignificant1/numgqtests)
if (numsignificant1/numgqtests < 0.01) dum <- 'OK' else dum <- 'NOK'
a<-table.element(a,dum)
a<-table.row.end(a)
a<-table.row.start(a)
a<-table.element(a,'5% type I error level',header=TRUE)
a<-table.element(a,numsignificant5)
a<-table.element(a,numsignificant5/numgqtests)
if (numsignificant5/numgqtests < 0.05) dum <- 'OK' else dum <- 'NOK'
a<-table.element(a,dum)
a<-table.row.end(a)
a<-table.row.start(a)
a<-table.element(a,'10% type I error level',header=TRUE)
a<-table.element(a,numsignificant10)
a<-table.element(a,numsignificant10/numgqtests)
if (numsignificant10/numgqtests < 0.1) dum <- 'OK' else dum <- 'NOK'
a<-table.element(a,dum)
a<-table.row.end(a)
a<-table.end(a)
table.save(a,file='mytable6.tab')
}