Free Statistics

of Irreproducible Research!

Author's title

Author*The author of this computation has been verified*
R Software Modulerwasp_multipleregression.wasp
Title produced by softwareMultiple Regression
Date of computationFri, 18 Dec 2009 04:17:42 -0700
Cite this page as followsStatistical Computations at FreeStatistics.org, Office for Research Development and Education, URL https://freestatistics.org/blog/index.php?v=date/2009/Dec/18/t1261135094gkw7kmpol416ssd.htm/, Retrieved Sat, 27 Apr 2024 07:13:03 +0000
Statistical Computations at FreeStatistics.org, Office for Research Development and Education, URL https://freestatistics.org/blog/index.php?pk=69238, Retrieved Sat, 27 Apr 2024 07:13:03 +0000
QR Codes:

Original text written by user:
IsPrivate?No (this computation is public)
User-defined keywords
Estimated Impact129
Family? (F = Feedback message, R = changed R code, M = changed R Module, P = changed Parameters, D = changed Data)
-       [Multiple Regression] [] [2009-12-18 11:17:42] [477c9cb8e7bda18f2375c22a66069c90] [Current]
Feedback Forum

Post a new message
Dataseries X:
8.1	92.9
7.7	107.7
7.5	103.5
7.6	91.1
7.8	79.8
7.8	71.9
7.8	82.9
7.5	90.1
7.5	100.7
7.1	90.7
7.5	108.8
7.5	44.1
7.6	93.6
7.7	107.4
7.7	96.5
7.9	93.6
8.1	76.5
8.2	76.7
8.2	84
8.2	103.3
7.9	88.5
7.3	99
6.9	105.9
6.6	44.7
6.7	94
6.9	107.1
7	104.8
7.1	102.5
7.2	77.7
7.1	85.2
6.9	91.3
7	106.5
6.8	92.4
6.4	97.5
6.7	107
6.6	51.1
6.4	98.6
6.3	102.2
6.2	114.3
6.5	99.4
6.8	72.5
6.8	92.3
6.4	99.4
6.1	85.9
5.8	109.4
6.1	97.6
7.2	104.7
7.3	56.9
6.9	86.7
6.1	108.5
5.8	103.4
6.2	86.2
7.1	71
7.7	75.9
7.9	87.1
7.7	102
7.4	88.5
7.5	87.8
8	100.8
8.1	50.6
8	85.9


Summary of computational transaction
Raw Inputview raw input (R code)
Raw Outputview raw output of R engine
Computing time3 seconds
R Server'Gwilym Jenkins' @ 72.249.127.135

\begin{tabular}{lllllllll}
\hline
Summary of computational transaction \tabularnewline
Raw Input & view raw input (R code)  \tabularnewline
Raw Output & view raw output of R engine  \tabularnewline
Computing time & 3 seconds \tabularnewline
R Server & 'Gwilym Jenkins' @ 72.249.127.135 \tabularnewline
\hline
\end{tabular}
%Source: https://freestatistics.org/blog/index.php?pk=69238&T=0

[TABLE]
[ROW][C]Summary of computational transaction[/C][/ROW]
[ROW][C]Raw Input[/C][C]view raw input (R code) [/C][/ROW]
[ROW][C]Raw Output[/C][C]view raw output of R engine [/C][/ROW]
[ROW][C]Computing time[/C][C]3 seconds[/C][/ROW]
[ROW][C]R Server[/C][C]'Gwilym Jenkins' @ 72.249.127.135[/C][/ROW]
[/TABLE]
Source: https://freestatistics.org/blog/index.php?pk=69238&T=0

Globally Unique Identifier (entire table): ba.freestatistics.org/blog/index.php?pk=69238&T=0

As an alternative you can also use a QR Code:  

The GUIDs for individual cells are displayed in the table below:

Summary of computational transaction
Raw Inputview raw input (R code)
Raw Outputview raw output of R engine
Computing time3 seconds
R Server'Gwilym Jenkins' @ 72.249.127.135


Multiple Linear Regression - Estimated Regression Equation
Werkloosheidsgraad[t] = + 8.81968142713807 -0.032329859077164Bruto_index[t] + 1.43638244834049M1[t] + 1.56603495330607M2[t] + 1.39878884642556M3[t] + 1.29743004719855M4[t] + 1.02122293318781M5[t] + 1.29963924266591M6[t] + 1.49573623918489M7[t] + 1.63441962443005M8[t] + 1.36075205836195M9[t] + 1.11613685283547M10[t] + 1.8491789139581M11[t] + e[t]

\begin{tabular}{lllllllll}
\hline
Multiple Linear Regression - Estimated Regression Equation \tabularnewline
Werkloosheidsgraad[t] =  +  8.81968142713807 -0.032329859077164Bruto_index[t] +  1.43638244834049M1[t] +  1.56603495330607M2[t] +  1.39878884642556M3[t] +  1.29743004719855M4[t] +  1.02122293318781M5[t] +  1.29963924266591M6[t] +  1.49573623918489M7[t] +  1.63441962443005M8[t] +  1.36075205836195M9[t] +  1.11613685283547M10[t] +  1.8491789139581M11[t]  + e[t] \tabularnewline
\hline
\end{tabular}
%Source: https://freestatistics.org/blog/index.php?pk=69238&T=1

[TABLE]
[ROW][C]Multiple Linear Regression - Estimated Regression Equation[/C][/ROW]
[ROW][C]Werkloosheidsgraad[t] =  +  8.81968142713807 -0.032329859077164Bruto_index[t] +  1.43638244834049M1[t] +  1.56603495330607M2[t] +  1.39878884642556M3[t] +  1.29743004719855M4[t] +  1.02122293318781M5[t] +  1.29963924266591M6[t] +  1.49573623918489M7[t] +  1.63441962443005M8[t] +  1.36075205836195M9[t] +  1.11613685283547M10[t] +  1.8491789139581M11[t]  + e[t][/C][/ROW]
[/TABLE]
Source: https://freestatistics.org/blog/index.php?pk=69238&T=1

Globally Unique Identifier (entire table): ba.freestatistics.org/blog/index.php?pk=69238&T=1

As an alternative you can also use a QR Code:  

The GUIDs for individual cells are displayed in the table below:

Multiple Linear Regression - Estimated Regression Equation
Werkloosheidsgraad[t] = + 8.81968142713807 -0.032329859077164Bruto_index[t] + 1.43638244834049M1[t] + 1.56603495330607M2[t] + 1.39878884642556M3[t] + 1.29743004719855M4[t] + 1.02122293318781M5[t] + 1.29963924266591M6[t] + 1.49573623918489M7[t] + 1.63441962443005M8[t] + 1.36075205836195M9[t] + 1.11613685283547M10[t] + 1.8491789139581M11[t] + e[t]


Multiple Linear Regression - Ordinary Least Squares
VariableParameterS.D.T-STATH0: parameter = 02-tail p-value1-tail p-value
(Intercept)8.819681427138070.82440610.698200
Bruto_index-0.0323298590771640.015517-2.08350.042550.021275
M11.436382448340490.774341.8550.0697470.034874
M21.566034953306070.9825291.59390.1175270.058763
M31.398788846425560.9535271.4670.1489080.074454
M41.297430047198550.8183211.58550.1194250.059712
M51.021222933187810.5859761.74280.0877770.043889
M61.299639242665910.6407372.02840.0480930.024046
M71.495736239184890.7451562.00730.0503680.025184
M81.634419624430050.8584521.90390.0629250.031463
M91.360752058361950.8361641.62740.1102050.055103
M101.116136852835470.8177911.36480.1786740.089337
M111.84917891395810.9666081.91310.0617160.030858

\begin{tabular}{lllllllll}
\hline
Multiple Linear Regression - Ordinary Least Squares \tabularnewline
Variable & Parameter & S.D. & T-STATH0: parameter = 0 & 2-tail p-value & 1-tail p-value \tabularnewline
(Intercept) & 8.81968142713807 & 0.824406 & 10.6982 & 0 & 0 \tabularnewline
Bruto_index & -0.032329859077164 & 0.015517 & -2.0835 & 0.04255 & 0.021275 \tabularnewline
M1 & 1.43638244834049 & 0.77434 & 1.855 & 0.069747 & 0.034874 \tabularnewline
M2 & 1.56603495330607 & 0.982529 & 1.5939 & 0.117527 & 0.058763 \tabularnewline
M3 & 1.39878884642556 & 0.953527 & 1.467 & 0.148908 & 0.074454 \tabularnewline
M4 & 1.29743004719855 & 0.818321 & 1.5855 & 0.119425 & 0.059712 \tabularnewline
M5 & 1.02122293318781 & 0.585976 & 1.7428 & 0.087777 & 0.043889 \tabularnewline
M6 & 1.29963924266591 & 0.640737 & 2.0284 & 0.048093 & 0.024046 \tabularnewline
M7 & 1.49573623918489 & 0.745156 & 2.0073 & 0.050368 & 0.025184 \tabularnewline
M8 & 1.63441962443005 & 0.858452 & 1.9039 & 0.062925 & 0.031463 \tabularnewline
M9 & 1.36075205836195 & 0.836164 & 1.6274 & 0.110205 & 0.055103 \tabularnewline
M10 & 1.11613685283547 & 0.817791 & 1.3648 & 0.178674 & 0.089337 \tabularnewline
M11 & 1.8491789139581 & 0.966608 & 1.9131 & 0.061716 & 0.030858 \tabularnewline
\hline
\end{tabular}
%Source: https://freestatistics.org/blog/index.php?pk=69238&T=2

[TABLE]
[ROW][C]Multiple Linear Regression - Ordinary Least Squares[/C][/ROW]
[ROW][C]Variable[/C][C]Parameter[/C][C]S.D.[/C][C]T-STATH0: parameter = 0[/C][C]2-tail p-value[/C][C]1-tail p-value[/C][/ROW]
[ROW][C](Intercept)[/C][C]8.81968142713807[/C][C]0.824406[/C][C]10.6982[/C][C]0[/C][C]0[/C][/ROW]
[ROW][C]Bruto_index[/C][C]-0.032329859077164[/C][C]0.015517[/C][C]-2.0835[/C][C]0.04255[/C][C]0.021275[/C][/ROW]
[ROW][C]M1[/C][C]1.43638244834049[/C][C]0.77434[/C][C]1.855[/C][C]0.069747[/C][C]0.034874[/C][/ROW]
[ROW][C]M2[/C][C]1.56603495330607[/C][C]0.982529[/C][C]1.5939[/C][C]0.117527[/C][C]0.058763[/C][/ROW]
[ROW][C]M3[/C][C]1.39878884642556[/C][C]0.953527[/C][C]1.467[/C][C]0.148908[/C][C]0.074454[/C][/ROW]
[ROW][C]M4[/C][C]1.29743004719855[/C][C]0.818321[/C][C]1.5855[/C][C]0.119425[/C][C]0.059712[/C][/ROW]
[ROW][C]M5[/C][C]1.02122293318781[/C][C]0.585976[/C][C]1.7428[/C][C]0.087777[/C][C]0.043889[/C][/ROW]
[ROW][C]M6[/C][C]1.29963924266591[/C][C]0.640737[/C][C]2.0284[/C][C]0.048093[/C][C]0.024046[/C][/ROW]
[ROW][C]M7[/C][C]1.49573623918489[/C][C]0.745156[/C][C]2.0073[/C][C]0.050368[/C][C]0.025184[/C][/ROW]
[ROW][C]M8[/C][C]1.63441962443005[/C][C]0.858452[/C][C]1.9039[/C][C]0.062925[/C][C]0.031463[/C][/ROW]
[ROW][C]M9[/C][C]1.36075205836195[/C][C]0.836164[/C][C]1.6274[/C][C]0.110205[/C][C]0.055103[/C][/ROW]
[ROW][C]M10[/C][C]1.11613685283547[/C][C]0.817791[/C][C]1.3648[/C][C]0.178674[/C][C]0.089337[/C][/ROW]
[ROW][C]M11[/C][C]1.8491789139581[/C][C]0.966608[/C][C]1.9131[/C][C]0.061716[/C][C]0.030858[/C][/ROW]
[/TABLE]
Source: https://freestatistics.org/blog/index.php?pk=69238&T=2

Globally Unique Identifier (entire table): ba.freestatistics.org/blog/index.php?pk=69238&T=2

As an alternative you can also use a QR Code:  

The GUIDs for individual cells are displayed in the table below:

Multiple Linear Regression - Ordinary Least Squares
VariableParameterS.D.T-STATH0: parameter = 02-tail p-value1-tail p-value
(Intercept)8.819681427138070.82440610.698200
Bruto_index-0.0323298590771640.015517-2.08350.042550.021275
M11.436382448340490.774341.8550.0697470.034874
M21.566034953306070.9825291.59390.1175270.058763
M31.398788846425560.9535271.4670.1489080.074454
M41.297430047198550.8183211.58550.1194250.059712
M51.021222933187810.5859761.74280.0877770.043889
M61.299639242665910.6407372.02840.0480930.024046
M71.495736239184890.7451562.00730.0503680.025184
M81.634419624430050.8584521.90390.0629250.031463
M91.360752058361950.8361641.62740.1102050.055103
M101.116136852835470.8177911.36480.1786740.089337
M111.84917891395810.9666081.91310.0617160.030858


Multiple Linear Regression - Regression Statistics
Multiple R0.423372626977428
R-squared0.179244381273768
Adjusted R-squared-0.0259445234077893
F-TEST (value)0.873557863920304
F-TEST (DF numerator)12
F-TEST (DF denominator)48
p-value0.578201528447169
Multiple Linear Regression - Residual Statistics
Residual Standard Deviation0.671486566251615
Sum Squared Residuals21.6429220155064

\begin{tabular}{lllllllll}
\hline
Multiple Linear Regression - Regression Statistics \tabularnewline
Multiple R & 0.423372626977428 \tabularnewline
R-squared & 0.179244381273768 \tabularnewline
Adjusted R-squared & -0.0259445234077893 \tabularnewline
F-TEST (value) & 0.873557863920304 \tabularnewline
F-TEST (DF numerator) & 12 \tabularnewline
F-TEST (DF denominator) & 48 \tabularnewline
p-value & 0.578201528447169 \tabularnewline
Multiple Linear Regression - Residual Statistics \tabularnewline
Residual Standard Deviation & 0.671486566251615 \tabularnewline
Sum Squared Residuals & 21.6429220155064 \tabularnewline
\hline
\end{tabular}
%Source: https://freestatistics.org/blog/index.php?pk=69238&T=3

[TABLE]
[ROW][C]Multiple Linear Regression - Regression Statistics[/C][/ROW]
[ROW][C]Multiple R[/C][C]0.423372626977428[/C][/ROW]
[ROW][C]R-squared[/C][C]0.179244381273768[/C][/ROW]
[ROW][C]Adjusted R-squared[/C][C]-0.0259445234077893[/C][/ROW]
[ROW][C]F-TEST (value)[/C][C]0.873557863920304[/C][/ROW]
[ROW][C]F-TEST (DF numerator)[/C][C]12[/C][/ROW]
[ROW][C]F-TEST (DF denominator)[/C][C]48[/C][/ROW]
[ROW][C]p-value[/C][C]0.578201528447169[/C][/ROW]
[ROW][C]Multiple Linear Regression - Residual Statistics[/C][/ROW]
[ROW][C]Residual Standard Deviation[/C][C]0.671486566251615[/C][/ROW]
[ROW][C]Sum Squared Residuals[/C][C]21.6429220155064[/C][/ROW]
[/TABLE]
Source: https://freestatistics.org/blog/index.php?pk=69238&T=3

Globally Unique Identifier (entire table): ba.freestatistics.org/blog/index.php?pk=69238&T=3

As an alternative you can also use a QR Code:  

The GUIDs for individual cells are displayed in the table below:

Multiple Linear Regression - Regression Statistics
Multiple R0.423372626977428
R-squared0.179244381273768
Adjusted R-squared-0.0259445234077893
F-TEST (value)0.873557863920304
F-TEST (DF numerator)12
F-TEST (DF denominator)48
p-value0.578201528447169
Multiple Linear Regression - Residual Statistics
Residual Standard Deviation0.671486566251615
Sum Squared Residuals21.6429220155064


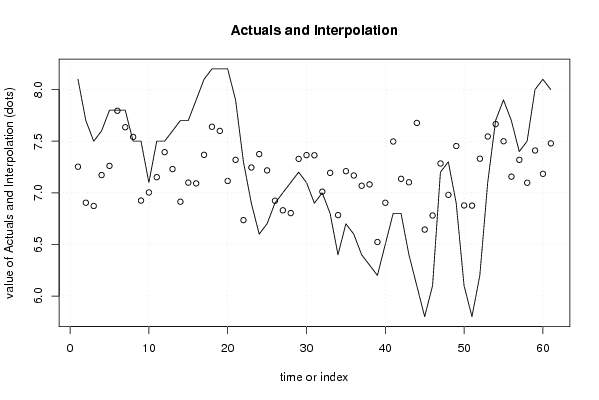
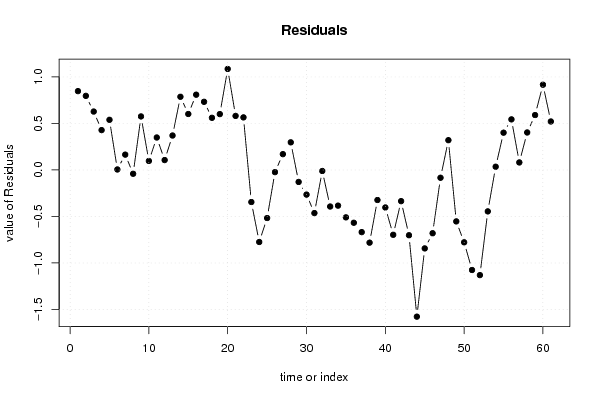
Multiple Linear Regression - Actuals, Interpolation, and Residuals
Time or IndexActualsInterpolationForecastResidualsPrediction Error
18.17.252619967210030.847380032789968
27.76.903790557833580.796209442166424
37.56.872329859077160.627670140922835
47.67.171861312406990.428138687593012
57.87.260981605968190.539018394031807
67.87.79480380215590.00519619784410598
77.87.635272348826070.164727651173929
87.57.54118074871564-0.0411807487156427
97.56.924816676429610.575183323570387
107.17.003500061674770.0964999383252329
117.57.151371673500730.348628326499271
127.57.393934641835140.106065358164858
137.67.229989065856010.370010934143988
147.76.913489515556730.786510484443275
157.77.098638872617310.601361127382688
167.97.091036664714080.808963335285923
178.17.367670140922840.732329859077163
188.27.639620478585510.560379521414493
198.27.599709503841190.600290496158809
208.27.114426608897081.08557339110292
217.97.319240957171010.580759042828986
227.36.73516223133430.564837768665695
236.97.2451282648245-0.345128264824504
246.67.37453672638884-0.774536726388844
256.77.21705712222515-0.517057122225146
266.96.92318847327987-0.0231884732798745
2776.830301042276850.169698957723149
287.16.803300918927320.296699081072682
297.27.32887431003024-0.128874310030239
307.17.36481667642961-0.264816676429613
316.97.3637015325779-0.463701532577892
3277.01097105985015-0.0109710598501535
336.87.19315450677007-0.393154506770074
346.46.78365701995005-0.383657019950051
356.77.20956541983962-0.509565419839624
366.67.16762562829499-0.567625628294995
376.47.06833977047019-0.668339770470192
386.37.08160478275798-0.781604782757979
396.26.52316738104379-0.323167381043793
406.56.90352348206653-0.403523482066526
416.87.49698957723149-0.696989577231493
426.87.13527467698175-0.335274676981749
436.47.10182967405286-0.701829674052864
446.17.67696615683973-1.57696615683973
455.86.64354690245829-0.843546902458286
466.16.78042403404233-0.680424034042335
477.27.2839240957171-0.0839240957171013
487.36.980112445647440.319887554352557
496.97.45306509348844-0.553065093488443
506.16.87792667057185-0.777926670571846
515.86.87556284498488-1.07556284498488
526.27.33027762188509-1.13027762188509
537.17.54548436584724-0.445484365847238
547.77.665484365847240.0345156341527624
557.97.499486940701980.400513059298018
567.77.156455425697390.543544574302608
577.47.319240957171010.0807590428289866
587.57.097256652998540.402743347001458
5987.410010546118040.589989453881958
608.17.183790557833580.916209442166424
6187.478928980750170.521071019249825

\begin{tabular}{lllllllll}
\hline
Multiple Linear Regression - Actuals, Interpolation, and Residuals \tabularnewline
Time or Index & Actuals & InterpolationForecast & ResidualsPrediction Error \tabularnewline
1 & 8.1 & 7.25261996721003 & 0.847380032789968 \tabularnewline
2 & 7.7 & 6.90379055783358 & 0.796209442166424 \tabularnewline
3 & 7.5 & 6.87232985907716 & 0.627670140922835 \tabularnewline
4 & 7.6 & 7.17186131240699 & 0.428138687593012 \tabularnewline
5 & 7.8 & 7.26098160596819 & 0.539018394031807 \tabularnewline
6 & 7.8 & 7.7948038021559 & 0.00519619784410598 \tabularnewline
7 & 7.8 & 7.63527234882607 & 0.164727651173929 \tabularnewline
8 & 7.5 & 7.54118074871564 & -0.0411807487156427 \tabularnewline
9 & 7.5 & 6.92481667642961 & 0.575183323570387 \tabularnewline
10 & 7.1 & 7.00350006167477 & 0.0964999383252329 \tabularnewline
11 & 7.5 & 7.15137167350073 & 0.348628326499271 \tabularnewline
12 & 7.5 & 7.39393464183514 & 0.106065358164858 \tabularnewline
13 & 7.6 & 7.22998906585601 & 0.370010934143988 \tabularnewline
14 & 7.7 & 6.91348951555673 & 0.786510484443275 \tabularnewline
15 & 7.7 & 7.09863887261731 & 0.601361127382688 \tabularnewline
16 & 7.9 & 7.09103666471408 & 0.808963335285923 \tabularnewline
17 & 8.1 & 7.36767014092284 & 0.732329859077163 \tabularnewline
18 & 8.2 & 7.63962047858551 & 0.560379521414493 \tabularnewline
19 & 8.2 & 7.59970950384119 & 0.600290496158809 \tabularnewline
20 & 8.2 & 7.11442660889708 & 1.08557339110292 \tabularnewline
21 & 7.9 & 7.31924095717101 & 0.580759042828986 \tabularnewline
22 & 7.3 & 6.7351622313343 & 0.564837768665695 \tabularnewline
23 & 6.9 & 7.2451282648245 & -0.345128264824504 \tabularnewline
24 & 6.6 & 7.37453672638884 & -0.774536726388844 \tabularnewline
25 & 6.7 & 7.21705712222515 & -0.517057122225146 \tabularnewline
26 & 6.9 & 6.92318847327987 & -0.0231884732798745 \tabularnewline
27 & 7 & 6.83030104227685 & 0.169698957723149 \tabularnewline
28 & 7.1 & 6.80330091892732 & 0.296699081072682 \tabularnewline
29 & 7.2 & 7.32887431003024 & -0.128874310030239 \tabularnewline
30 & 7.1 & 7.36481667642961 & -0.264816676429613 \tabularnewline
31 & 6.9 & 7.3637015325779 & -0.463701532577892 \tabularnewline
32 & 7 & 7.01097105985015 & -0.0109710598501535 \tabularnewline
33 & 6.8 & 7.19315450677007 & -0.393154506770074 \tabularnewline
34 & 6.4 & 6.78365701995005 & -0.383657019950051 \tabularnewline
35 & 6.7 & 7.20956541983962 & -0.509565419839624 \tabularnewline
36 & 6.6 & 7.16762562829499 & -0.567625628294995 \tabularnewline
37 & 6.4 & 7.06833977047019 & -0.668339770470192 \tabularnewline
38 & 6.3 & 7.08160478275798 & -0.781604782757979 \tabularnewline
39 & 6.2 & 6.52316738104379 & -0.323167381043793 \tabularnewline
40 & 6.5 & 6.90352348206653 & -0.403523482066526 \tabularnewline
41 & 6.8 & 7.49698957723149 & -0.696989577231493 \tabularnewline
42 & 6.8 & 7.13527467698175 & -0.335274676981749 \tabularnewline
43 & 6.4 & 7.10182967405286 & -0.701829674052864 \tabularnewline
44 & 6.1 & 7.67696615683973 & -1.57696615683973 \tabularnewline
45 & 5.8 & 6.64354690245829 & -0.843546902458286 \tabularnewline
46 & 6.1 & 6.78042403404233 & -0.680424034042335 \tabularnewline
47 & 7.2 & 7.2839240957171 & -0.0839240957171013 \tabularnewline
48 & 7.3 & 6.98011244564744 & 0.319887554352557 \tabularnewline
49 & 6.9 & 7.45306509348844 & -0.553065093488443 \tabularnewline
50 & 6.1 & 6.87792667057185 & -0.777926670571846 \tabularnewline
51 & 5.8 & 6.87556284498488 & -1.07556284498488 \tabularnewline
52 & 6.2 & 7.33027762188509 & -1.13027762188509 \tabularnewline
53 & 7.1 & 7.54548436584724 & -0.445484365847238 \tabularnewline
54 & 7.7 & 7.66548436584724 & 0.0345156341527624 \tabularnewline
55 & 7.9 & 7.49948694070198 & 0.400513059298018 \tabularnewline
56 & 7.7 & 7.15645542569739 & 0.543544574302608 \tabularnewline
57 & 7.4 & 7.31924095717101 & 0.0807590428289866 \tabularnewline
58 & 7.5 & 7.09725665299854 & 0.402743347001458 \tabularnewline
59 & 8 & 7.41001054611804 & 0.589989453881958 \tabularnewline
60 & 8.1 & 7.18379055783358 & 0.916209442166424 \tabularnewline
61 & 8 & 7.47892898075017 & 0.521071019249825 \tabularnewline
\hline
\end{tabular}
%Source: https://freestatistics.org/blog/index.php?pk=69238&T=4

[TABLE]
[ROW][C]Multiple Linear Regression - Actuals, Interpolation, and Residuals[/C][/ROW]
[ROW][C]Time or Index[/C][C]Actuals[/C][C]InterpolationForecast[/C][C]ResidualsPrediction Error[/C][/ROW]
[ROW][C]1[/C][C]8.1[/C][C]7.25261996721003[/C][C]0.847380032789968[/C][/ROW]
[ROW][C]2[/C][C]7.7[/C][C]6.90379055783358[/C][C]0.796209442166424[/C][/ROW]
[ROW][C]3[/C][C]7.5[/C][C]6.87232985907716[/C][C]0.627670140922835[/C][/ROW]
[ROW][C]4[/C][C]7.6[/C][C]7.17186131240699[/C][C]0.428138687593012[/C][/ROW]
[ROW][C]5[/C][C]7.8[/C][C]7.26098160596819[/C][C]0.539018394031807[/C][/ROW]
[ROW][C]6[/C][C]7.8[/C][C]7.7948038021559[/C][C]0.00519619784410598[/C][/ROW]
[ROW][C]7[/C][C]7.8[/C][C]7.63527234882607[/C][C]0.164727651173929[/C][/ROW]
[ROW][C]8[/C][C]7.5[/C][C]7.54118074871564[/C][C]-0.0411807487156427[/C][/ROW]
[ROW][C]9[/C][C]7.5[/C][C]6.92481667642961[/C][C]0.575183323570387[/C][/ROW]
[ROW][C]10[/C][C]7.1[/C][C]7.00350006167477[/C][C]0.0964999383252329[/C][/ROW]
[ROW][C]11[/C][C]7.5[/C][C]7.15137167350073[/C][C]0.348628326499271[/C][/ROW]
[ROW][C]12[/C][C]7.5[/C][C]7.39393464183514[/C][C]0.106065358164858[/C][/ROW]
[ROW][C]13[/C][C]7.6[/C][C]7.22998906585601[/C][C]0.370010934143988[/C][/ROW]
[ROW][C]14[/C][C]7.7[/C][C]6.91348951555673[/C][C]0.786510484443275[/C][/ROW]
[ROW][C]15[/C][C]7.7[/C][C]7.09863887261731[/C][C]0.601361127382688[/C][/ROW]
[ROW][C]16[/C][C]7.9[/C][C]7.09103666471408[/C][C]0.808963335285923[/C][/ROW]
[ROW][C]17[/C][C]8.1[/C][C]7.36767014092284[/C][C]0.732329859077163[/C][/ROW]
[ROW][C]18[/C][C]8.2[/C][C]7.63962047858551[/C][C]0.560379521414493[/C][/ROW]
[ROW][C]19[/C][C]8.2[/C][C]7.59970950384119[/C][C]0.600290496158809[/C][/ROW]
[ROW][C]20[/C][C]8.2[/C][C]7.11442660889708[/C][C]1.08557339110292[/C][/ROW]
[ROW][C]21[/C][C]7.9[/C][C]7.31924095717101[/C][C]0.580759042828986[/C][/ROW]
[ROW][C]22[/C][C]7.3[/C][C]6.7351622313343[/C][C]0.564837768665695[/C][/ROW]
[ROW][C]23[/C][C]6.9[/C][C]7.2451282648245[/C][C]-0.345128264824504[/C][/ROW]
[ROW][C]24[/C][C]6.6[/C][C]7.37453672638884[/C][C]-0.774536726388844[/C][/ROW]
[ROW][C]25[/C][C]6.7[/C][C]7.21705712222515[/C][C]-0.517057122225146[/C][/ROW]
[ROW][C]26[/C][C]6.9[/C][C]6.92318847327987[/C][C]-0.0231884732798745[/C][/ROW]
[ROW][C]27[/C][C]7[/C][C]6.83030104227685[/C][C]0.169698957723149[/C][/ROW]
[ROW][C]28[/C][C]7.1[/C][C]6.80330091892732[/C][C]0.296699081072682[/C][/ROW]
[ROW][C]29[/C][C]7.2[/C][C]7.32887431003024[/C][C]-0.128874310030239[/C][/ROW]
[ROW][C]30[/C][C]7.1[/C][C]7.36481667642961[/C][C]-0.264816676429613[/C][/ROW]
[ROW][C]31[/C][C]6.9[/C][C]7.3637015325779[/C][C]-0.463701532577892[/C][/ROW]
[ROW][C]32[/C][C]7[/C][C]7.01097105985015[/C][C]-0.0109710598501535[/C][/ROW]
[ROW][C]33[/C][C]6.8[/C][C]7.19315450677007[/C][C]-0.393154506770074[/C][/ROW]
[ROW][C]34[/C][C]6.4[/C][C]6.78365701995005[/C][C]-0.383657019950051[/C][/ROW]
[ROW][C]35[/C][C]6.7[/C][C]7.20956541983962[/C][C]-0.509565419839624[/C][/ROW]
[ROW][C]36[/C][C]6.6[/C][C]7.16762562829499[/C][C]-0.567625628294995[/C][/ROW]
[ROW][C]37[/C][C]6.4[/C][C]7.06833977047019[/C][C]-0.668339770470192[/C][/ROW]
[ROW][C]38[/C][C]6.3[/C][C]7.08160478275798[/C][C]-0.781604782757979[/C][/ROW]
[ROW][C]39[/C][C]6.2[/C][C]6.52316738104379[/C][C]-0.323167381043793[/C][/ROW]
[ROW][C]40[/C][C]6.5[/C][C]6.90352348206653[/C][C]-0.403523482066526[/C][/ROW]
[ROW][C]41[/C][C]6.8[/C][C]7.49698957723149[/C][C]-0.696989577231493[/C][/ROW]
[ROW][C]42[/C][C]6.8[/C][C]7.13527467698175[/C][C]-0.335274676981749[/C][/ROW]
[ROW][C]43[/C][C]6.4[/C][C]7.10182967405286[/C][C]-0.701829674052864[/C][/ROW]
[ROW][C]44[/C][C]6.1[/C][C]7.67696615683973[/C][C]-1.57696615683973[/C][/ROW]
[ROW][C]45[/C][C]5.8[/C][C]6.64354690245829[/C][C]-0.843546902458286[/C][/ROW]
[ROW][C]46[/C][C]6.1[/C][C]6.78042403404233[/C][C]-0.680424034042335[/C][/ROW]
[ROW][C]47[/C][C]7.2[/C][C]7.2839240957171[/C][C]-0.0839240957171013[/C][/ROW]
[ROW][C]48[/C][C]7.3[/C][C]6.98011244564744[/C][C]0.319887554352557[/C][/ROW]
[ROW][C]49[/C][C]6.9[/C][C]7.45306509348844[/C][C]-0.553065093488443[/C][/ROW]
[ROW][C]50[/C][C]6.1[/C][C]6.87792667057185[/C][C]-0.777926670571846[/C][/ROW]
[ROW][C]51[/C][C]5.8[/C][C]6.87556284498488[/C][C]-1.07556284498488[/C][/ROW]
[ROW][C]52[/C][C]6.2[/C][C]7.33027762188509[/C][C]-1.13027762188509[/C][/ROW]
[ROW][C]53[/C][C]7.1[/C][C]7.54548436584724[/C][C]-0.445484365847238[/C][/ROW]
[ROW][C]54[/C][C]7.7[/C][C]7.66548436584724[/C][C]0.0345156341527624[/C][/ROW]
[ROW][C]55[/C][C]7.9[/C][C]7.49948694070198[/C][C]0.400513059298018[/C][/ROW]
[ROW][C]56[/C][C]7.7[/C][C]7.15645542569739[/C][C]0.543544574302608[/C][/ROW]
[ROW][C]57[/C][C]7.4[/C][C]7.31924095717101[/C][C]0.0807590428289866[/C][/ROW]
[ROW][C]58[/C][C]7.5[/C][C]7.09725665299854[/C][C]0.402743347001458[/C][/ROW]
[ROW][C]59[/C][C]8[/C][C]7.41001054611804[/C][C]0.589989453881958[/C][/ROW]
[ROW][C]60[/C][C]8.1[/C][C]7.18379055783358[/C][C]0.916209442166424[/C][/ROW]
[ROW][C]61[/C][C]8[/C][C]7.47892898075017[/C][C]0.521071019249825[/C][/ROW]
[/TABLE]
Source: https://freestatistics.org/blog/index.php?pk=69238&T=4

Globally Unique Identifier (entire table): ba.freestatistics.org/blog/index.php?pk=69238&T=4

As an alternative you can also use a QR Code:  

The GUIDs for individual cells are displayed in the table below:

Multiple Linear Regression - Actuals, Interpolation, and Residuals
Time or IndexActualsInterpolationForecastResidualsPrediction Error
18.17.252619967210030.847380032789968
27.76.903790557833580.796209442166424
37.56.872329859077160.627670140922835
47.67.171861312406990.428138687593012
57.87.260981605968190.539018394031807
67.87.79480380215590.00519619784410598
77.87.635272348826070.164727651173929
87.57.54118074871564-0.0411807487156427
97.56.924816676429610.575183323570387
107.17.003500061674770.0964999383252329
117.57.151371673500730.348628326499271
127.57.393934641835140.106065358164858
137.67.229989065856010.370010934143988
147.76.913489515556730.786510484443275
157.77.098638872617310.601361127382688
167.97.091036664714080.808963335285923
178.17.367670140922840.732329859077163
188.27.639620478585510.560379521414493
198.27.599709503841190.600290496158809
208.27.114426608897081.08557339110292
217.97.319240957171010.580759042828986
227.36.73516223133430.564837768665695
236.97.2451282648245-0.345128264824504
246.67.37453672638884-0.774536726388844
256.77.21705712222515-0.517057122225146
266.96.92318847327987-0.0231884732798745
2776.830301042276850.169698957723149
287.16.803300918927320.296699081072682
297.27.32887431003024-0.128874310030239
307.17.36481667642961-0.264816676429613
316.97.3637015325779-0.463701532577892
3277.01097105985015-0.0109710598501535
336.87.19315450677007-0.393154506770074
346.46.78365701995005-0.383657019950051
356.77.20956541983962-0.509565419839624
366.67.16762562829499-0.567625628294995
376.47.06833977047019-0.668339770470192
386.37.08160478275798-0.781604782757979
396.26.52316738104379-0.323167381043793
406.56.90352348206653-0.403523482066526
416.87.49698957723149-0.696989577231493
426.87.13527467698175-0.335274676981749
436.47.10182967405286-0.701829674052864
446.17.67696615683973-1.57696615683973
455.86.64354690245829-0.843546902458286
466.16.78042403404233-0.680424034042335
477.27.2839240957171-0.0839240957171013
487.36.980112445647440.319887554352557
496.97.45306509348844-0.553065093488443
506.16.87792667057185-0.777926670571846
515.86.87556284498488-1.07556284498488
526.27.33027762188509-1.13027762188509
537.17.54548436584724-0.445484365847238
547.77.665484365847240.0345156341527624
557.97.499486940701980.400513059298018
567.77.156455425697390.543544574302608
577.47.319240957171010.0807590428289866
587.57.097256652998540.402743347001458
5987.410010546118040.589989453881958
608.17.183790557833580.916209442166424
6187.478928980750170.521071019249825


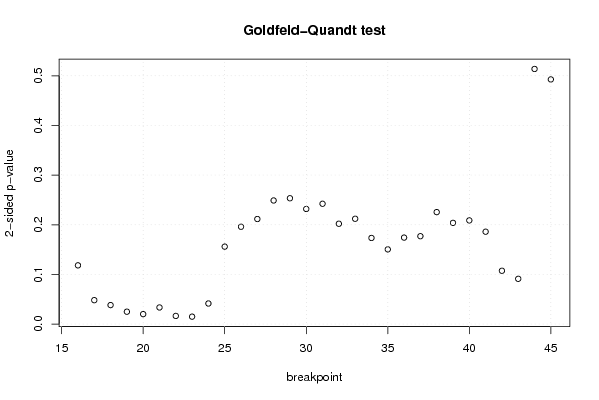
Goldfeld-Quandt test for Heteroskedasticity
p-valuesAlternative Hypothesis
breakpoint indexgreater2-sidedless
160.05913944140050240.1182788828010050.940860558599498
170.02408756550330810.04817513100661620.975912434496692
180.01911935584981270.03823871169962540.980880644150187
190.01247732580929740.02495465161859480.987522674190703
200.01002101321954650.02004202643909300.989978986780454
210.01673588436055840.03347176872111680.983264115639442
220.008215713141442450.01643142628288490.991784286858558
230.007484595278415560.01496919055683110.992515404721585
240.02072178023914300.04144356047828610.979278219760857
250.07797314331375530.1559462866275110.922026856686245
260.09799989273289260.1959997854657850.902000107267107
270.1057674166575620.2115348333151240.894232583342438
280.1244324103752790.2488648207505590.87556758962472
290.1266756923499510.2533513846999020.873324307650049
300.1159084743345840.2318169486691670.884091525665416
310.1211370738320960.2422741476641910.878862926167904
320.1010095051093820.2020190102187650.898990494890618
330.1060290651904790.2120581303809580.893970934809521
340.08671306012976370.1734261202595270.913286939870236
350.07522475498386160.1504495099677230.924775245016138
360.08707956771563090.1741591354312620.912920432284369
370.08846210838087970.1769242167617590.91153789161912
380.1127243521609780.2254487043219550.887275647839022
390.1019067202004150.2038134404008290.898093279799585
400.1043819309219230.2087638618438470.895618069078077
410.09299399030219040.1859879806043810.90700600969781
420.05367419712032140.1073483942406430.946325802879679
430.04557582880859480.09115165761718960.954424171191405
440.743157147783250.51368570443350.25684285221675
450.7537005616008710.4925988767982570.246299438399129

\begin{tabular}{lllllllll}
\hline
Goldfeld-Quandt test for Heteroskedasticity \tabularnewline
p-values & Alternative Hypothesis \tabularnewline
breakpoint index & greater & 2-sided & less \tabularnewline
16 & 0.0591394414005024 & 0.118278882801005 & 0.940860558599498 \tabularnewline
17 & 0.0240875655033081 & 0.0481751310066162 & 0.975912434496692 \tabularnewline
18 & 0.0191193558498127 & 0.0382387116996254 & 0.980880644150187 \tabularnewline
19 & 0.0124773258092974 & 0.0249546516185948 & 0.987522674190703 \tabularnewline
20 & 0.0100210132195465 & 0.0200420264390930 & 0.989978986780454 \tabularnewline
21 & 0.0167358843605584 & 0.0334717687211168 & 0.983264115639442 \tabularnewline
22 & 0.00821571314144245 & 0.0164314262828849 & 0.991784286858558 \tabularnewline
23 & 0.00748459527841556 & 0.0149691905568311 & 0.992515404721585 \tabularnewline
24 & 0.0207217802391430 & 0.0414435604782861 & 0.979278219760857 \tabularnewline
25 & 0.0779731433137553 & 0.155946286627511 & 0.922026856686245 \tabularnewline
26 & 0.0979998927328926 & 0.195999785465785 & 0.902000107267107 \tabularnewline
27 & 0.105767416657562 & 0.211534833315124 & 0.894232583342438 \tabularnewline
28 & 0.124432410375279 & 0.248864820750559 & 0.87556758962472 \tabularnewline
29 & 0.126675692349951 & 0.253351384699902 & 0.873324307650049 \tabularnewline
30 & 0.115908474334584 & 0.231816948669167 & 0.884091525665416 \tabularnewline
31 & 0.121137073832096 & 0.242274147664191 & 0.878862926167904 \tabularnewline
32 & 0.101009505109382 & 0.202019010218765 & 0.898990494890618 \tabularnewline
33 & 0.106029065190479 & 0.212058130380958 & 0.893970934809521 \tabularnewline
34 & 0.0867130601297637 & 0.173426120259527 & 0.913286939870236 \tabularnewline
35 & 0.0752247549838616 & 0.150449509967723 & 0.924775245016138 \tabularnewline
36 & 0.0870795677156309 & 0.174159135431262 & 0.912920432284369 \tabularnewline
37 & 0.0884621083808797 & 0.176924216761759 & 0.91153789161912 \tabularnewline
38 & 0.112724352160978 & 0.225448704321955 & 0.887275647839022 \tabularnewline
39 & 0.101906720200415 & 0.203813440400829 & 0.898093279799585 \tabularnewline
40 & 0.104381930921923 & 0.208763861843847 & 0.895618069078077 \tabularnewline
41 & 0.0929939903021904 & 0.185987980604381 & 0.90700600969781 \tabularnewline
42 & 0.0536741971203214 & 0.107348394240643 & 0.946325802879679 \tabularnewline
43 & 0.0455758288085948 & 0.0911516576171896 & 0.954424171191405 \tabularnewline
44 & 0.74315714778325 & 0.5136857044335 & 0.25684285221675 \tabularnewline
45 & 0.753700561600871 & 0.492598876798257 & 0.246299438399129 \tabularnewline
\hline
\end{tabular}
%Source: https://freestatistics.org/blog/index.php?pk=69238&T=5

[TABLE]
[ROW][C]Goldfeld-Quandt test for Heteroskedasticity[/C][/ROW]
[ROW][C]p-values[/C][C]Alternative Hypothesis[/C][/ROW]
[ROW][C]breakpoint index[/C][C]greater[/C][C]2-sided[/C][C]less[/C][/ROW]
[ROW][C]16[/C][C]0.0591394414005024[/C][C]0.118278882801005[/C][C]0.940860558599498[/C][/ROW]
[ROW][C]17[/C][C]0.0240875655033081[/C][C]0.0481751310066162[/C][C]0.975912434496692[/C][/ROW]
[ROW][C]18[/C][C]0.0191193558498127[/C][C]0.0382387116996254[/C][C]0.980880644150187[/C][/ROW]
[ROW][C]19[/C][C]0.0124773258092974[/C][C]0.0249546516185948[/C][C]0.987522674190703[/C][/ROW]
[ROW][C]20[/C][C]0.0100210132195465[/C][C]0.0200420264390930[/C][C]0.989978986780454[/C][/ROW]
[ROW][C]21[/C][C]0.0167358843605584[/C][C]0.0334717687211168[/C][C]0.983264115639442[/C][/ROW]
[ROW][C]22[/C][C]0.00821571314144245[/C][C]0.0164314262828849[/C][C]0.991784286858558[/C][/ROW]
[ROW][C]23[/C][C]0.00748459527841556[/C][C]0.0149691905568311[/C][C]0.992515404721585[/C][/ROW]
[ROW][C]24[/C][C]0.0207217802391430[/C][C]0.0414435604782861[/C][C]0.979278219760857[/C][/ROW]
[ROW][C]25[/C][C]0.0779731433137553[/C][C]0.155946286627511[/C][C]0.922026856686245[/C][/ROW]
[ROW][C]26[/C][C]0.0979998927328926[/C][C]0.195999785465785[/C][C]0.902000107267107[/C][/ROW]
[ROW][C]27[/C][C]0.105767416657562[/C][C]0.211534833315124[/C][C]0.894232583342438[/C][/ROW]
[ROW][C]28[/C][C]0.124432410375279[/C][C]0.248864820750559[/C][C]0.87556758962472[/C][/ROW]
[ROW][C]29[/C][C]0.126675692349951[/C][C]0.253351384699902[/C][C]0.873324307650049[/C][/ROW]
[ROW][C]30[/C][C]0.115908474334584[/C][C]0.231816948669167[/C][C]0.884091525665416[/C][/ROW]
[ROW][C]31[/C][C]0.121137073832096[/C][C]0.242274147664191[/C][C]0.878862926167904[/C][/ROW]
[ROW][C]32[/C][C]0.101009505109382[/C][C]0.202019010218765[/C][C]0.898990494890618[/C][/ROW]
[ROW][C]33[/C][C]0.106029065190479[/C][C]0.212058130380958[/C][C]0.893970934809521[/C][/ROW]
[ROW][C]34[/C][C]0.0867130601297637[/C][C]0.173426120259527[/C][C]0.913286939870236[/C][/ROW]
[ROW][C]35[/C][C]0.0752247549838616[/C][C]0.150449509967723[/C][C]0.924775245016138[/C][/ROW]
[ROW][C]36[/C][C]0.0870795677156309[/C][C]0.174159135431262[/C][C]0.912920432284369[/C][/ROW]
[ROW][C]37[/C][C]0.0884621083808797[/C][C]0.176924216761759[/C][C]0.91153789161912[/C][/ROW]
[ROW][C]38[/C][C]0.112724352160978[/C][C]0.225448704321955[/C][C]0.887275647839022[/C][/ROW]
[ROW][C]39[/C][C]0.101906720200415[/C][C]0.203813440400829[/C][C]0.898093279799585[/C][/ROW]
[ROW][C]40[/C][C]0.104381930921923[/C][C]0.208763861843847[/C][C]0.895618069078077[/C][/ROW]
[ROW][C]41[/C][C]0.0929939903021904[/C][C]0.185987980604381[/C][C]0.90700600969781[/C][/ROW]
[ROW][C]42[/C][C]0.0536741971203214[/C][C]0.107348394240643[/C][C]0.946325802879679[/C][/ROW]
[ROW][C]43[/C][C]0.0455758288085948[/C][C]0.0911516576171896[/C][C]0.954424171191405[/C][/ROW]
[ROW][C]44[/C][C]0.74315714778325[/C][C]0.5136857044335[/C][C]0.25684285221675[/C][/ROW]
[ROW][C]45[/C][C]0.753700561600871[/C][C]0.492598876798257[/C][C]0.246299438399129[/C][/ROW]
[/TABLE]
Source: https://freestatistics.org/blog/index.php?pk=69238&T=5

Globally Unique Identifier (entire table): ba.freestatistics.org/blog/index.php?pk=69238&T=5

As an alternative you can also use a QR Code:  

The GUIDs for individual cells are displayed in the table below:

Goldfeld-Quandt test for Heteroskedasticity
p-valuesAlternative Hypothesis
breakpoint indexgreater2-sidedless
160.05913944140050240.1182788828010050.940860558599498
170.02408756550330810.04817513100661620.975912434496692
180.01911935584981270.03823871169962540.980880644150187
190.01247732580929740.02495465161859480.987522674190703
200.01002101321954650.02004202643909300.989978986780454
210.01673588436055840.03347176872111680.983264115639442
220.008215713141442450.01643142628288490.991784286858558
230.007484595278415560.01496919055683110.992515404721585
240.02072178023914300.04144356047828610.979278219760857
250.07797314331375530.1559462866275110.922026856686245
260.09799989273289260.1959997854657850.902000107267107
270.1057674166575620.2115348333151240.894232583342438
280.1244324103752790.2488648207505590.87556758962472
290.1266756923499510.2533513846999020.873324307650049
300.1159084743345840.2318169486691670.884091525665416
310.1211370738320960.2422741476641910.878862926167904
320.1010095051093820.2020190102187650.898990494890618
330.1060290651904790.2120581303809580.893970934809521
340.08671306012976370.1734261202595270.913286939870236
350.07522475498386160.1504495099677230.924775245016138
360.08707956771563090.1741591354312620.912920432284369
370.08846210838087970.1769242167617590.91153789161912
380.1127243521609780.2254487043219550.887275647839022
390.1019067202004150.2038134404008290.898093279799585
400.1043819309219230.2087638618438470.895618069078077
410.09299399030219040.1859879806043810.90700600969781
420.05367419712032140.1073483942406430.946325802879679
430.04557582880859480.09115165761718960.954424171191405
440.743157147783250.51368570443350.25684285221675
450.7537005616008710.4925988767982570.246299438399129


Meta Analysis of Goldfeld-Quandt test for Heteroskedasticity
Description# significant tests% significant testsOK/NOK
1% type I error level00OK
5% type I error level80.266666666666667NOK
10% type I error level90.3NOK

\begin{tabular}{lllllllll}
\hline
Meta Analysis of Goldfeld-Quandt test for Heteroskedasticity \tabularnewline
Description & # significant tests & % significant tests & OK/NOK \tabularnewline
1% type I error level & 0 & 0 & OK \tabularnewline
5% type I error level & 8 & 0.266666666666667 & NOK \tabularnewline
10% type I error level & 9 & 0.3 & NOK \tabularnewline
\hline
\end{tabular}
%Source: https://freestatistics.org/blog/index.php?pk=69238&T=6

[TABLE]
[ROW][C]Meta Analysis of Goldfeld-Quandt test for Heteroskedasticity[/C][/ROW]
[ROW][C]Description[/C][C]# significant tests[/C][C]% significant tests[/C][C]OK/NOK[/C][/ROW]
[ROW][C]1% type I error level[/C][C]0[/C][C]0[/C][C]OK[/C][/ROW]
[ROW][C]5% type I error level[/C][C]8[/C][C]0.266666666666667[/C][C]NOK[/C][/ROW]
[ROW][C]10% type I error level[/C][C]9[/C][C]0.3[/C][C]NOK[/C][/ROW]
[/TABLE]
Source: https://freestatistics.org/blog/index.php?pk=69238&T=6

Globally Unique Identifier (entire table): ba.freestatistics.org/blog/index.php?pk=69238&T=6

As an alternative you can also use a QR Code:  

The GUIDs for individual cells are displayed in the table below:

Meta Analysis of Goldfeld-Quandt test for Heteroskedasticity
Description# significant tests% significant testsOK/NOK
1% type I error level00OK
5% type I error level80.266666666666667NOK
10% type I error level90.3NOK


Parameters (Session):
par1 = 1 ; par2 = Include Monthly Dummies ; par3 = No Linear Trend ;
Parameters (R input):
par1 = 1 ; par2 = Include Monthly Dummies ; par3 = No Linear Trend ;
R code (references can be found in the software module):
library(lattice)
library(lmtest)
n25 <- 25 #minimum number of obs. for Goldfeld-Quandt test
par1 <- as.numeric(par1)
x <- t(y)
k <- length(x[1,])
n <- length(x[,1])
x1 <- cbind(x[,par1], x[,1:k!=par1])
mycolnames <- c(colnames(x)[par1], colnames(x)[1:k!=par1])
colnames(x1) <- mycolnames #colnames(x)[par1]
x <- x1
if (par3 == 'First Differences'){
x2 <- array(0, dim=c(n-1,k), dimnames=list(1:(n-1), paste('(1-B)',colnames(x),sep='')))
for (i in 1:n-1) {
for (j in 1:k) {
x2[i,j] <- x[i+1,j] - x[i,j]
}
}
x <- x2
}
if (par2 == 'Include Monthly Dummies'){
x2 <- array(0, dim=c(n,11), dimnames=list(1:n, paste('M', seq(1:11), sep ='')))
for (i in 1:11){
x2[seq(i,n,12),i] <- 1
}
x <- cbind(x, x2)
}
if (par2 == 'Include Quarterly Dummies'){
x2 <- array(0, dim=c(n,3), dimnames=list(1:n, paste('Q', seq(1:3), sep ='')))
for (i in 1:3){
x2[seq(i,n,4),i] <- 1
}
x <- cbind(x, x2)
}
k <- length(x[1,])
if (par3 == 'Linear Trend'){
x <- cbind(x, c(1:n))
colnames(x)[k+1] <- 't'
}
x
k <- length(x[1,])
df <- as.data.frame(x)
(mylm <- lm(df))
(mysum <- summary(mylm))
if (n > n25) {
kp3 <- k + 3
nmkm3 <- n - k - 3
gqarr <- array(NA, dim=c(nmkm3-kp3+1,3))
numgqtests <- 0
numsignificant1 <- 0
numsignificant5 <- 0
numsignificant10 <- 0
for (mypoint in kp3:nmkm3) {
j <- 0
numgqtests <- numgqtests + 1
for (myalt in c('greater', 'two.sided', 'less')) {
j <- j + 1
gqarr[mypoint-kp3+1,j] <- gqtest(mylm, point=mypoint, alternative=myalt)$p.value
}
if (gqarr[mypoint-kp3+1,2] < 0.01) numsignificant1 <- numsignificant1 + 1
if (gqarr[mypoint-kp3+1,2] < 0.05) numsignificant5 <- numsignificant5 + 1
if (gqarr[mypoint-kp3+1,2] < 0.10) numsignificant10 <- numsignificant10 + 1
}
gqarr
}
bitmap(file='test0.png')
plot(x[,1], type='l', main='Actuals and Interpolation', ylab='value of Actuals and Interpolation (dots)', xlab='time or index')
points(x[,1]-mysum$resid)
grid()
dev.off()
bitmap(file='test1.png')
plot(mysum$resid, type='b', pch=19, main='Residuals', ylab='value of Residuals', xlab='time or index')
grid()
dev.off()
bitmap(file='test2.png')
hist(mysum$resid, main='Residual Histogram', xlab='values of Residuals')
grid()
dev.off()
bitmap(file='test3.png')
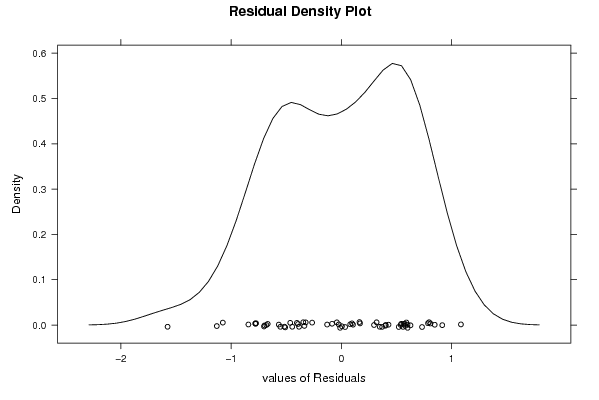
densityplot(~mysum$resid,col='black',main='Residual Density Plot', xlab='values of Residuals')
dev.off()
bitmap(file='test4.png')
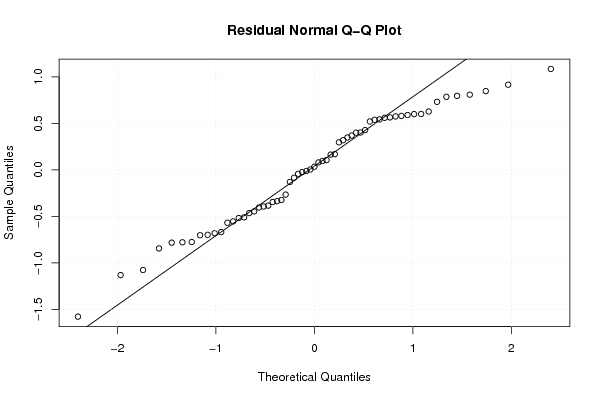
qqnorm(mysum$resid, main='Residual Normal Q-Q Plot')
qqline(mysum$resid)
grid()
dev.off()
(myerror <- as.ts(mysum$resid))
bitmap(file='test5.png')
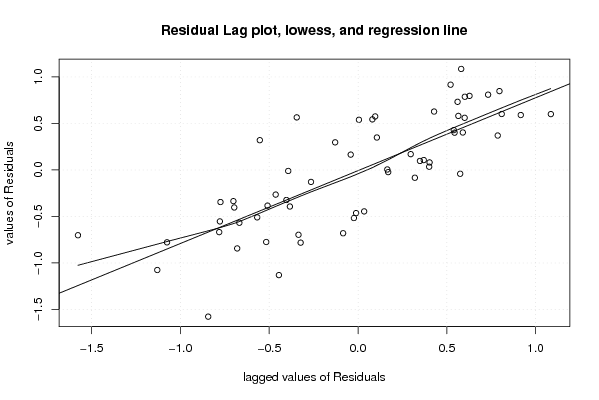
dum <- cbind(lag(myerror,k=1),myerror)
dum
dum1 <- dum[2:length(myerror),]
dum1
z <- as.data.frame(dum1)
z
plot(z,main=paste('Residual Lag plot, lowess, and regression line'), ylab='values of Residuals', xlab='lagged values of Residuals')
lines(lowess(z))
abline(lm(z))
grid()
dev.off()
bitmap(file='test6.png')
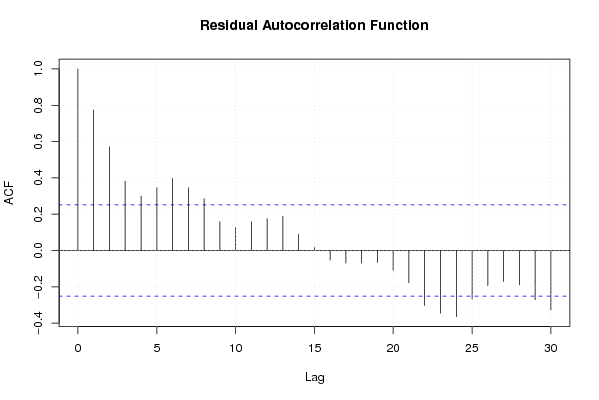
acf(mysum$resid, lag.max=length(mysum$resid)/2, main='Residual Autocorrelation Function')
grid()
dev.off()
bitmap(file='test7.png')
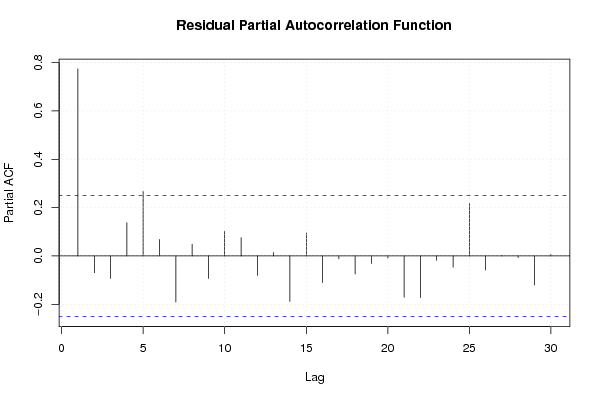
pacf(mysum$resid, lag.max=length(mysum$resid)/2, main='Residual Partial Autocorrelation Function')
grid()
dev.off()
bitmap(file='test8.png')
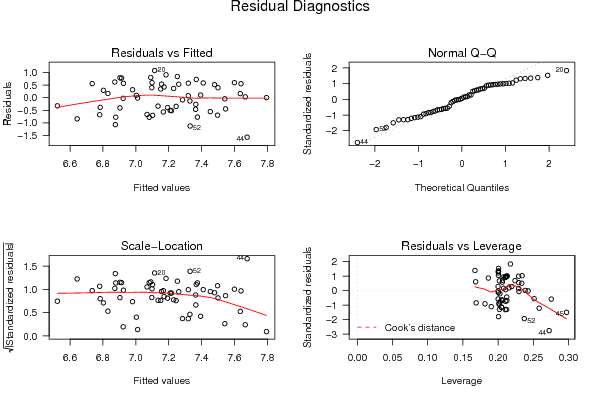
opar <- par(mfrow = c(2,2), oma = c(0, 0, 1.1, 0))
plot(mylm, las = 1, sub='Residual Diagnostics')
par(opar)
dev.off()
if (n > n25) {
bitmap(file='test9.png')
plot(kp3:nmkm3,gqarr[,2], main='Goldfeld-Quandt test',ylab='2-sided p-value',xlab='breakpoint')
grid()
dev.off()
}
load(file='createtable')
a<-table.start()
a<-table.row.start(a)
a<-table.element(a, 'Multiple Linear Regression - Estimated Regression Equation', 1, TRUE)
a<-table.row.end(a)
myeq <- colnames(x)[1]
myeq <- paste(myeq, '[t] = ', sep='')
for (i in 1:k){
if (mysum$coefficients[i,1] > 0) myeq <- paste(myeq, '+', '')
myeq <- paste(myeq, mysum$coefficients[i,1], sep=' ')
if (rownames(mysum$coefficients)[i] != '(Intercept)') {
myeq <- paste(myeq, rownames(mysum$coefficients)[i], sep='')
if (rownames(mysum$coefficients)[i] != 't') myeq <- paste(myeq, '[t]', sep='')
}
}
myeq <- paste(myeq, ' + e[t]')
a<-table.row.start(a)
a<-table.element(a, myeq)
a<-table.row.end(a)
a<-table.end(a)
table.save(a,file='mytable1.tab')
a<-table.start()
a<-table.row.start(a)
a<-table.element(a,hyperlink('ols1.htm','Multiple Linear Regression - Ordinary Least Squares',''), 6, TRUE)
a<-table.row.end(a)
a<-table.row.start(a)
a<-table.element(a,'Variable',header=TRUE)
a<-table.element(a,'Parameter',header=TRUE)
a<-table.element(a,'S.D.',header=TRUE)
a<-table.element(a,'T-STAT
H0: parameter = 0',header=TRUE)
a<-table.element(a,'2-tail p-value',header=TRUE)
a<-table.element(a,'1-tail p-value',header=TRUE)
a<-table.row.end(a)
for (i in 1:k){
a<-table.row.start(a)
a<-table.element(a,rownames(mysum$coefficients)[i],header=TRUE)
a<-table.element(a,mysum$coefficients[i,1])
a<-table.element(a, round(mysum$coefficients[i,2],6))
a<-table.element(a, round(mysum$coefficients[i,3],4))
a<-table.element(a, round(mysum$coefficients[i,4],6))
a<-table.element(a, round(mysum$coefficients[i,4]/2,6))
a<-table.row.end(a)
}
a<-table.end(a)
table.save(a,file='mytable2.tab')
a<-table.start()
a<-table.row.start(a)
a<-table.element(a, 'Multiple Linear Regression - Regression Statistics', 2, TRUE)
a<-table.row.end(a)
a<-table.row.start(a)
a<-table.element(a, 'Multiple R',1,TRUE)
a<-table.element(a, sqrt(mysum$r.squared))
a<-table.row.end(a)
a<-table.row.start(a)
a<-table.element(a, 'R-squared',1,TRUE)
a<-table.element(a, mysum$r.squared)
a<-table.row.end(a)
a<-table.row.start(a)
a<-table.element(a, 'Adjusted R-squared',1,TRUE)
a<-table.element(a, mysum$adj.r.squared)
a<-table.row.end(a)
a<-table.row.start(a)
a<-table.element(a, 'F-TEST (value)',1,TRUE)
a<-table.element(a, mysum$fstatistic[1])
a<-table.row.end(a)
a<-table.row.start(a)
a<-table.element(a, 'F-TEST (DF numerator)',1,TRUE)
a<-table.element(a, mysum$fstatistic[2])
a<-table.row.end(a)
a<-table.row.start(a)
a<-table.element(a, 'F-TEST (DF denominator)',1,TRUE)
a<-table.element(a, mysum$fstatistic[3])
a<-table.row.end(a)
a<-table.row.start(a)
a<-table.element(a, 'p-value',1,TRUE)
a<-table.element(a, 1-pf(mysum$fstatistic[1],mysum$fstatistic[2],mysum$fstatistic[3]))
a<-table.row.end(a)
a<-table.row.start(a)
a<-table.element(a, 'Multiple Linear Regression - Residual Statistics', 2, TRUE)
a<-table.row.end(a)
a<-table.row.start(a)
a<-table.element(a, 'Residual Standard Deviation',1,TRUE)
a<-table.element(a, mysum$sigma)
a<-table.row.end(a)
a<-table.row.start(a)
a<-table.element(a, 'Sum Squared Residuals',1,TRUE)
a<-table.element(a, sum(myerror*myerror))
a<-table.row.end(a)
a<-table.end(a)
table.save(a,file='mytable3.tab')
a<-table.start()
a<-table.row.start(a)
a<-table.element(a, 'Multiple Linear Regression - Actuals, Interpolation, and Residuals', 4, TRUE)
a<-table.row.end(a)
a<-table.row.start(a)
a<-table.element(a, 'Time or Index', 1, TRUE)
a<-table.element(a, 'Actuals', 1, TRUE)
a<-table.element(a, 'Interpolation
Forecast', 1, TRUE)
a<-table.element(a, 'Residuals
Prediction Error', 1, TRUE)
a<-table.row.end(a)
for (i in 1:n) {
a<-table.row.start(a)
a<-table.element(a,i, 1, TRUE)
a<-table.element(a,x[i])
a<-table.element(a,x[i]-mysum$resid[i])
a<-table.element(a,mysum$resid[i])
a<-table.row.end(a)
}
a<-table.end(a)
table.save(a,file='mytable4.tab')
if (n > n25) {
a<-table.start()
a<-table.row.start(a)
a<-table.element(a,'Goldfeld-Quandt test for Heteroskedasticity',4,TRUE)
a<-table.row.end(a)
a<-table.row.start(a)
a<-table.element(a,'p-values',header=TRUE)
a<-table.element(a,'Alternative Hypothesis',3,header=TRUE)
a<-table.row.end(a)
a<-table.row.start(a)
a<-table.element(a,'breakpoint index',header=TRUE)
a<-table.element(a,'greater',header=TRUE)
a<-table.element(a,'2-sided',header=TRUE)
a<-table.element(a,'less',header=TRUE)
a<-table.row.end(a)
for (mypoint in kp3:nmkm3) {
a<-table.row.start(a)
a<-table.element(a,mypoint,header=TRUE)
a<-table.element(a,gqarr[mypoint-kp3+1,1])
a<-table.element(a,gqarr[mypoint-kp3+1,2])
a<-table.element(a,gqarr[mypoint-kp3+1,3])
a<-table.row.end(a)
}
a<-table.end(a)
table.save(a,file='mytable5.tab')
a<-table.start()
a<-table.row.start(a)
a<-table.element(a,'Meta Analysis of Goldfeld-Quandt test for Heteroskedasticity',4,TRUE)
a<-table.row.end(a)
a<-table.row.start(a)
a<-table.element(a,'Description',header=TRUE)
a<-table.element(a,'# significant tests',header=TRUE)
a<-table.element(a,'% significant tests',header=TRUE)
a<-table.element(a,'OK/NOK',header=TRUE)
a<-table.row.end(a)
a<-table.row.start(a)
a<-table.element(a,'1% type I error level',header=TRUE)
a<-table.element(a,numsignificant1)
a<-table.element(a,numsignificant1/numgqtests)
if (numsignificant1/numgqtests < 0.01) dum <- 'OK' else dum <- 'NOK'
a<-table.element(a,dum)
a<-table.row.end(a)
a<-table.row.start(a)
a<-table.element(a,'5% type I error level',header=TRUE)
a<-table.element(a,numsignificant5)
a<-table.element(a,numsignificant5/numgqtests)
if (numsignificant5/numgqtests < 0.05) dum <- 'OK' else dum <- 'NOK'
a<-table.element(a,dum)
a<-table.row.end(a)
a<-table.row.start(a)
a<-table.element(a,'10% type I error level',header=TRUE)
a<-table.element(a,numsignificant10)
a<-table.element(a,numsignificant10/numgqtests)
if (numsignificant10/numgqtests < 0.1) dum <- 'OK' else dum <- 'NOK'
a<-table.element(a,dum)
a<-table.row.end(a)
a<-table.end(a)
table.save(a,file='mytable6.tab')
}