Free Statistics

of Irreproducible Research!

Author's title

Author*The author of this computation has been verified*
R Software Modulerwasp_autocorrelation.wasp
Title produced by software(Partial) Autocorrelation Function
Date of computationFri, 18 Dec 2009 07:04:10 -0700
Cite this page as followsStatistical Computations at FreeStatistics.org, Office for Research Development and Education, URL https://freestatistics.org/blog/index.php?v=date/2009/Dec/18/t126114510445y1cj4mlh0d0n1.htm/, Retrieved Sat, 27 Apr 2024 10:27:12 +0000
Statistical Computations at FreeStatistics.org, Office for Research Development and Education, URL https://freestatistics.org/blog/index.php?pk=69346, Retrieved Sat, 27 Apr 2024 10:27:12 +0000
QR Codes:

Original text written by user:
IsPrivate?No (this computation is public)
User-defined keywords
Estimated Impact132
Family? (F = Feedback message, R = changed R code, M = changed R Module, P = changed Parameters, D = changed Data)
-     [(Partial) Autocorrelation Function] [autocorrelatie bel20] [2008-12-10 18:48:27] [74be16979710d4c4e7c6647856088456]
-  MPD  [(Partial) Autocorrelation Function] [] [2009-12-15 15:19:26] [2f674a53c3d7aaa1bcf80e66074d3c9b]
-   PD      [(Partial) Autocorrelation Function] [] [2009-12-18 14:04:10] [5858ea01c9bd81debbf921a11363ad90] [Current]
Feedback Forum

Post a new message
Dataseries X:
562
561
555
544
537
543
594
611
613
611
594
595
591
589
584
573
567
569
621
629
628
612
595
597
593
590
580
574
573
573
620
626
620
588
566
557
561
549
532
526
511
499
555
565
542
527
510
514
517
508
493
490
469
478
528
534
518
506
502
516
528
533
536
537
524
536
587
597
581
564
558


Summary of computational transaction
Raw Inputview raw input (R code)
Raw Outputview raw output of R engine
Computing time5 seconds
R Server'Gwilym Jenkins' @ 72.249.127.135

\begin{tabular}{lllllllll}
\hline
Summary of computational transaction \tabularnewline
Raw Input & view raw input (R code)  \tabularnewline
Raw Output & view raw output of R engine  \tabularnewline
Computing time & 5 seconds \tabularnewline
R Server & 'Gwilym Jenkins' @ 72.249.127.135 \tabularnewline
\hline
\end{tabular}
%Source: https://freestatistics.org/blog/index.php?pk=69346&T=0

[TABLE]
[ROW][C]Summary of computational transaction[/C][/ROW]
[ROW][C]Raw Input[/C][C]view raw input (R code) [/C][/ROW]
[ROW][C]Raw Output[/C][C]view raw output of R engine [/C][/ROW]
[ROW][C]Computing time[/C][C]5 seconds[/C][/ROW]
[ROW][C]R Server[/C][C]'Gwilym Jenkins' @ 72.249.127.135[/C][/ROW]
[/TABLE]
Source: https://freestatistics.org/blog/index.php?pk=69346&T=0

Globally Unique Identifier (entire table): ba.freestatistics.org/blog/index.php?pk=69346&T=0

As an alternative you can also use a QR Code:  

The GUIDs for individual cells are displayed in the table below:

Summary of computational transaction
Raw Inputview raw input (R code)
Raw Outputview raw output of R engine
Computing time5 seconds
R Server'Gwilym Jenkins' @ 72.249.127.135


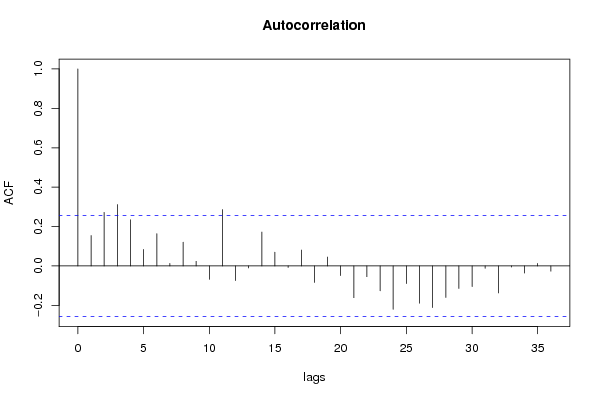
Autocorrelation Function
Time lag kACF(k)T-STATP-value
10.1543011.17510.122374
20.2719912.07140.021389
30.3119512.37570.010419
40.2345461.78620.039643
50.0839350.63920.262594
60.1638761.2480.108515
70.0127280.09690.461556
80.1203690.91670.181547
90.0236140.17980.428953
10-0.067774-0.51610.303856
110.2862512.180.016664
12-0.074042-0.56390.287503
13-0.010284-0.07830.468922
140.172091.31060.09758
150.0700660.53360.297825
16-0.007303-0.05560.477919
170.08080.61540.270363
18-0.083882-0.63880.262725
190.0450170.34280.36648
20-0.049086-0.37380.354948
21-0.16101-1.22620.112536
22-0.054512-0.41510.339782
23-0.126178-0.96090.170285
24-0.220097-1.67620.04954
25-0.089155-0.6790.249924
26-0.189082-1.440.077621
27-0.211203-1.60850.056581
28-0.15972-1.21640.114382
29-0.113887-0.86730.194667
30-0.104432-0.79530.214833
31-0.011893-0.09060.464071
32-0.137173-1.04470.150253
33-0.005577-0.04250.483135
34-0.036259-0.27610.391711
350.0127370.0970.461529
36-0.026448-0.20140.420536

\begin{tabular}{lllllllll}
\hline
Autocorrelation Function \tabularnewline
Time lag k & ACF(k) & T-STAT & P-value \tabularnewline
1 & 0.154301 & 1.1751 & 0.122374 \tabularnewline
2 & 0.271991 & 2.0714 & 0.021389 \tabularnewline
3 & 0.311951 & 2.3757 & 0.010419 \tabularnewline
4 & 0.234546 & 1.7862 & 0.039643 \tabularnewline
5 & 0.083935 & 0.6392 & 0.262594 \tabularnewline
6 & 0.163876 & 1.248 & 0.108515 \tabularnewline
7 & 0.012728 & 0.0969 & 0.461556 \tabularnewline
8 & 0.120369 & 0.9167 & 0.181547 \tabularnewline
9 & 0.023614 & 0.1798 & 0.428953 \tabularnewline
10 & -0.067774 & -0.5161 & 0.303856 \tabularnewline
11 & 0.286251 & 2.18 & 0.016664 \tabularnewline
12 & -0.074042 & -0.5639 & 0.287503 \tabularnewline
13 & -0.010284 & -0.0783 & 0.468922 \tabularnewline
14 & 0.17209 & 1.3106 & 0.09758 \tabularnewline
15 & 0.070066 & 0.5336 & 0.297825 \tabularnewline
16 & -0.007303 & -0.0556 & 0.477919 \tabularnewline
17 & 0.0808 & 0.6154 & 0.270363 \tabularnewline
18 & -0.083882 & -0.6388 & 0.262725 \tabularnewline
19 & 0.045017 & 0.3428 & 0.36648 \tabularnewline
20 & -0.049086 & -0.3738 & 0.354948 \tabularnewline
21 & -0.16101 & -1.2262 & 0.112536 \tabularnewline
22 & -0.054512 & -0.4151 & 0.339782 \tabularnewline
23 & -0.126178 & -0.9609 & 0.170285 \tabularnewline
24 & -0.220097 & -1.6762 & 0.04954 \tabularnewline
25 & -0.089155 & -0.679 & 0.249924 \tabularnewline
26 & -0.189082 & -1.44 & 0.077621 \tabularnewline
27 & -0.211203 & -1.6085 & 0.056581 \tabularnewline
28 & -0.15972 & -1.2164 & 0.114382 \tabularnewline
29 & -0.113887 & -0.8673 & 0.194667 \tabularnewline
30 & -0.104432 & -0.7953 & 0.214833 \tabularnewline
31 & -0.011893 & -0.0906 & 0.464071 \tabularnewline
32 & -0.137173 & -1.0447 & 0.150253 \tabularnewline
33 & -0.005577 & -0.0425 & 0.483135 \tabularnewline
34 & -0.036259 & -0.2761 & 0.391711 \tabularnewline
35 & 0.012737 & 0.097 & 0.461529 \tabularnewline
36 & -0.026448 & -0.2014 & 0.420536 \tabularnewline
\hline
\end{tabular}
%Source: https://freestatistics.org/blog/index.php?pk=69346&T=1

[TABLE]
[ROW][C]Autocorrelation Function[/C][/ROW]
[ROW][C]Time lag k[/C][C]ACF(k)[/C][C]T-STAT[/C][C]P-value[/C][/ROW]
[ROW][C]1[/C][C]0.154301[/C][C]1.1751[/C][C]0.122374[/C][/ROW]
[ROW][C]2[/C][C]0.271991[/C][C]2.0714[/C][C]0.021389[/C][/ROW]
[ROW][C]3[/C][C]0.311951[/C][C]2.3757[/C][C]0.010419[/C][/ROW]
[ROW][C]4[/C][C]0.234546[/C][C]1.7862[/C][C]0.039643[/C][/ROW]
[ROW][C]5[/C][C]0.083935[/C][C]0.6392[/C][C]0.262594[/C][/ROW]
[ROW][C]6[/C][C]0.163876[/C][C]1.248[/C][C]0.108515[/C][/ROW]
[ROW][C]7[/C][C]0.012728[/C][C]0.0969[/C][C]0.461556[/C][/ROW]
[ROW][C]8[/C][C]0.120369[/C][C]0.9167[/C][C]0.181547[/C][/ROW]
[ROW][C]9[/C][C]0.023614[/C][C]0.1798[/C][C]0.428953[/C][/ROW]
[ROW][C]10[/C][C]-0.067774[/C][C]-0.5161[/C][C]0.303856[/C][/ROW]
[ROW][C]11[/C][C]0.286251[/C][C]2.18[/C][C]0.016664[/C][/ROW]
[ROW][C]12[/C][C]-0.074042[/C][C]-0.5639[/C][C]0.287503[/C][/ROW]
[ROW][C]13[/C][C]-0.010284[/C][C]-0.0783[/C][C]0.468922[/C][/ROW]
[ROW][C]14[/C][C]0.17209[/C][C]1.3106[/C][C]0.09758[/C][/ROW]
[ROW][C]15[/C][C]0.070066[/C][C]0.5336[/C][C]0.297825[/C][/ROW]
[ROW][C]16[/C][C]-0.007303[/C][C]-0.0556[/C][C]0.477919[/C][/ROW]
[ROW][C]17[/C][C]0.0808[/C][C]0.6154[/C][C]0.270363[/C][/ROW]
[ROW][C]18[/C][C]-0.083882[/C][C]-0.6388[/C][C]0.262725[/C][/ROW]
[ROW][C]19[/C][C]0.045017[/C][C]0.3428[/C][C]0.36648[/C][/ROW]
[ROW][C]20[/C][C]-0.049086[/C][C]-0.3738[/C][C]0.354948[/C][/ROW]
[ROW][C]21[/C][C]-0.16101[/C][C]-1.2262[/C][C]0.112536[/C][/ROW]
[ROW][C]22[/C][C]-0.054512[/C][C]-0.4151[/C][C]0.339782[/C][/ROW]
[ROW][C]23[/C][C]-0.126178[/C][C]-0.9609[/C][C]0.170285[/C][/ROW]
[ROW][C]24[/C][C]-0.220097[/C][C]-1.6762[/C][C]0.04954[/C][/ROW]
[ROW][C]25[/C][C]-0.089155[/C][C]-0.679[/C][C]0.249924[/C][/ROW]
[ROW][C]26[/C][C]-0.189082[/C][C]-1.44[/C][C]0.077621[/C][/ROW]
[ROW][C]27[/C][C]-0.211203[/C][C]-1.6085[/C][C]0.056581[/C][/ROW]
[ROW][C]28[/C][C]-0.15972[/C][C]-1.2164[/C][C]0.114382[/C][/ROW]
[ROW][C]29[/C][C]-0.113887[/C][C]-0.8673[/C][C]0.194667[/C][/ROW]
[ROW][C]30[/C][C]-0.104432[/C][C]-0.7953[/C][C]0.214833[/C][/ROW]
[ROW][C]31[/C][C]-0.011893[/C][C]-0.0906[/C][C]0.464071[/C][/ROW]
[ROW][C]32[/C][C]-0.137173[/C][C]-1.0447[/C][C]0.150253[/C][/ROW]
[ROW][C]33[/C][C]-0.005577[/C][C]-0.0425[/C][C]0.483135[/C][/ROW]
[ROW][C]34[/C][C]-0.036259[/C][C]-0.2761[/C][C]0.391711[/C][/ROW]
[ROW][C]35[/C][C]0.012737[/C][C]0.097[/C][C]0.461529[/C][/ROW]
[ROW][C]36[/C][C]-0.026448[/C][C]-0.2014[/C][C]0.420536[/C][/ROW]
[/TABLE]
Source: https://freestatistics.org/blog/index.php?pk=69346&T=1

Globally Unique Identifier (entire table): ba.freestatistics.org/blog/index.php?pk=69346&T=1

As an alternative you can also use a QR Code:  

The GUIDs for individual cells are displayed in the table below:

Autocorrelation Function
Time lag kACF(k)T-STATP-value
10.1543011.17510.122374
20.2719912.07140.021389
30.3119512.37570.010419
40.2345461.78620.039643
50.0839350.63920.262594
60.1638761.2480.108515
70.0127280.09690.461556
80.1203690.91670.181547
90.0236140.17980.428953
10-0.067774-0.51610.303856
110.2862512.180.016664
12-0.074042-0.56390.287503
13-0.010284-0.07830.468922
140.172091.31060.09758
150.0700660.53360.297825
16-0.007303-0.05560.477919
170.08080.61540.270363
18-0.083882-0.63880.262725
190.0450170.34280.36648
20-0.049086-0.37380.354948
21-0.16101-1.22620.112536
22-0.054512-0.41510.339782
23-0.126178-0.96090.170285
24-0.220097-1.67620.04954
25-0.089155-0.6790.249924
26-0.189082-1.440.077621
27-0.211203-1.60850.056581
28-0.15972-1.21640.114382
29-0.113887-0.86730.194667
30-0.104432-0.79530.214833
31-0.011893-0.09060.464071
32-0.137173-1.04470.150253
33-0.005577-0.04250.483135
34-0.036259-0.27610.391711
350.0127370.0970.461529
36-0.026448-0.20140.420536


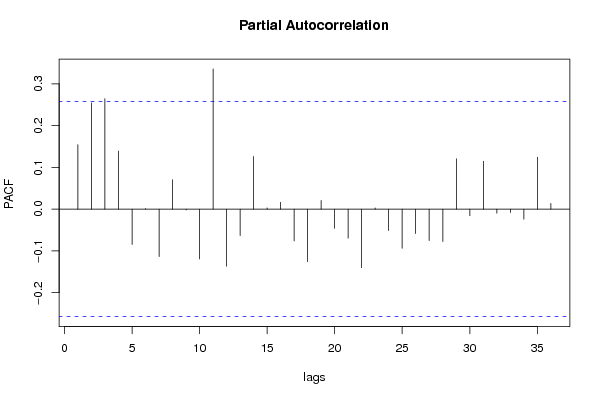
Partial Autocorrelation Function
Time lag kPACF(k)T-STATP-value
10.1543011.17510.122374
20.2542351.93620.028861
30.2644022.01360.024348
40.1388811.05770.147292
5-0.084446-0.64310.261339
60.0014080.01070.49574
7-0.113636-0.86540.195186
80.0703340.53560.297126
9-0.001933-0.01470.494153
10-0.119155-0.90750.183959
110.3355272.55530.006627
12-0.136727-1.04130.151034
13-0.063192-0.48130.316073
140.1260220.95980.170581
150.0030270.02310.490845
160.016290.12410.450849
17-0.076254-0.58070.281834
18-0.125666-0.9570.171258
190.0209630.15960.436857
20-0.046045-0.35070.363553
21-0.069594-0.530.299063
22-0.140118-1.06710.145173
230.0027350.02080.491728
24-0.051392-0.39140.348472
25-0.093864-0.71480.238785
26-0.058501-0.44550.328799
27-0.075284-0.57330.284313
28-0.077298-0.58870.279179
290.1205910.91840.181107
30-0.015744-0.11990.452487
310.1147420.87380.192903
32-0.009565-0.07280.471089
33-0.008222-0.06260.475143
34-0.024142-0.18390.427382
350.1242820.94650.17391
360.0136120.10370.458897

\begin{tabular}{lllllllll}
\hline
Partial Autocorrelation Function \tabularnewline
Time lag k & PACF(k) & T-STAT & P-value \tabularnewline
1 & 0.154301 & 1.1751 & 0.122374 \tabularnewline
2 & 0.254235 & 1.9362 & 0.028861 \tabularnewline
3 & 0.264402 & 2.0136 & 0.024348 \tabularnewline
4 & 0.138881 & 1.0577 & 0.147292 \tabularnewline
5 & -0.084446 & -0.6431 & 0.261339 \tabularnewline
6 & 0.001408 & 0.0107 & 0.49574 \tabularnewline
7 & -0.113636 & -0.8654 & 0.195186 \tabularnewline
8 & 0.070334 & 0.5356 & 0.297126 \tabularnewline
9 & -0.001933 & -0.0147 & 0.494153 \tabularnewline
10 & -0.119155 & -0.9075 & 0.183959 \tabularnewline
11 & 0.335527 & 2.5553 & 0.006627 \tabularnewline
12 & -0.136727 & -1.0413 & 0.151034 \tabularnewline
13 & -0.063192 & -0.4813 & 0.316073 \tabularnewline
14 & 0.126022 & 0.9598 & 0.170581 \tabularnewline
15 & 0.003027 & 0.0231 & 0.490845 \tabularnewline
16 & 0.01629 & 0.1241 & 0.450849 \tabularnewline
17 & -0.076254 & -0.5807 & 0.281834 \tabularnewline
18 & -0.125666 & -0.957 & 0.171258 \tabularnewline
19 & 0.020963 & 0.1596 & 0.436857 \tabularnewline
20 & -0.046045 & -0.3507 & 0.363553 \tabularnewline
21 & -0.069594 & -0.53 & 0.299063 \tabularnewline
22 & -0.140118 & -1.0671 & 0.145173 \tabularnewline
23 & 0.002735 & 0.0208 & 0.491728 \tabularnewline
24 & -0.051392 & -0.3914 & 0.348472 \tabularnewline
25 & -0.093864 & -0.7148 & 0.238785 \tabularnewline
26 & -0.058501 & -0.4455 & 0.328799 \tabularnewline
27 & -0.075284 & -0.5733 & 0.284313 \tabularnewline
28 & -0.077298 & -0.5887 & 0.279179 \tabularnewline
29 & 0.120591 & 0.9184 & 0.181107 \tabularnewline
30 & -0.015744 & -0.1199 & 0.452487 \tabularnewline
31 & 0.114742 & 0.8738 & 0.192903 \tabularnewline
32 & -0.009565 & -0.0728 & 0.471089 \tabularnewline
33 & -0.008222 & -0.0626 & 0.475143 \tabularnewline
34 & -0.024142 & -0.1839 & 0.427382 \tabularnewline
35 & 0.124282 & 0.9465 & 0.17391 \tabularnewline
36 & 0.013612 & 0.1037 & 0.458897 \tabularnewline
\hline
\end{tabular}
%Source: https://freestatistics.org/blog/index.php?pk=69346&T=2

[TABLE]
[ROW][C]Partial Autocorrelation Function[/C][/ROW]
[ROW][C]Time lag k[/C][C]PACF(k)[/C][C]T-STAT[/C][C]P-value[/C][/ROW]
[ROW][C]1[/C][C]0.154301[/C][C]1.1751[/C][C]0.122374[/C][/ROW]
[ROW][C]2[/C][C]0.254235[/C][C]1.9362[/C][C]0.028861[/C][/ROW]
[ROW][C]3[/C][C]0.264402[/C][C]2.0136[/C][C]0.024348[/C][/ROW]
[ROW][C]4[/C][C]0.138881[/C][C]1.0577[/C][C]0.147292[/C][/ROW]
[ROW][C]5[/C][C]-0.084446[/C][C]-0.6431[/C][C]0.261339[/C][/ROW]
[ROW][C]6[/C][C]0.001408[/C][C]0.0107[/C][C]0.49574[/C][/ROW]
[ROW][C]7[/C][C]-0.113636[/C][C]-0.8654[/C][C]0.195186[/C][/ROW]
[ROW][C]8[/C][C]0.070334[/C][C]0.5356[/C][C]0.297126[/C][/ROW]
[ROW][C]9[/C][C]-0.001933[/C][C]-0.0147[/C][C]0.494153[/C][/ROW]
[ROW][C]10[/C][C]-0.119155[/C][C]-0.9075[/C][C]0.183959[/C][/ROW]
[ROW][C]11[/C][C]0.335527[/C][C]2.5553[/C][C]0.006627[/C][/ROW]
[ROW][C]12[/C][C]-0.136727[/C][C]-1.0413[/C][C]0.151034[/C][/ROW]
[ROW][C]13[/C][C]-0.063192[/C][C]-0.4813[/C][C]0.316073[/C][/ROW]
[ROW][C]14[/C][C]0.126022[/C][C]0.9598[/C][C]0.170581[/C][/ROW]
[ROW][C]15[/C][C]0.003027[/C][C]0.0231[/C][C]0.490845[/C][/ROW]
[ROW][C]16[/C][C]0.01629[/C][C]0.1241[/C][C]0.450849[/C][/ROW]
[ROW][C]17[/C][C]-0.076254[/C][C]-0.5807[/C][C]0.281834[/C][/ROW]
[ROW][C]18[/C][C]-0.125666[/C][C]-0.957[/C][C]0.171258[/C][/ROW]
[ROW][C]19[/C][C]0.020963[/C][C]0.1596[/C][C]0.436857[/C][/ROW]
[ROW][C]20[/C][C]-0.046045[/C][C]-0.3507[/C][C]0.363553[/C][/ROW]
[ROW][C]21[/C][C]-0.069594[/C][C]-0.53[/C][C]0.299063[/C][/ROW]
[ROW][C]22[/C][C]-0.140118[/C][C]-1.0671[/C][C]0.145173[/C][/ROW]
[ROW][C]23[/C][C]0.002735[/C][C]0.0208[/C][C]0.491728[/C][/ROW]
[ROW][C]24[/C][C]-0.051392[/C][C]-0.3914[/C][C]0.348472[/C][/ROW]
[ROW][C]25[/C][C]-0.093864[/C][C]-0.7148[/C][C]0.238785[/C][/ROW]
[ROW][C]26[/C][C]-0.058501[/C][C]-0.4455[/C][C]0.328799[/C][/ROW]
[ROW][C]27[/C][C]-0.075284[/C][C]-0.5733[/C][C]0.284313[/C][/ROW]
[ROW][C]28[/C][C]-0.077298[/C][C]-0.5887[/C][C]0.279179[/C][/ROW]
[ROW][C]29[/C][C]0.120591[/C][C]0.9184[/C][C]0.181107[/C][/ROW]
[ROW][C]30[/C][C]-0.015744[/C][C]-0.1199[/C][C]0.452487[/C][/ROW]
[ROW][C]31[/C][C]0.114742[/C][C]0.8738[/C][C]0.192903[/C][/ROW]
[ROW][C]32[/C][C]-0.009565[/C][C]-0.0728[/C][C]0.471089[/C][/ROW]
[ROW][C]33[/C][C]-0.008222[/C][C]-0.0626[/C][C]0.475143[/C][/ROW]
[ROW][C]34[/C][C]-0.024142[/C][C]-0.1839[/C][C]0.427382[/C][/ROW]
[ROW][C]35[/C][C]0.124282[/C][C]0.9465[/C][C]0.17391[/C][/ROW]
[ROW][C]36[/C][C]0.013612[/C][C]0.1037[/C][C]0.458897[/C][/ROW]
[/TABLE]
Source: https://freestatistics.org/blog/index.php?pk=69346&T=2

Globally Unique Identifier (entire table): ba.freestatistics.org/blog/index.php?pk=69346&T=2

As an alternative you can also use a QR Code:  

The GUIDs for individual cells are displayed in the table below:

Partial Autocorrelation Function
Time lag kPACF(k)T-STATP-value
10.1543011.17510.122374
20.2542351.93620.028861
30.2644022.01360.024348
40.1388811.05770.147292
5-0.084446-0.64310.261339
60.0014080.01070.49574
7-0.113636-0.86540.195186
80.0703340.53560.297126
9-0.001933-0.01470.494153
10-0.119155-0.90750.183959
110.3355272.55530.006627
12-0.136727-1.04130.151034
13-0.063192-0.48130.316073
140.1260220.95980.170581
150.0030270.02310.490845
160.016290.12410.450849
17-0.076254-0.58070.281834
18-0.125666-0.9570.171258
190.0209630.15960.436857
20-0.046045-0.35070.363553
21-0.069594-0.530.299063
22-0.140118-1.06710.145173
230.0027350.02080.491728
24-0.051392-0.39140.348472
25-0.093864-0.71480.238785
26-0.058501-0.44550.328799
27-0.075284-0.57330.284313
28-0.077298-0.58870.279179
290.1205910.91840.181107
30-0.015744-0.11990.452487
310.1147420.87380.192903
32-0.009565-0.07280.471089
33-0.008222-0.06260.475143
34-0.024142-0.18390.427382
350.1242820.94650.17391
360.0136120.10370.458897


Parameters (Session):
par1 = 36 ; par2 = 1 ; par3 = 1 ; par4 = 1 ; par5 = 12 ; par6 = MA ;
Parameters (R input):
par1 = 36 ; par2 = 1 ; par3 = 1 ; par4 = 1 ; par5 = 12 ; par6 = MA ; par7 = ;
R code (references can be found in the software module):
if (par1 == 'Default') {
par1 = 10*log10(length(x))
} else {
par1 <- as.numeric(par1)
}
par2 <- as.numeric(par2)
par3 <- as.numeric(par3)
par4 <- as.numeric(par4)
par5 <- as.numeric(par5)
if (par2 == 0) {
x <- log(x)
} else {
x <- (x ^ par2 - 1) / par2
}
if (par3 > 0) x <- diff(x,lag=1,difference=par3)
if (par4 > 0) x <- diff(x,lag=par5,difference=par4)
bitmap(file='pic1.png')
racf <- acf(x,par1,main='Autocorrelation',xlab='lags',ylab='ACF')
dev.off()
bitmap(file='pic2.png')
rpacf <- pacf(x,par1,main='Partial Autocorrelation',xlab='lags',ylab='PACF')
dev.off()
(myacf <- c(racf$acf))
(mypacf <- c(rpacf$acf))
lengthx <- length(x)
sqrtn <- sqrt(lengthx)
load(file='createtable')
a<-table.start()
a<-table.row.start(a)
a<-table.element(a,'Autocorrelation Function',4,TRUE)
a<-table.row.end(a)
a<-table.row.start(a)
a<-table.element(a,'Time lag k',header=TRUE)
a<-table.element(a,hyperlink('basics.htm','ACF(k)','click here for more information about the Autocorrelation Function'),header=TRUE)
a<-table.element(a,'T-STAT',header=TRUE)
a<-table.element(a,'P-value',header=TRUE)
a<-table.row.end(a)
for (i in 2:(par1+1)) {
a<-table.row.start(a)
a<-table.element(a,i-1,header=TRUE)
a<-table.element(a,round(myacf[i],6))
mytstat <- myacf[i]*sqrtn
a<-table.element(a,round(mytstat,4))
a<-table.element(a,round(1-pt(abs(mytstat),lengthx),6))
a<-table.row.end(a)
}
a<-table.end(a)
table.save(a,file='mytable.tab')
a<-table.start()
a<-table.row.start(a)
a<-table.element(a,'Partial Autocorrelation Function',4,TRUE)
a<-table.row.end(a)
a<-table.row.start(a)
a<-table.element(a,'Time lag k',header=TRUE)
a<-table.element(a,hyperlink('basics.htm','PACF(k)','click here for more information about the Partial Autocorrelation Function'),header=TRUE)
a<-table.element(a,'T-STAT',header=TRUE)
a<-table.element(a,'P-value',header=TRUE)
a<-table.row.end(a)
for (i in 1:par1) {
a<-table.row.start(a)
a<-table.element(a,i,header=TRUE)
a<-table.element(a,round(mypacf[i],6))
mytstat <- mypacf[i]*sqrtn
a<-table.element(a,round(mytstat,4))
a<-table.element(a,round(1-pt(abs(mytstat),lengthx),6))
a<-table.row.end(a)
}
a<-table.end(a)
table.save(a,file='mytable1.tab')