Free Statistics

of Irreproducible Research!

Author's title

Author*The author of this computation has been verified*
R Software Modulerwasp_autocorrelation.wasp
Title produced by software(Partial) Autocorrelation Function
Date of computationFri, 18 Dec 2009 07:21:47 -0700
Cite this page as followsStatistical Computations at FreeStatistics.org, Office for Research Development and Education, URL https://freestatistics.org/blog/index.php?v=date/2009/Dec/18/t1261146161iua8qvkfkrtg1ul.htm/, Retrieved Sat, 27 Apr 2024 09:05:29 +0000
Statistical Computations at FreeStatistics.org, Office for Research Development and Education, URL https://freestatistics.org/blog/index.php?pk=69365, Retrieved Sat, 27 Apr 2024 09:05:29 +0000
QR Codes:

Original text written by user:
IsPrivate?No (this computation is public)
User-defined keywords
Estimated Impact144
Family? (F = Feedback message, R = changed R code, M = changed R Module, P = changed Parameters, D = changed Data)
-     [Univariate Data Series] [] [2009-12-17 14:44:14] [09f192433169b2c787c4a71fde86e883]
- RMPD    [(Partial) Autocorrelation Function] [] [2009-12-18 14:21:47] [71596e6a53ccce532e52aaf6113616ef] [Current]
Feedback Forum

Post a new message
Dataseries X:
97.4
97
105.4
102.7
98.1
104.5
87.4
89.9
109.8
111.7
98.6
96.9
95.1
97
112.7
102.9
97.4
111.4
87.4
96.8
114.1
110.3
103.9
101.6
94.6
95.9
104.7
102.8
98.1
113.9
80.9
95.7
113.2
105.9
108.8
102.3
99
100.7
115.5
100.7
109.9
114.6
85.4
100.5
114.8
116.5
112.9
102
106
105.3
118.8
106.1
109.3
117.2
92.5
104.2
112.5
122.4
113.3
100
110.7
112.8
109.8
117.3
109.1
115.9
96
99.8
116.8
115.7
99.4
94.3
91
93.2
103.1
94.1
91.8
102.7
82.6
89.1
104.5


Summary of computational transaction
Raw Inputview raw input (R code)
Raw Outputview raw output of R engine
Computing time1 seconds
R Server'Gwilym Jenkins' @ 72.249.127.135

\begin{tabular}{lllllllll}
\hline
Summary of computational transaction \tabularnewline
Raw Input & view raw input (R code)  \tabularnewline
Raw Output & view raw output of R engine  \tabularnewline
Computing time & 1 seconds \tabularnewline
R Server & 'Gwilym Jenkins' @ 72.249.127.135 \tabularnewline
\hline
\end{tabular}
%Source: https://freestatistics.org/blog/index.php?pk=69365&T=0

[TABLE]
[ROW][C]Summary of computational transaction[/C][/ROW]
[ROW][C]Raw Input[/C][C]view raw input (R code) [/C][/ROW]
[ROW][C]Raw Output[/C][C]view raw output of R engine [/C][/ROW]
[ROW][C]Computing time[/C][C]1 seconds[/C][/ROW]
[ROW][C]R Server[/C][C]'Gwilym Jenkins' @ 72.249.127.135[/C][/ROW]
[/TABLE]
Source: https://freestatistics.org/blog/index.php?pk=69365&T=0

Globally Unique Identifier (entire table): ba.freestatistics.org/blog/index.php?pk=69365&T=0

As an alternative you can also use a QR Code:  

The GUIDs for individual cells are displayed in the table below:

Summary of computational transaction
Raw Inputview raw input (R code)
Raw Outputview raw output of R engine
Computing time1 seconds
R Server'Gwilym Jenkins' @ 72.249.127.135


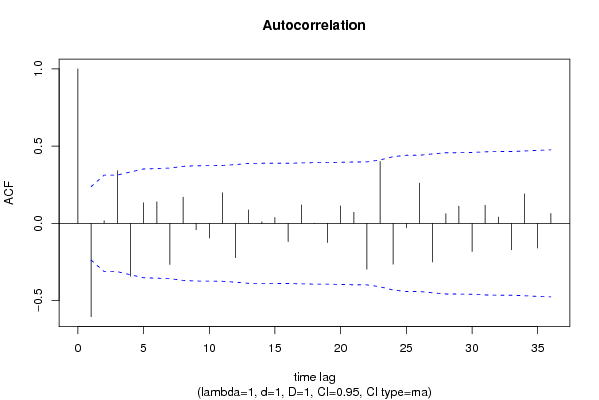
Autocorrelation Function
Time lag kACF(k)T-STATP-value
1-0.604055-4.98122e-06
20.0176210.14530.442451
30.3413492.81480.003189
4-0.34228-2.82250.003122
50.1332571.09890.137851
60.1397251.15220.126636
7-0.265562-2.18990.015984
80.1699081.40110.082866
9-0.041029-0.33830.368076
10-0.094623-0.78030.218967
110.1976651.630.053864
12-0.222061-1.83120.035729
130.0873460.72030.236912
140.0098250.0810.467832
150.0373880.30830.379393
16-0.117806-0.97150.167383
170.1192450.98330.164469
180.0011220.00930.496323
19-0.124287-1.02490.154522
200.1129240.93120.177524
210.0716930.59120.278174
22-0.296804-2.44750.008486
230.4003973.30180.000767
24-0.264292-2.17940.016384
25-0.028403-0.23420.40776
260.2603772.14710.017676
27-0.249444-2.0570.021764
280.0625240.51560.303907
290.1110740.91590.181468
30-0.181723-1.49850.069312
310.1168410.96350.169356
320.0405610.33450.369527
33-0.171584-1.41490.080828
340.1905291.57110.060396
35-0.159977-1.31920.095762
360.0645520.53230.298124

\begin{tabular}{lllllllll}
\hline
Autocorrelation Function \tabularnewline
Time lag k & ACF(k) & T-STAT & P-value \tabularnewline
1 & -0.604055 & -4.9812 & 2e-06 \tabularnewline
2 & 0.017621 & 0.1453 & 0.442451 \tabularnewline
3 & 0.341349 & 2.8148 & 0.003189 \tabularnewline
4 & -0.34228 & -2.8225 & 0.003122 \tabularnewline
5 & 0.133257 & 1.0989 & 0.137851 \tabularnewline
6 & 0.139725 & 1.1522 & 0.126636 \tabularnewline
7 & -0.265562 & -2.1899 & 0.015984 \tabularnewline
8 & 0.169908 & 1.4011 & 0.082866 \tabularnewline
9 & -0.041029 & -0.3383 & 0.368076 \tabularnewline
10 & -0.094623 & -0.7803 & 0.218967 \tabularnewline
11 & 0.197665 & 1.63 & 0.053864 \tabularnewline
12 & -0.222061 & -1.8312 & 0.035729 \tabularnewline
13 & 0.087346 & 0.7203 & 0.236912 \tabularnewline
14 & 0.009825 & 0.081 & 0.467832 \tabularnewline
15 & 0.037388 & 0.3083 & 0.379393 \tabularnewline
16 & -0.117806 & -0.9715 & 0.167383 \tabularnewline
17 & 0.119245 & 0.9833 & 0.164469 \tabularnewline
18 & 0.001122 & 0.0093 & 0.496323 \tabularnewline
19 & -0.124287 & -1.0249 & 0.154522 \tabularnewline
20 & 0.112924 & 0.9312 & 0.177524 \tabularnewline
21 & 0.071693 & 0.5912 & 0.278174 \tabularnewline
22 & -0.296804 & -2.4475 & 0.008486 \tabularnewline
23 & 0.400397 & 3.3018 & 0.000767 \tabularnewline
24 & -0.264292 & -2.1794 & 0.016384 \tabularnewline
25 & -0.028403 & -0.2342 & 0.40776 \tabularnewline
26 & 0.260377 & 2.1471 & 0.017676 \tabularnewline
27 & -0.249444 & -2.057 & 0.021764 \tabularnewline
28 & 0.062524 & 0.5156 & 0.303907 \tabularnewline
29 & 0.111074 & 0.9159 & 0.181468 \tabularnewline
30 & -0.181723 & -1.4985 & 0.069312 \tabularnewline
31 & 0.116841 & 0.9635 & 0.169356 \tabularnewline
32 & 0.040561 & 0.3345 & 0.369527 \tabularnewline
33 & -0.171584 & -1.4149 & 0.080828 \tabularnewline
34 & 0.190529 & 1.5711 & 0.060396 \tabularnewline
35 & -0.159977 & -1.3192 & 0.095762 \tabularnewline
36 & 0.064552 & 0.5323 & 0.298124 \tabularnewline
\hline
\end{tabular}
%Source: https://freestatistics.org/blog/index.php?pk=69365&T=1

[TABLE]
[ROW][C]Autocorrelation Function[/C][/ROW]
[ROW][C]Time lag k[/C][C]ACF(k)[/C][C]T-STAT[/C][C]P-value[/C][/ROW]
[ROW][C]1[/C][C]-0.604055[/C][C]-4.9812[/C][C]2e-06[/C][/ROW]
[ROW][C]2[/C][C]0.017621[/C][C]0.1453[/C][C]0.442451[/C][/ROW]
[ROW][C]3[/C][C]0.341349[/C][C]2.8148[/C][C]0.003189[/C][/ROW]
[ROW][C]4[/C][C]-0.34228[/C][C]-2.8225[/C][C]0.003122[/C][/ROW]
[ROW][C]5[/C][C]0.133257[/C][C]1.0989[/C][C]0.137851[/C][/ROW]
[ROW][C]6[/C][C]0.139725[/C][C]1.1522[/C][C]0.126636[/C][/ROW]
[ROW][C]7[/C][C]-0.265562[/C][C]-2.1899[/C][C]0.015984[/C][/ROW]
[ROW][C]8[/C][C]0.169908[/C][C]1.4011[/C][C]0.082866[/C][/ROW]
[ROW][C]9[/C][C]-0.041029[/C][C]-0.3383[/C][C]0.368076[/C][/ROW]
[ROW][C]10[/C][C]-0.094623[/C][C]-0.7803[/C][C]0.218967[/C][/ROW]
[ROW][C]11[/C][C]0.197665[/C][C]1.63[/C][C]0.053864[/C][/ROW]
[ROW][C]12[/C][C]-0.222061[/C][C]-1.8312[/C][C]0.035729[/C][/ROW]
[ROW][C]13[/C][C]0.087346[/C][C]0.7203[/C][C]0.236912[/C][/ROW]
[ROW][C]14[/C][C]0.009825[/C][C]0.081[/C][C]0.467832[/C][/ROW]
[ROW][C]15[/C][C]0.037388[/C][C]0.3083[/C][C]0.379393[/C][/ROW]
[ROW][C]16[/C][C]-0.117806[/C][C]-0.9715[/C][C]0.167383[/C][/ROW]
[ROW][C]17[/C][C]0.119245[/C][C]0.9833[/C][C]0.164469[/C][/ROW]
[ROW][C]18[/C][C]0.001122[/C][C]0.0093[/C][C]0.496323[/C][/ROW]
[ROW][C]19[/C][C]-0.124287[/C][C]-1.0249[/C][C]0.154522[/C][/ROW]
[ROW][C]20[/C][C]0.112924[/C][C]0.9312[/C][C]0.177524[/C][/ROW]
[ROW][C]21[/C][C]0.071693[/C][C]0.5912[/C][C]0.278174[/C][/ROW]
[ROW][C]22[/C][C]-0.296804[/C][C]-2.4475[/C][C]0.008486[/C][/ROW]
[ROW][C]23[/C][C]0.400397[/C][C]3.3018[/C][C]0.000767[/C][/ROW]
[ROW][C]24[/C][C]-0.264292[/C][C]-2.1794[/C][C]0.016384[/C][/ROW]
[ROW][C]25[/C][C]-0.028403[/C][C]-0.2342[/C][C]0.40776[/C][/ROW]
[ROW][C]26[/C][C]0.260377[/C][C]2.1471[/C][C]0.017676[/C][/ROW]
[ROW][C]27[/C][C]-0.249444[/C][C]-2.057[/C][C]0.021764[/C][/ROW]
[ROW][C]28[/C][C]0.062524[/C][C]0.5156[/C][C]0.303907[/C][/ROW]
[ROW][C]29[/C][C]0.111074[/C][C]0.9159[/C][C]0.181468[/C][/ROW]
[ROW][C]30[/C][C]-0.181723[/C][C]-1.4985[/C][C]0.069312[/C][/ROW]
[ROW][C]31[/C][C]0.116841[/C][C]0.9635[/C][C]0.169356[/C][/ROW]
[ROW][C]32[/C][C]0.040561[/C][C]0.3345[/C][C]0.369527[/C][/ROW]
[ROW][C]33[/C][C]-0.171584[/C][C]-1.4149[/C][C]0.080828[/C][/ROW]
[ROW][C]34[/C][C]0.190529[/C][C]1.5711[/C][C]0.060396[/C][/ROW]
[ROW][C]35[/C][C]-0.159977[/C][C]-1.3192[/C][C]0.095762[/C][/ROW]
[ROW][C]36[/C][C]0.064552[/C][C]0.5323[/C][C]0.298124[/C][/ROW]
[/TABLE]
Source: https://freestatistics.org/blog/index.php?pk=69365&T=1

Globally Unique Identifier (entire table): ba.freestatistics.org/blog/index.php?pk=69365&T=1

As an alternative you can also use a QR Code:  

The GUIDs for individual cells are displayed in the table below:

Autocorrelation Function
Time lag kACF(k)T-STATP-value
1-0.604055-4.98122e-06
20.0176210.14530.442451
30.3413492.81480.003189
4-0.34228-2.82250.003122
50.1332571.09890.137851
60.1397251.15220.126636
7-0.265562-2.18990.015984
80.1699081.40110.082866
9-0.041029-0.33830.368076
10-0.094623-0.78030.218967
110.1976651.630.053864
12-0.222061-1.83120.035729
130.0873460.72030.236912
140.0098250.0810.467832
150.0373880.30830.379393
16-0.117806-0.97150.167383
170.1192450.98330.164469
180.0011220.00930.496323
19-0.124287-1.02490.154522
200.1129240.93120.177524
210.0716930.59120.278174
22-0.296804-2.44750.008486
230.4003973.30180.000767
24-0.264292-2.17940.016384
25-0.028403-0.23420.40776
260.2603772.14710.017676
27-0.249444-2.0570.021764
280.0625240.51560.303907
290.1110740.91590.181468
30-0.181723-1.49850.069312
310.1168410.96350.169356
320.0405610.33450.369527
33-0.171584-1.41490.080828
340.1905291.57110.060396
35-0.159977-1.31920.095762
360.0645520.53230.298124


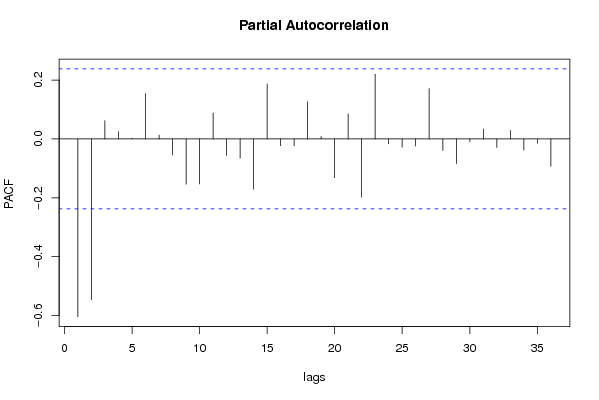
Partial Autocorrelation Function
Time lag kPACF(k)T-STATP-value
1-0.604055-4.98122e-06
2-0.546767-4.50881.3e-05
30.0618440.510.305859
40.0249910.20610.418671
50.0019210.01580.493703
60.1540391.27020.104165
70.0131350.10830.457032
8-0.054326-0.4480.327796
9-0.153997-1.26990.104226
10-0.153264-1.26380.1053
110.0877530.72360.235889
12-0.056174-0.46320.322343
13-0.065117-0.5370.296522
14-0.171043-1.41050.081481
150.1867491.540.064104
16-0.023196-0.19130.424437
17-0.023107-0.19050.424725
180.1265091.04320.150271
190.0084510.06970.472324
20-0.131884-1.08750.140318
210.0846080.69770.243873
22-0.197526-1.62880.053985
230.2199091.81340.037091
24-0.016602-0.13690.445757
25-0.028627-0.23610.407047
26-0.023749-0.19580.422661
270.1709861.410.081551
28-0.039049-0.3220.374216
29-0.083692-0.69010.246227
30-0.00975-0.08040.468077
310.0335330.27650.391493
32-0.028937-0.23860.406059
330.0288710.23810.406269
34-0.037933-0.31280.377693
35-0.01475-0.12160.451774
36-0.093236-0.76880.222323

\begin{tabular}{lllllllll}
\hline
Partial Autocorrelation Function \tabularnewline
Time lag k & PACF(k) & T-STAT & P-value \tabularnewline
1 & -0.604055 & -4.9812 & 2e-06 \tabularnewline
2 & -0.546767 & -4.5088 & 1.3e-05 \tabularnewline
3 & 0.061844 & 0.51 & 0.305859 \tabularnewline
4 & 0.024991 & 0.2061 & 0.418671 \tabularnewline
5 & 0.001921 & 0.0158 & 0.493703 \tabularnewline
6 & 0.154039 & 1.2702 & 0.104165 \tabularnewline
7 & 0.013135 & 0.1083 & 0.457032 \tabularnewline
8 & -0.054326 & -0.448 & 0.327796 \tabularnewline
9 & -0.153997 & -1.2699 & 0.104226 \tabularnewline
10 & -0.153264 & -1.2638 & 0.1053 \tabularnewline
11 & 0.087753 & 0.7236 & 0.235889 \tabularnewline
12 & -0.056174 & -0.4632 & 0.322343 \tabularnewline
13 & -0.065117 & -0.537 & 0.296522 \tabularnewline
14 & -0.171043 & -1.4105 & 0.081481 \tabularnewline
15 & 0.186749 & 1.54 & 0.064104 \tabularnewline
16 & -0.023196 & -0.1913 & 0.424437 \tabularnewline
17 & -0.023107 & -0.1905 & 0.424725 \tabularnewline
18 & 0.126509 & 1.0432 & 0.150271 \tabularnewline
19 & 0.008451 & 0.0697 & 0.472324 \tabularnewline
20 & -0.131884 & -1.0875 & 0.140318 \tabularnewline
21 & 0.084608 & 0.6977 & 0.243873 \tabularnewline
22 & -0.197526 & -1.6288 & 0.053985 \tabularnewline
23 & 0.219909 & 1.8134 & 0.037091 \tabularnewline
24 & -0.016602 & -0.1369 & 0.445757 \tabularnewline
25 & -0.028627 & -0.2361 & 0.407047 \tabularnewline
26 & -0.023749 & -0.1958 & 0.422661 \tabularnewline
27 & 0.170986 & 1.41 & 0.081551 \tabularnewline
28 & -0.039049 & -0.322 & 0.374216 \tabularnewline
29 & -0.083692 & -0.6901 & 0.246227 \tabularnewline
30 & -0.00975 & -0.0804 & 0.468077 \tabularnewline
31 & 0.033533 & 0.2765 & 0.391493 \tabularnewline
32 & -0.028937 & -0.2386 & 0.406059 \tabularnewline
33 & 0.028871 & 0.2381 & 0.406269 \tabularnewline
34 & -0.037933 & -0.3128 & 0.377693 \tabularnewline
35 & -0.01475 & -0.1216 & 0.451774 \tabularnewline
36 & -0.093236 & -0.7688 & 0.222323 \tabularnewline
\hline
\end{tabular}
%Source: https://freestatistics.org/blog/index.php?pk=69365&T=2

[TABLE]
[ROW][C]Partial Autocorrelation Function[/C][/ROW]
[ROW][C]Time lag k[/C][C]PACF(k)[/C][C]T-STAT[/C][C]P-value[/C][/ROW]
[ROW][C]1[/C][C]-0.604055[/C][C]-4.9812[/C][C]2e-06[/C][/ROW]
[ROW][C]2[/C][C]-0.546767[/C][C]-4.5088[/C][C]1.3e-05[/C][/ROW]
[ROW][C]3[/C][C]0.061844[/C][C]0.51[/C][C]0.305859[/C][/ROW]
[ROW][C]4[/C][C]0.024991[/C][C]0.2061[/C][C]0.418671[/C][/ROW]
[ROW][C]5[/C][C]0.001921[/C][C]0.0158[/C][C]0.493703[/C][/ROW]
[ROW][C]6[/C][C]0.154039[/C][C]1.2702[/C][C]0.104165[/C][/ROW]
[ROW][C]7[/C][C]0.013135[/C][C]0.1083[/C][C]0.457032[/C][/ROW]
[ROW][C]8[/C][C]-0.054326[/C][C]-0.448[/C][C]0.327796[/C][/ROW]
[ROW][C]9[/C][C]-0.153997[/C][C]-1.2699[/C][C]0.104226[/C][/ROW]
[ROW][C]10[/C][C]-0.153264[/C][C]-1.2638[/C][C]0.1053[/C][/ROW]
[ROW][C]11[/C][C]0.087753[/C][C]0.7236[/C][C]0.235889[/C][/ROW]
[ROW][C]12[/C][C]-0.056174[/C][C]-0.4632[/C][C]0.322343[/C][/ROW]
[ROW][C]13[/C][C]-0.065117[/C][C]-0.537[/C][C]0.296522[/C][/ROW]
[ROW][C]14[/C][C]-0.171043[/C][C]-1.4105[/C][C]0.081481[/C][/ROW]
[ROW][C]15[/C][C]0.186749[/C][C]1.54[/C][C]0.064104[/C][/ROW]
[ROW][C]16[/C][C]-0.023196[/C][C]-0.1913[/C][C]0.424437[/C][/ROW]
[ROW][C]17[/C][C]-0.023107[/C][C]-0.1905[/C][C]0.424725[/C][/ROW]
[ROW][C]18[/C][C]0.126509[/C][C]1.0432[/C][C]0.150271[/C][/ROW]
[ROW][C]19[/C][C]0.008451[/C][C]0.0697[/C][C]0.472324[/C][/ROW]
[ROW][C]20[/C][C]-0.131884[/C][C]-1.0875[/C][C]0.140318[/C][/ROW]
[ROW][C]21[/C][C]0.084608[/C][C]0.6977[/C][C]0.243873[/C][/ROW]
[ROW][C]22[/C][C]-0.197526[/C][C]-1.6288[/C][C]0.053985[/C][/ROW]
[ROW][C]23[/C][C]0.219909[/C][C]1.8134[/C][C]0.037091[/C][/ROW]
[ROW][C]24[/C][C]-0.016602[/C][C]-0.1369[/C][C]0.445757[/C][/ROW]
[ROW][C]25[/C][C]-0.028627[/C][C]-0.2361[/C][C]0.407047[/C][/ROW]
[ROW][C]26[/C][C]-0.023749[/C][C]-0.1958[/C][C]0.422661[/C][/ROW]
[ROW][C]27[/C][C]0.170986[/C][C]1.41[/C][C]0.081551[/C][/ROW]
[ROW][C]28[/C][C]-0.039049[/C][C]-0.322[/C][C]0.374216[/C][/ROW]
[ROW][C]29[/C][C]-0.083692[/C][C]-0.6901[/C][C]0.246227[/C][/ROW]
[ROW][C]30[/C][C]-0.00975[/C][C]-0.0804[/C][C]0.468077[/C][/ROW]
[ROW][C]31[/C][C]0.033533[/C][C]0.2765[/C][C]0.391493[/C][/ROW]
[ROW][C]32[/C][C]-0.028937[/C][C]-0.2386[/C][C]0.406059[/C][/ROW]
[ROW][C]33[/C][C]0.028871[/C][C]0.2381[/C][C]0.406269[/C][/ROW]
[ROW][C]34[/C][C]-0.037933[/C][C]-0.3128[/C][C]0.377693[/C][/ROW]
[ROW][C]35[/C][C]-0.01475[/C][C]-0.1216[/C][C]0.451774[/C][/ROW]
[ROW][C]36[/C][C]-0.093236[/C][C]-0.7688[/C][C]0.222323[/C][/ROW]
[/TABLE]
Source: https://freestatistics.org/blog/index.php?pk=69365&T=2

Globally Unique Identifier (entire table): ba.freestatistics.org/blog/index.php?pk=69365&T=2

As an alternative you can also use a QR Code:  

The GUIDs for individual cells are displayed in the table below:

Partial Autocorrelation Function
Time lag kPACF(k)T-STATP-value
1-0.604055-4.98122e-06
2-0.546767-4.50881.3e-05
30.0618440.510.305859
40.0249910.20610.418671
50.0019210.01580.493703
60.1540391.27020.104165
70.0131350.10830.457032
8-0.054326-0.4480.327796
9-0.153997-1.26990.104226
10-0.153264-1.26380.1053
110.0877530.72360.235889
12-0.056174-0.46320.322343
13-0.065117-0.5370.296522
14-0.171043-1.41050.081481
150.1867491.540.064104
16-0.023196-0.19130.424437
17-0.023107-0.19050.424725
180.1265091.04320.150271
190.0084510.06970.472324
20-0.131884-1.08750.140318
210.0846080.69770.243873
22-0.197526-1.62880.053985
230.2199091.81340.037091
24-0.016602-0.13690.445757
25-0.028627-0.23610.407047
26-0.023749-0.19580.422661
270.1709861.410.081551
28-0.039049-0.3220.374216
29-0.083692-0.69010.246227
30-0.00975-0.08040.468077
310.0335330.27650.391493
32-0.028937-0.23860.406059
330.0288710.23810.406269
34-0.037933-0.31280.377693
35-0.01475-0.12160.451774
36-0.093236-0.76880.222323


Parameters (Session):
par1 = 36 ; par2 = 1 ; par3 = 1 ; par4 = 1 ; par5 = 12 ; par6 = MA ; par7 = 0.95 ;
Parameters (R input):
par1 = 36 ; par2 = 1 ; par3 = 1 ; par4 = 1 ; par5 = 12 ; par6 = MA ; par7 = 0.95 ;
R code (references can be found in the software module):
if (par1 == 'Default') {
par1 = 10*log10(length(x))
} else {
par1 <- as.numeric(par1)
}
par2 <- as.numeric(par2)
par3 <- as.numeric(par3)
par4 <- as.numeric(par4)
par5 <- as.numeric(par5)
if (par6 == 'White Noise') par6 <- 'white' else par6 <- 'ma'
par7 <- as.numeric(par7)
if (par2 == 0) {
x <- log(x)
} else {
x <- (x ^ par2 - 1) / par2
}
if (par3 > 0) x <- diff(x,lag=1,difference=par3)
if (par4 > 0) x <- diff(x,lag=par5,difference=par4)
bitmap(file='pic1.png')
racf <- acf(x, par1, main='Autocorrelation', xlab='time lag', ylab='ACF', ci.type=par6, ci=par7, sub=paste('(lambda=',par2,', d=',par3,', D=',par4,', CI=', par7, ', CI type=',par6,')',sep=''))
dev.off()
bitmap(file='pic2.png')
rpacf <- pacf(x,par1,main='Partial Autocorrelation',xlab='lags',ylab='PACF')
dev.off()
(myacf <- c(racf$acf))
(mypacf <- c(rpacf$acf))
lengthx <- length(x)
sqrtn <- sqrt(lengthx)
load(file='createtable')
a<-table.start()
a<-table.row.start(a)
a<-table.element(a,'Autocorrelation Function',4,TRUE)
a<-table.row.end(a)
a<-table.row.start(a)
a<-table.element(a,'Time lag k',header=TRUE)
a<-table.element(a,hyperlink('basics.htm','ACF(k)','click here for more information about the Autocorrelation Function'),header=TRUE)
a<-table.element(a,'T-STAT',header=TRUE)
a<-table.element(a,'P-value',header=TRUE)
a<-table.row.end(a)
for (i in 2:(par1+1)) {
a<-table.row.start(a)
a<-table.element(a,i-1,header=TRUE)
a<-table.element(a,round(myacf[i],6))
mytstat <- myacf[i]*sqrtn
a<-table.element(a,round(mytstat,4))
a<-table.element(a,round(1-pt(abs(mytstat),lengthx),6))
a<-table.row.end(a)
}
a<-table.end(a)
table.save(a,file='mytable.tab')
a<-table.start()
a<-table.row.start(a)
a<-table.element(a,'Partial Autocorrelation Function',4,TRUE)
a<-table.row.end(a)
a<-table.row.start(a)
a<-table.element(a,'Time lag k',header=TRUE)
a<-table.element(a,hyperlink('basics.htm','PACF(k)','click here for more information about the Partial Autocorrelation Function'),header=TRUE)
a<-table.element(a,'T-STAT',header=TRUE)
a<-table.element(a,'P-value',header=TRUE)
a<-table.row.end(a)
for (i in 1:par1) {
a<-table.row.start(a)
a<-table.element(a,i,header=TRUE)
a<-table.element(a,round(mypacf[i],6))
mytstat <- mypacf[i]*sqrtn
a<-table.element(a,round(mytstat,4))
a<-table.element(a,round(1-pt(abs(mytstat),lengthx),6))
a<-table.row.end(a)
}
a<-table.end(a)
table.save(a,file='mytable1.tab')