Free Statistics

of Irreproducible Research!

Author's title

Author*The author of this computation has been verified*
R Software Modulerwasp_arimaforecasting.wasp
Title produced by softwareARIMA Forecasting
Date of computationFri, 18 Dec 2009 07:30:33 -0700
Cite this page as followsStatistical Computations at FreeStatistics.org, Office for Research Development and Education, URL https://freestatistics.org/blog/index.php?v=date/2009/Dec/18/t1261146742k3io0nia5tmlts5.htm/, Retrieved Sat, 27 Apr 2024 12:12:00 +0000
Statistical Computations at FreeStatistics.org, Office for Research Development and Education, URL https://freestatistics.org/blog/index.php?pk=69375, Retrieved Sat, 27 Apr 2024 12:12:00 +0000
QR Codes:

Original text written by user:
IsPrivate?No (this computation is public)
User-defined keywords
Estimated Impact143
Family? (F = Feedback message, R = changed R code, M = changed R Module, P = changed Parameters, D = changed Data)
-     [Univariate Data Series] [] [2009-12-17 14:44:14] [09f192433169b2c787c4a71fde86e883]
- RMPD    [ARIMA Forecasting] [] [2009-12-18 14:30:33] [71596e6a53ccce532e52aaf6113616ef] [Current]
Feedback Forum

Post a new message
Dataseries X:
97.4
97
105.4
102.7
98.1
104.5
87.4
89.9
109.8
111.7
98.6
96.9
95.1
97
112.7
102.9
97.4
111.4
87.4
96.8
114.1
110.3
103.9
101.6
94.6
95.9
104.7
102.8
98.1
113.9
80.9
95.7
113.2
105.9
108.8
102.3
99
100.7
115.5
100.7
109.9
114.6
85.4
100.5
114.8
116.5
112.9
102
106
105.3
118.8
106.1
109.3
117.2
92.5
104.2
112.5
122.4
113.3
100
110.7
112.8
109.8
117.3
109.1
115.9
96
99.8
116.8
115.7
99.4
94.3
91
93.2
103.1
94.1
91.8
102.7
82.6
89.1
104.5


Summary of computational transaction
Raw Inputview raw input (R code)
Raw Outputview raw output of R engine
Computing time2 seconds
R Server'Gwilym Jenkins' @ 72.249.127.135

\begin{tabular}{lllllllll}
\hline
Summary of computational transaction \tabularnewline
Raw Input & view raw input (R code)  \tabularnewline
Raw Output & view raw output of R engine  \tabularnewline
Computing time & 2 seconds \tabularnewline
R Server & 'Gwilym Jenkins' @ 72.249.127.135 \tabularnewline
\hline
\end{tabular}
%Source: https://freestatistics.org/blog/index.php?pk=69375&T=0

[TABLE]
[ROW][C]Summary of computational transaction[/C][/ROW]
[ROW][C]Raw Input[/C][C]view raw input (R code) [/C][/ROW]
[ROW][C]Raw Output[/C][C]view raw output of R engine [/C][/ROW]
[ROW][C]Computing time[/C][C]2 seconds[/C][/ROW]
[ROW][C]R Server[/C][C]'Gwilym Jenkins' @ 72.249.127.135[/C][/ROW]
[/TABLE]
Source: https://freestatistics.org/blog/index.php?pk=69375&T=0

Globally Unique Identifier (entire table): ba.freestatistics.org/blog/index.php?pk=69375&T=0

As an alternative you can also use a QR Code:  

The GUIDs for individual cells are displayed in the table below:

Summary of computational transaction
Raw Inputview raw input (R code)
Raw Outputview raw output of R engine
Computing time2 seconds
R Server'Gwilym Jenkins' @ 72.249.127.135


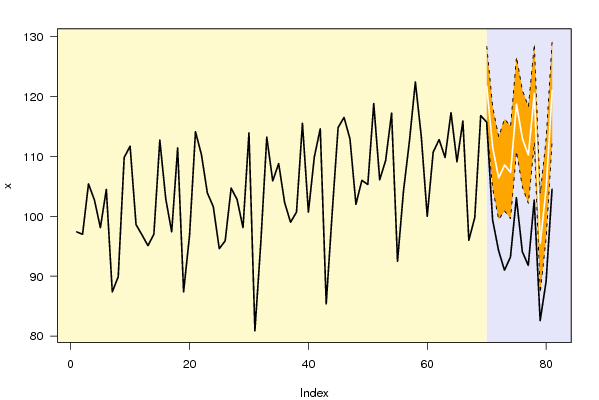
Univariate ARIMA Extrapolation Forecast
timeY[t]F[t]95% LB95% UBp-value(H0: Y[t] = F[t])P(F[t]>Y[t-1])P(F[t]>Y[t-s])P(F[t]>Y[69])
57112.5-------
58122.4-------
59113.3-------
60100-------
61110.7-------
62112.8-------
63109.8-------
64117.3-------
65109.1-------
66115.9-------
6796-------
6899.8-------
69116.8-------
70115.7121.6435114.954128.3330.04080.92210.41230.9221
7199.4111.4002104.6014118.19913e-040.10760.2920.0598
7294.3106.381799.4714113.29213e-040.97620.96490.0016
7391108.5615100.888116.23500.99990.29250.0177
7493.2107.321699.6109115.03242e-0410.08190.008
75103.1118.6898110.8112126.56841e-0410.98650.6809
7694.1112.9234104.8518120.99500.99150.14390.1733
7791.8110.2245102.1533118.2958010.60760.0552
78102.7120.4849112.2726128.6972010.86310.8104
7982.695.527787.2483103.80720.00110.04480.45550
8089.1104.821996.5346113.10931e-0410.88250.0023
81104.5120.9564112.5741129.33871e-0410.83440.8344

\begin{tabular}{lllllllll}
\hline
Univariate ARIMA Extrapolation Forecast \tabularnewline
time & Y[t] & F[t] & 95% LB & 95% UB & p-value(H0: Y[t] = F[t]) & P(F[t]>Y[t-1]) & P(F[t]>Y[t-s]) & P(F[t]>Y[69]) \tabularnewline
57 & 112.5 & - & - & - & - & - & - & - \tabularnewline
58 & 122.4 & - & - & - & - & - & - & - \tabularnewline
59 & 113.3 & - & - & - & - & - & - & - \tabularnewline
60 & 100 & - & - & - & - & - & - & - \tabularnewline
61 & 110.7 & - & - & - & - & - & - & - \tabularnewline
62 & 112.8 & - & - & - & - & - & - & - \tabularnewline
63 & 109.8 & - & - & - & - & - & - & - \tabularnewline
64 & 117.3 & - & - & - & - & - & - & - \tabularnewline
65 & 109.1 & - & - & - & - & - & - & - \tabularnewline
66 & 115.9 & - & - & - & - & - & - & - \tabularnewline
67 & 96 & - & - & - & - & - & - & - \tabularnewline
68 & 99.8 & - & - & - & - & - & - & - \tabularnewline
69 & 116.8 & - & - & - & - & - & - & - \tabularnewline
70 & 115.7 & 121.6435 & 114.954 & 128.333 & 0.0408 & 0.9221 & 0.4123 & 0.9221 \tabularnewline
71 & 99.4 & 111.4002 & 104.6014 & 118.1991 & 3e-04 & 0.1076 & 0.292 & 0.0598 \tabularnewline
72 & 94.3 & 106.3817 & 99.4714 & 113.2921 & 3e-04 & 0.9762 & 0.9649 & 0.0016 \tabularnewline
73 & 91 & 108.5615 & 100.888 & 116.235 & 0 & 0.9999 & 0.2925 & 0.0177 \tabularnewline
74 & 93.2 & 107.3216 & 99.6109 & 115.0324 & 2e-04 & 1 & 0.0819 & 0.008 \tabularnewline
75 & 103.1 & 118.6898 & 110.8112 & 126.5684 & 1e-04 & 1 & 0.9865 & 0.6809 \tabularnewline
76 & 94.1 & 112.9234 & 104.8518 & 120.995 & 0 & 0.9915 & 0.1439 & 0.1733 \tabularnewline
77 & 91.8 & 110.2245 & 102.1533 & 118.2958 & 0 & 1 & 0.6076 & 0.0552 \tabularnewline
78 & 102.7 & 120.4849 & 112.2726 & 128.6972 & 0 & 1 & 0.8631 & 0.8104 \tabularnewline
79 & 82.6 & 95.5277 & 87.2483 & 103.8072 & 0.0011 & 0.0448 & 0.4555 & 0 \tabularnewline
80 & 89.1 & 104.8219 & 96.5346 & 113.1093 & 1e-04 & 1 & 0.8825 & 0.0023 \tabularnewline
81 & 104.5 & 120.9564 & 112.5741 & 129.3387 & 1e-04 & 1 & 0.8344 & 0.8344 \tabularnewline
\hline
\end{tabular}
%Source: https://freestatistics.org/blog/index.php?pk=69375&T=1

[TABLE]
[ROW][C]Univariate ARIMA Extrapolation Forecast[/C][/ROW]
[ROW][C]time[/C][C]Y[t][/C][C]F[t][/C][C]95% LB[/C][C]95% UB[/C][C]p-value(H0: Y[t] = F[t])[/C][C]P(F[t]>Y[t-1])[/C][C]P(F[t]>Y[t-s])[/C][C]P(F[t]>Y[69])[/C][/ROW]
[ROW][C]57[/C][C]112.5[/C][C]-[/C][C]-[/C][C]-[/C][C]-[/C][C]-[/C][C]-[/C][C]-[/C][/ROW]
[ROW][C]58[/C][C]122.4[/C][C]-[/C][C]-[/C][C]-[/C][C]-[/C][C]-[/C][C]-[/C][C]-[/C][/ROW]
[ROW][C]59[/C][C]113.3[/C][C]-[/C][C]-[/C][C]-[/C][C]-[/C][C]-[/C][C]-[/C][C]-[/C][/ROW]
[ROW][C]60[/C][C]100[/C][C]-[/C][C]-[/C][C]-[/C][C]-[/C][C]-[/C][C]-[/C][C]-[/C][/ROW]
[ROW][C]61[/C][C]110.7[/C][C]-[/C][C]-[/C][C]-[/C][C]-[/C][C]-[/C][C]-[/C][C]-[/C][/ROW]
[ROW][C]62[/C][C]112.8[/C][C]-[/C][C]-[/C][C]-[/C][C]-[/C][C]-[/C][C]-[/C][C]-[/C][/ROW]
[ROW][C]63[/C][C]109.8[/C][C]-[/C][C]-[/C][C]-[/C][C]-[/C][C]-[/C][C]-[/C][C]-[/C][/ROW]
[ROW][C]64[/C][C]117.3[/C][C]-[/C][C]-[/C][C]-[/C][C]-[/C][C]-[/C][C]-[/C][C]-[/C][/ROW]
[ROW][C]65[/C][C]109.1[/C][C]-[/C][C]-[/C][C]-[/C][C]-[/C][C]-[/C][C]-[/C][C]-[/C][/ROW]
[ROW][C]66[/C][C]115.9[/C][C]-[/C][C]-[/C][C]-[/C][C]-[/C][C]-[/C][C]-[/C][C]-[/C][/ROW]
[ROW][C]67[/C][C]96[/C][C]-[/C][C]-[/C][C]-[/C][C]-[/C][C]-[/C][C]-[/C][C]-[/C][/ROW]
[ROW][C]68[/C][C]99.8[/C][C]-[/C][C]-[/C][C]-[/C][C]-[/C][C]-[/C][C]-[/C][C]-[/C][/ROW]
[ROW][C]69[/C][C]116.8[/C][C]-[/C][C]-[/C][C]-[/C][C]-[/C][C]-[/C][C]-[/C][C]-[/C][/ROW]
[ROW][C]70[/C][C]115.7[/C][C]121.6435[/C][C]114.954[/C][C]128.333[/C][C]0.0408[/C][C]0.9221[/C][C]0.4123[/C][C]0.9221[/C][/ROW]
[ROW][C]71[/C][C]99.4[/C][C]111.4002[/C][C]104.6014[/C][C]118.1991[/C][C]3e-04[/C][C]0.1076[/C][C]0.292[/C][C]0.0598[/C][/ROW]
[ROW][C]72[/C][C]94.3[/C][C]106.3817[/C][C]99.4714[/C][C]113.2921[/C][C]3e-04[/C][C]0.9762[/C][C]0.9649[/C][C]0.0016[/C][/ROW]
[ROW][C]73[/C][C]91[/C][C]108.5615[/C][C]100.888[/C][C]116.235[/C][C]0[/C][C]0.9999[/C][C]0.2925[/C][C]0.0177[/C][/ROW]
[ROW][C]74[/C][C]93.2[/C][C]107.3216[/C][C]99.6109[/C][C]115.0324[/C][C]2e-04[/C][C]1[/C][C]0.0819[/C][C]0.008[/C][/ROW]
[ROW][C]75[/C][C]103.1[/C][C]118.6898[/C][C]110.8112[/C][C]126.5684[/C][C]1e-04[/C][C]1[/C][C]0.9865[/C][C]0.6809[/C][/ROW]
[ROW][C]76[/C][C]94.1[/C][C]112.9234[/C][C]104.8518[/C][C]120.995[/C][C]0[/C][C]0.9915[/C][C]0.1439[/C][C]0.1733[/C][/ROW]
[ROW][C]77[/C][C]91.8[/C][C]110.2245[/C][C]102.1533[/C][C]118.2958[/C][C]0[/C][C]1[/C][C]0.6076[/C][C]0.0552[/C][/ROW]
[ROW][C]78[/C][C]102.7[/C][C]120.4849[/C][C]112.2726[/C][C]128.6972[/C][C]0[/C][C]1[/C][C]0.8631[/C][C]0.8104[/C][/ROW]
[ROW][C]79[/C][C]82.6[/C][C]95.5277[/C][C]87.2483[/C][C]103.8072[/C][C]0.0011[/C][C]0.0448[/C][C]0.4555[/C][C]0[/C][/ROW]
[ROW][C]80[/C][C]89.1[/C][C]104.8219[/C][C]96.5346[/C][C]113.1093[/C][C]1e-04[/C][C]1[/C][C]0.8825[/C][C]0.0023[/C][/ROW]
[ROW][C]81[/C][C]104.5[/C][C]120.9564[/C][C]112.5741[/C][C]129.3387[/C][C]1e-04[/C][C]1[/C][C]0.8344[/C][C]0.8344[/C][/ROW]
[/TABLE]
Source: https://freestatistics.org/blog/index.php?pk=69375&T=1

Globally Unique Identifier (entire table): ba.freestatistics.org/blog/index.php?pk=69375&T=1

As an alternative you can also use a QR Code:  

The GUIDs for individual cells are displayed in the table below:

Univariate ARIMA Extrapolation Forecast
timeY[t]F[t]95% LB95% UBp-value(H0: Y[t] = F[t])P(F[t]>Y[t-1])P(F[t]>Y[t-s])P(F[t]>Y[69])
57112.5-------
58122.4-------
59113.3-------
60100-------
61110.7-------
62112.8-------
63109.8-------
64117.3-------
65109.1-------
66115.9-------
6796-------
6899.8-------
69116.8-------
70115.7121.6435114.954128.3330.04080.92210.41230.9221
7199.4111.4002104.6014118.19913e-040.10760.2920.0598
7294.3106.381799.4714113.29213e-040.97620.96490.0016
7391108.5615100.888116.23500.99990.29250.0177
7493.2107.321699.6109115.03242e-0410.08190.008
75103.1118.6898110.8112126.56841e-0410.98650.6809
7694.1112.9234104.8518120.99500.99150.14390.1733
7791.8110.2245102.1533118.2958010.60760.0552
78102.7120.4849112.2726128.6972010.86310.8104
7982.695.527787.2483103.80720.00110.04480.45550
8089.1104.821996.5346113.10931e-0410.88250.0023
81104.5120.9564112.5741129.33871e-0410.83440.8344


Univariate ARIMA Extrapolation Forecast Performance
time% S.E.PEMAPESq.EMSERMSE
700.0281-0.0489035.325300
710.0311-0.10770.0783144.005589.66549.4692
720.0331-0.11360.0901145.9683108.43310.4131
730.0361-0.16180.108308.4071158.426512.5868
740.0367-0.13160.1127199.4204166.625312.9083
750.0339-0.13130.1158243.0404179.361213.3926
760.0365-0.16670.1231354.3195204.355214.2953
770.0374-0.16720.1286339.4635221.243714.8743
780.0348-0.14760.1307316.3024231.805815.2252
790.0442-0.13530.1312167.1266225.337915.0113
800.0403-0.150.1329247.1789227.323415.0772
810.0354-0.13610.1331270.8131230.947615.197

\begin{tabular}{lllllllll}
\hline
Univariate ARIMA Extrapolation Forecast Performance \tabularnewline
time & % S.E. & PE & MAPE & Sq.E & MSE & RMSE \tabularnewline
70 & 0.0281 & -0.0489 & 0 & 35.3253 & 0 & 0 \tabularnewline
71 & 0.0311 & -0.1077 & 0.0783 & 144.0055 & 89.6654 & 9.4692 \tabularnewline
72 & 0.0331 & -0.1136 & 0.0901 & 145.9683 & 108.433 & 10.4131 \tabularnewline
73 & 0.0361 & -0.1618 & 0.108 & 308.4071 & 158.4265 & 12.5868 \tabularnewline
74 & 0.0367 & -0.1316 & 0.1127 & 199.4204 & 166.6253 & 12.9083 \tabularnewline
75 & 0.0339 & -0.1313 & 0.1158 & 243.0404 & 179.3612 & 13.3926 \tabularnewline
76 & 0.0365 & -0.1667 & 0.1231 & 354.3195 & 204.3552 & 14.2953 \tabularnewline
77 & 0.0374 & -0.1672 & 0.1286 & 339.4635 & 221.2437 & 14.8743 \tabularnewline
78 & 0.0348 & -0.1476 & 0.1307 & 316.3024 & 231.8058 & 15.2252 \tabularnewline
79 & 0.0442 & -0.1353 & 0.1312 & 167.1266 & 225.3379 & 15.0113 \tabularnewline
80 & 0.0403 & -0.15 & 0.1329 & 247.1789 & 227.3234 & 15.0772 \tabularnewline
81 & 0.0354 & -0.1361 & 0.1331 & 270.8131 & 230.9476 & 15.197 \tabularnewline
\hline
\end{tabular}
%Source: https://freestatistics.org/blog/index.php?pk=69375&T=2

[TABLE]
[ROW][C]Univariate ARIMA Extrapolation Forecast Performance[/C][/ROW]
[ROW][C]time[/C][C]% S.E.[/C][C]PE[/C][C]MAPE[/C][C]Sq.E[/C][C]MSE[/C][C]RMSE[/C][/ROW]
[ROW][C]70[/C][C]0.0281[/C][C]-0.0489[/C][C]0[/C][C]35.3253[/C][C]0[/C][C]0[/C][/ROW]
[ROW][C]71[/C][C]0.0311[/C][C]-0.1077[/C][C]0.0783[/C][C]144.0055[/C][C]89.6654[/C][C]9.4692[/C][/ROW]
[ROW][C]72[/C][C]0.0331[/C][C]-0.1136[/C][C]0.0901[/C][C]145.9683[/C][C]108.433[/C][C]10.4131[/C][/ROW]
[ROW][C]73[/C][C]0.0361[/C][C]-0.1618[/C][C]0.108[/C][C]308.4071[/C][C]158.4265[/C][C]12.5868[/C][/ROW]
[ROW][C]74[/C][C]0.0367[/C][C]-0.1316[/C][C]0.1127[/C][C]199.4204[/C][C]166.6253[/C][C]12.9083[/C][/ROW]
[ROW][C]75[/C][C]0.0339[/C][C]-0.1313[/C][C]0.1158[/C][C]243.0404[/C][C]179.3612[/C][C]13.3926[/C][/ROW]
[ROW][C]76[/C][C]0.0365[/C][C]-0.1667[/C][C]0.1231[/C][C]354.3195[/C][C]204.3552[/C][C]14.2953[/C][/ROW]
[ROW][C]77[/C][C]0.0374[/C][C]-0.1672[/C][C]0.1286[/C][C]339.4635[/C][C]221.2437[/C][C]14.8743[/C][/ROW]
[ROW][C]78[/C][C]0.0348[/C][C]-0.1476[/C][C]0.1307[/C][C]316.3024[/C][C]231.8058[/C][C]15.2252[/C][/ROW]
[ROW][C]79[/C][C]0.0442[/C][C]-0.1353[/C][C]0.1312[/C][C]167.1266[/C][C]225.3379[/C][C]15.0113[/C][/ROW]
[ROW][C]80[/C][C]0.0403[/C][C]-0.15[/C][C]0.1329[/C][C]247.1789[/C][C]227.3234[/C][C]15.0772[/C][/ROW]
[ROW][C]81[/C][C]0.0354[/C][C]-0.1361[/C][C]0.1331[/C][C]270.8131[/C][C]230.9476[/C][C]15.197[/C][/ROW]
[/TABLE]
Source: https://freestatistics.org/blog/index.php?pk=69375&T=2

Globally Unique Identifier (entire table): ba.freestatistics.org/blog/index.php?pk=69375&T=2

As an alternative you can also use a QR Code:  

The GUIDs for individual cells are displayed in the table below:

Univariate ARIMA Extrapolation Forecast Performance
time% S.E.PEMAPESq.EMSERMSE
700.0281-0.0489035.325300
710.0311-0.10770.0783144.005589.66549.4692
720.0331-0.11360.0901145.9683108.43310.4131
730.0361-0.16180.108308.4071158.426512.5868
740.0367-0.13160.1127199.4204166.625312.9083
750.0339-0.13130.1158243.0404179.361213.3926
760.0365-0.16670.1231354.3195204.355214.2953
770.0374-0.16720.1286339.4635221.243714.8743
780.0348-0.14760.1307316.3024231.805815.2252
790.0442-0.13530.1312167.1266225.337915.0113
800.0403-0.150.1329247.1789227.323415.0772
810.0354-0.13610.1331270.8131230.947615.197


Parameters (Session):
par1 = 12 ; par2 = 1 ; par3 = 1 ; par4 = 1 ; par5 = 12 ; par6 = 3 ; par7 = 1 ; par8 = 0 ; par9 = 1 ; par10 = FALSE ;
Parameters (R input):
par1 = 12 ; par2 = 1 ; par3 = 1 ; par4 = 1 ; par5 = 12 ; par6 = 3 ; par7 = 1 ; par8 = 0 ; par9 = 1 ; par10 = FALSE ;
R code (references can be found in the software module):
par1 <- as.numeric(par1) #cut off periods
par2 <- as.numeric(par2) #lambda
par3 <- as.numeric(par3) #degree of non-seasonal differencing
par4 <- as.numeric(par4) #degree of seasonal differencing
par5 <- as.numeric(par5) #seasonal period
par6 <- as.numeric(par6) #p
par7 <- as.numeric(par7) #q
par8 <- as.numeric(par8) #P
par9 <- as.numeric(par9) #Q
if (par10 == 'TRUE') par10 <- TRUE
if (par10 == 'FALSE') par10 <- FALSE
if (par2 == 0) x <- log(x)
if (par2 != 0) x <- x^par2
lx <- length(x)
first <- lx - 2*par1
nx <- lx - par1
nx1 <- nx + 1
fx <- lx - nx
if (fx < 1) {
fx <- par5
nx1 <- lx + fx - 1
first <- lx - 2*fx
}
first <- 1
if (fx < 3) fx <- round(lx/10,0)
(arima.out <- arima(x[1:nx], order=c(par6,par3,par7), seasonal=list(order=c(par8,par4,par9), period=par5), include.mean=par10, method='ML'))
(forecast <- predict(arima.out,par1))
(lb <- forecast$pred - 1.96 * forecast$se)
(ub <- forecast$pred + 1.96 * forecast$se)
if (par2 == 0) {
x <- exp(x)
forecast$pred <- exp(forecast$pred)
lb <- exp(lb)
ub <- exp(ub)
}
if (par2 != 0) {
x <- x^(1/par2)
forecast$pred <- forecast$pred^(1/par2)
lb <- lb^(1/par2)
ub <- ub^(1/par2)
}
if (par2 < 0) {
olb <- lb
lb <- ub
ub <- olb
}
(actandfor <- c(x[1:nx], forecast$pred))
(perc.se <- (ub-forecast$pred)/1.96/forecast$pred)
bitmap(file='test1.png')
opar <- par(mar=c(4,4,2,2),las=1)
ylim <- c( min(x[first:nx],lb), max(x[first:nx],ub))
plot(x,ylim=ylim,type='n',xlim=c(first,lx))
usr <- par('usr')
rect(usr[1],usr[3],nx+1,usr[4],border=NA,col='lemonchiffon')
rect(nx1,usr[3],usr[2],usr[4],border=NA,col='lavender')
abline(h= (-3:3)*2 , col ='gray', lty =3)
polygon( c(nx1:lx,lx:nx1), c(lb,rev(ub)), col = 'orange', lty=2,border=NA)
lines(nx1:lx, lb , lty=2)
lines(nx1:lx, ub , lty=2)
lines(x, lwd=2)
lines(nx1:lx, forecast$pred , lwd=2 , col ='white')
box()
par(opar)
dev.off()
prob.dec <- array(NA, dim=fx)
prob.sdec <- array(NA, dim=fx)
prob.ldec <- array(NA, dim=fx)
prob.pval <- array(NA, dim=fx)
perf.pe <- array(0, dim=fx)
perf.mape <- array(0, dim=fx)
perf.mape1 <- array(0, dim=fx)
perf.se <- array(0, dim=fx)
perf.mse <- array(0, dim=fx)
perf.mse1 <- array(0, dim=fx)
perf.rmse <- array(0, dim=fx)
for (i in 1:fx) {
locSD <- (ub[i] - forecast$pred[i]) / 1.96
perf.pe[i] = (x[nx+i] - forecast$pred[i]) / forecast$pred[i]
perf.se[i] = (x[nx+i] - forecast$pred[i])^2
prob.dec[i] = pnorm((x[nx+i-1] - forecast$pred[i]) / locSD)
prob.sdec[i] = pnorm((x[nx+i-par5] - forecast$pred[i]) / locSD)
prob.ldec[i] = pnorm((x[nx] - forecast$pred[i]) / locSD)
prob.pval[i] = pnorm(abs(x[nx+i] - forecast$pred[i]) / locSD)
}
perf.mape[1] = abs(perf.pe[1])
perf.mse[1] = abs(perf.se[1])
for (i in 2:fx) {
perf.mape[i] = perf.mape[i-1] + abs(perf.pe[i])
perf.mape1[i] = perf.mape[i] / i
perf.mse[i] = perf.mse[i-1] + perf.se[i]
perf.mse1[i] = perf.mse[i] / i
}
perf.rmse = sqrt(perf.mse1)
bitmap(file='test2.png')
plot(forecast$pred, pch=19, type='b',main='ARIMA Extrapolation Forecast', ylab='Forecast and 95% CI', xlab='time',ylim=c(min(lb),max(ub)))
dum <- forecast$pred
dum[1:par1] <- x[(nx+1):lx]
lines(dum, lty=1)
lines(ub,lty=3)
lines(lb,lty=3)
dev.off()
load(file='createtable')
a<-table.start()
a<-table.row.start(a)
a<-table.element(a,'Univariate ARIMA Extrapolation Forecast',9,TRUE)
a<-table.row.end(a)
a<-table.row.start(a)
a<-table.element(a,'time',1,header=TRUE)
a<-table.element(a,'Y[t]',1,header=TRUE)
a<-table.element(a,'F[t]',1,header=TRUE)
a<-table.element(a,'95% LB',1,header=TRUE)
a<-table.element(a,'95% UB',1,header=TRUE)
a<-table.element(a,'p-value
(H0: Y[t] = F[t])',1,header=TRUE)
a<-table.element(a,'P(F[t]>Y[t-1])',1,header=TRUE)
a<-table.element(a,'P(F[t]>Y[t-s])',1,header=TRUE)
mylab <- paste('P(F[t]>Y[',nx,sep='')
mylab <- paste(mylab,'])',sep='')
a<-table.element(a,mylab,1,header=TRUE)
a<-table.row.end(a)
for (i in (nx-par5):nx) {
a<-table.row.start(a)
a<-table.element(a,i,header=TRUE)
a<-table.element(a,x[i])
a<-table.element(a,'-')
a<-table.row.end(a)
}
for (i in 1:fx) {
a<-table.row.start(a)
a<-table.element(a,nx+i,header=TRUE)
a<-table.element(a,round(x[nx+i],4))
a<-table.element(a,round(forecast$pred[i],4))
a<-table.element(a,round(lb[i],4))
a<-table.element(a,round(ub[i],4))
a<-table.element(a,round((1-prob.pval[i]),4))
a<-table.element(a,round((1-prob.dec[i]),4))
a<-table.element(a,round((1-prob.sdec[i]),4))
a<-table.element(a,round((1-prob.ldec[i]),4))
a<-table.row.end(a)
}
a<-table.end(a)
table.save(a,file='mytable.tab')
a<-table.start()
a<-table.row.start(a)
a<-table.element(a,'Univariate ARIMA Extrapolation Forecast Performance',7,TRUE)
a<-table.row.end(a)
a<-table.row.start(a)
a<-table.element(a,'time',1,header=TRUE)
a<-table.element(a,'% S.E.',1,header=TRUE)
a<-table.element(a,'PE',1,header=TRUE)
a<-table.element(a,'MAPE',1,header=TRUE)
a<-table.element(a,'Sq.E',1,header=TRUE)
a<-table.element(a,'MSE',1,header=TRUE)
a<-table.element(a,'RMSE',1,header=TRUE)
a<-table.row.end(a)
for (i in 1:fx) {
a<-table.row.start(a)
a<-table.element(a,nx+i,header=TRUE)
a<-table.element(a,round(perc.se[i],4))
a<-table.element(a,round(perf.pe[i],4))
a<-table.element(a,round(perf.mape1[i],4))
a<-table.element(a,round(perf.se[i],4))
a<-table.element(a,round(perf.mse1[i],4))
a<-table.element(a,round(perf.rmse[i],4))
a<-table.row.end(a)
}
a<-table.end(a)
table.save(a,file='mytable1.tab')