Free Statistics
of Irreproducible Research!
Description of Statistical Computation | |||||||||||||||||||||||||||||||||||||||||||||||||||||||||||||||||||||||||||||||||||||||||||||||||||||
|---|---|---|---|---|---|---|---|---|---|---|---|---|---|---|---|---|---|---|---|---|---|---|---|---|---|---|---|---|---|---|---|---|---|---|---|---|---|---|---|---|---|---|---|---|---|---|---|---|---|---|---|---|---|---|---|---|---|---|---|---|---|---|---|---|---|---|---|---|---|---|---|---|---|---|---|---|---|---|---|---|---|---|---|---|---|---|---|---|---|---|---|---|---|---|---|---|---|---|---|---|---|
| Author's title | |||||||||||||||||||||||||||||||||||||||||||||||||||||||||||||||||||||||||||||||||||||||||||||||||||||
| Author | *The author of this computation has been verified* | ||||||||||||||||||||||||||||||||||||||||||||||||||||||||||||||||||||||||||||||||||||||||||||||||||||
| R Software Module | rwasp_notchedbox1.wasp | ||||||||||||||||||||||||||||||||||||||||||||||||||||||||||||||||||||||||||||||||||||||||||||||||||||
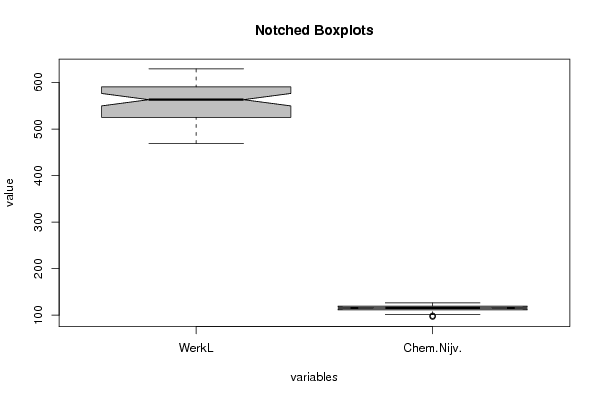
| Title produced by software | Notched Boxplots | ||||||||||||||||||||||||||||||||||||||||||||||||||||||||||||||||||||||||||||||||||||||||||||||||||||
| Date of computation | Fri, 18 Dec 2009 07:47:51 -0700 | ||||||||||||||||||||||||||||||||||||||||||||||||||||||||||||||||||||||||||||||||||||||||||||||||||||
| Cite this page as follows | Statistical Computations at FreeStatistics.org, Office for Research Development and Education, URL https://freestatistics.org/blog/index.php?v=date/2009/Dec/18/t126114772959787xg903vsv9h.htm/, Retrieved Sat, 27 Apr 2024 08:20:16 +0000 | ||||||||||||||||||||||||||||||||||||||||||||||||||||||||||||||||||||||||||||||||||||||||||||||||||||
| Statistical Computations at FreeStatistics.org, Office for Research Development and Education, URL https://freestatistics.org/blog/index.php?pk=69381, Retrieved Sat, 27 Apr 2024 08:20:16 +0000 | |||||||||||||||||||||||||||||||||||||||||||||||||||||||||||||||||||||||||||||||||||||||||||||||||||||
| QR Codes: | |||||||||||||||||||||||||||||||||||||||||||||||||||||||||||||||||||||||||||||||||||||||||||||||||||||
|
| |||||||||||||||||||||||||||||||||||||||||||||||||||||||||||||||||||||||||||||||||||||||||||||||||||||
| Original text written by user: | |||||||||||||||||||||||||||||||||||||||||||||||||||||||||||||||||||||||||||||||||||||||||||||||||||||
| IsPrivate? | No (this computation is public) | ||||||||||||||||||||||||||||||||||||||||||||||||||||||||||||||||||||||||||||||||||||||||||||||||||||
| User-defined keywords | |||||||||||||||||||||||||||||||||||||||||||||||||||||||||||||||||||||||||||||||||||||||||||||||||||||
| Estimated Impact | 169 | ||||||||||||||||||||||||||||||||||||||||||||||||||||||||||||||||||||||||||||||||||||||||||||||||||||
Tree of Dependent Computations | |||||||||||||||||||||||||||||||||||||||||||||||||||||||||||||||||||||||||||||||||||||||||||||||||||||
| Family? (F = Feedback message, R = changed R code, M = changed R Module, P = changed Parameters, D = changed Data) | |||||||||||||||||||||||||||||||||||||||||||||||||||||||||||||||||||||||||||||||||||||||||||||||||||||
| - [Notched Boxplots] [3/11/2009] [2009-11-02 21:10:41] [b98453cac15ba1066b407e146608df68] - R D [Notched Boxplots] [] [2009-12-18 14:47:51] [8af916b6a531ec49628252b0a0ece045] [Current] - RMPD [Univariate Data Series] [] [2009-12-21 16:28:58] [4409a44d89cea4fe559b38f99bc8a66c] - P [Univariate Data Series] [] [2010-12-26 15:36:47] [69c775ce4d55db2aa75a88e773e8d700] - PD [Univariate Data Series] [] [2010-12-29 11:26:52] [1253bc7c4737195066123d9caa6dfc18] - PD [Univariate Data Series] [] [2010-12-29 11:29:23] [1253bc7c4737195066123d9caa6dfc18] - PD [Univariate Data Series] [] [2010-12-29 11:30:43] [1253bc7c4737195066123d9caa6dfc18] - PD [Univariate Data Series] [] [2010-12-29 11:33:45] [1253bc7c4737195066123d9caa6dfc18] - PD [Univariate Data Series] [] [2010-12-29 11:35:39] [1253bc7c4737195066123d9caa6dfc18] - R PD [Univariate Data Series] [uni data] [2011-11-17 16:19:51] [141ef847e2c5f8e947fe4eabcb0cf143] - RM D [Univariate Explorative Data Analysis] [uni Eda] [2011-11-17 16:35:18] [141ef847e2c5f8e947fe4eabcb0cf143] - R PD [Univariate Data Series] [uni data economis...] [2011-11-17 16:25:38] [141ef847e2c5f8e947fe4eabcb0cf143] - RM D [Skewness and Kurtosis Test] [tutorial] [2011-11-17 18:10:50] [141ef847e2c5f8e947fe4eabcb0cf143] - RM D [Histogram] [1e vraag tutorial] [2011-11-17 18:15:40] [141ef847e2c5f8e947fe4eabcb0cf143] - RM D [Mean Plot] [2e vraag tut] [2011-11-17 18:25:25] [141ef847e2c5f8e947fe4eabcb0cf143] - R PD [Univariate Data Series] [] [2011-12-07 15:34:19] [74be16979710d4c4e7c6647856088456] - R PD [Univariate Data Series] [Plot & Describe D...] [2011-12-07 15:38:25] [d1ce18d003fa52f731d1c3ce8b58d5f9] - R P [Univariate Data Series] [Plot & Describe D...] [2011-12-07 15:40:29] [d1ce18d003fa52f731d1c3ce8b58d5f9] - PD [Univariate Data Series] [Plot & Describe D...] [2011-12-07 15:57:08] [d1ce18d003fa52f731d1c3ce8b58d5f9] - PD [Univariate Data Series] [Plot & Describe D...] [2011-12-07 16:32:23] [d1ce18d003fa52f731d1c3ce8b58d5f9] - PD [Univariate Data Series] [Plot & Describe D...] [2011-12-07 16:34:26] [d1ce18d003fa52f731d1c3ce8b58d5f9] - PD [Univariate Data Series] [Plot & Describe D...] [2011-12-07 16:46:48] [d1ce18d003fa52f731d1c3ce8b58d5f9] - PD [Univariate Data Series] [Plot & Describe D...] [2011-12-07 16:49:05] [d1ce18d003fa52f731d1c3ce8b58d5f9] - PD [Univariate Data Series] [Plot & Describe D...] [2011-12-07 16:50:56] [d1ce18d003fa52f731d1c3ce8b58d5f9] - PD [Univariate Data Series] [Plot & Describe D...] [2011-12-07 16:54:59] [d1ce18d003fa52f731d1c3ce8b58d5f9] - PD [Univariate Data Series] [Plot & Describe D...] [2011-12-07 16:57:00] [d1ce18d003fa52f731d1c3ce8b58d5f9] - D [Notched Boxplots] [] [2009-12-21 16:42:20] [4409a44d89cea4fe559b38f99bc8a66c] - [Notched Boxplots] [] [2010-12-26 16:14:03] [69c775ce4d55db2aa75a88e773e8d700] - D [Notched Boxplots] [] [2010-12-29 11:51:31] [1253bc7c4737195066123d9caa6dfc18] - D [Notched Boxplots] [] [2010-12-29 11:53:31] [1253bc7c4737195066123d9caa6dfc18] - D [Notched Boxplots] [] [2010-12-29 11:55:30] [1253bc7c4737195066123d9caa6dfc18] - D [Notched Boxplots] [] [2010-12-29 11:57:41] [1253bc7c4737195066123d9caa6dfc18] | |||||||||||||||||||||||||||||||||||||||||||||||||||||||||||||||||||||||||||||||||||||||||||||||||||||
| Feedback Forum | |||||||||||||||||||||||||||||||||||||||||||||||||||||||||||||||||||||||||||||||||||||||||||||||||||||
Post a new message | |||||||||||||||||||||||||||||||||||||||||||||||||||||||||||||||||||||||||||||||||||||||||||||||||||||
Dataset | |||||||||||||||||||||||||||||||||||||||||||||||||||||||||||||||||||||||||||||||||||||||||||||||||||||
| Dataseries X: | |||||||||||||||||||||||||||||||||||||||||||||||||||||||||||||||||||||||||||||||||||||||||||||||||||||
611 120.9 594 119.6 595 125.9 591 116.1 589 107.5 584 116.7 573 112.5 567 113 569 126.4 621 114.1 629 112.5 628 112.4 612 113.1 595 116.3 597 111.7 593 118.8 590 116.5 580 125.1 574 113.1 573 119.6 573 114.4 620 114 626 117.8 620 117 588 120.9 566 115 557 117.3 561 119.4 549 114.9 532 125.8 526 117.6 511 117.6 499 114.9 555 121.9 565 117 542 106.4 527 110.5 510 113.6 514 114.2 517 125.4 508 124.6 493 120.2 490 120.8 469 111.4 478 124.1 528 120.2 534 125.5 518 116 506 117 502 105.7 516 102 528 106.4 533 96.9 536 107.6 537 98.8 524 101.1 536 105.7 587 104.6 597 103.2 581 101.6 | |||||||||||||||||||||||||||||||||||||||||||||||||||||||||||||||||||||||||||||||||||||||||||||||||||||
Tables (Output of Computation) | |||||||||||||||||||||||||||||||||||||||||||||||||||||||||||||||||||||||||||||||||||||||||||||||||||||
| |||||||||||||||||||||||||||||||||||||||||||||||||||||||||||||||||||||||||||||||||||||||||||||||||||||
Figures (Output of Computation) | |||||||||||||||||||||||||||||||||||||||||||||||||||||||||||||||||||||||||||||||||||||||||||||||||||||
Input Parameters & R Code | |||||||||||||||||||||||||||||||||||||||||||||||||||||||||||||||||||||||||||||||||||||||||||||||||||||
| Parameters (Session): | |||||||||||||||||||||||||||||||||||||||||||||||||||||||||||||||||||||||||||||||||||||||||||||||||||||
| par1 = grey ; | |||||||||||||||||||||||||||||||||||||||||||||||||||||||||||||||||||||||||||||||||||||||||||||||||||||
| Parameters (R input): | |||||||||||||||||||||||||||||||||||||||||||||||||||||||||||||||||||||||||||||||||||||||||||||||||||||
| par1 = grey ; | |||||||||||||||||||||||||||||||||||||||||||||||||||||||||||||||||||||||||||||||||||||||||||||||||||||
| R code (references can be found in the software module): | |||||||||||||||||||||||||||||||||||||||||||||||||||||||||||||||||||||||||||||||||||||||||||||||||||||
z <- as.data.frame(t(y)) | |||||||||||||||||||||||||||||||||||||||||||||||||||||||||||||||||||||||||||||||||||||||||||||||||||||